
 CC-BY 4.0
Introduction
Species Distribution Models (SDMs; Elith and Leathwick, 2009), in addition to being key tools to further our knowledge of biodiversity, are key components of effective conservation decisions (Guisan et al., 2013), planning (McShea, 2014), and ecological impact assesment (Baker et al., 2021). The training and evaluation of an SDM is a complex process, with key decisions to make on design and reporting (Zurell et al., 2020). The ability to use the correct data format of representation at these steps is central to support the correct interpretation of these models (Araújo et al., 2019). This is particularly true since the choice of data source can affect the prediction significantly (Merkenschlager et al., 2023; Arenas-Castro et al., 2022; Booth, 2022), suggesting that there is a need for flexible pipelines in which data sources can be conveniently swapped. In recent years, there has been an increase in the number of software packages and tools to assist ecologists with various steps of the development of species distribution models.
As Kass et al. (2024) point out, this increase in the diversity of software tools (most of them in the R language) is a good thing. Because SDMs are a general-purpose methodology, a varied software offer increases the chances that specific decisions can be chained together in the way that best support a specific use case. By making code available for all users, package developers reduce the need for custom implementation of analytical steps, and contribute to the adoption of good practices in the field. However, because building, validating, and applying SDMs requires a diversity of data types, from different sources, many existing packages have been designed independently. Therefore, they may suffer from low interoperability, which can create friction when using multiple tools together. As an illustration, Kellner et al. (2025) highlight that, out of publications on abundance or distribution models that share code and data, about 20% are not reproducible because of issues in package dependencies.
To promote interoperability and improve reproductibility, tools that provide an integrated environment are important. In this manuscript, we present SpeciesDistributionToolkit (abbreviated as SDT), a meta-package for the Julia programming language, offering an integrated environment for the retrieval, formatting, and interpretation of data relevant to the modeling of species distributions. SDT was in part designed to work within the BON-in-a-Box project (Gonzalez et al., 2023; Griffith et al., 2024), a GEO BON initiative to facilitate the calculation and reporting of biodiversity indicators supporting the Kunming-Montréal Global Biodiversity Framework. A leading design consideration for SDT was therefore to maximize interoperability between components and functionalities from the ground up. This is achieved through three mechanisms. First, by relying on strict semantic versioning: package releases provide information about the compatibility of existing code. Second, through the use of interfaces: separate software components (including ones external to the package) can interact without prior knowledge of either implementation, and without dependencies between the components of SDT. Finally, through the use of Julia’s extension mechanism, where packages gain functionalities when loaded within the same project.In this manuscript, we provide a high-level overview of the functionalities of the package(s) forming SDT. We then discuss design principles that facilitate long-term maintenance, development, and integration. We finish by presenting four illustrative case studies: extraction of data at known species occurrences, manipulation of multiple geospatial layers, training and explanation of a SDM, and creation of virtual communities to simulate the spatial distribution of ecological uniqueness. This later case study is intended to provide an impression of what using SDT as a support for the development of novel analyses feels like. All of the case studies are available as supplementary material, in the form of fully reproducible, self-contained Jupyter notebooks.
Methods
SpeciesDistributionToolkit is released as a package for the Julia programming language (Bezanson et al., 2017). It is licensed under the open-source initiative approved MIT license. It has evolved from a previous collection of packages to handle GBIF and raster data (Dansereau and Poisot, 2021), and now provides extended functionalities as well as improved performance. The package is registered in the Julia package repository and can be downloaded and installed anonymously. It is compatible with the current stable and long-term support (LTS) releases of Julia. The full source code, complete commit history, plans for future development, and a forum, are available at https://github.com/PoisotLab/SpeciesDistributionToolkit.jl. This page additionally has a link to the documentation, containing a full reference for the package functions, a series of brief how-to examples, and longer vignettes showcasing more integrative tutorials.
An overview of the SDT package is given in Figure 1. The project is organized as a “monorepo”, in which separate but interoperable packages (meaning that they can be installed independently, but are designed to work cohesively) reside. This allows expanding the scope of the package by moving functionalities into new component packages, without requiring interventions from users. As SDT is registered in the Julia package repository, it can be installed by using add SpeciesDistributionToolkit when in package mode at the Julia prompt. When loading the SDT package with using SpeciesDistributionToolkit, all component packages are automatically and transparently loaded. Therefore, users do not need to know where a specific method or function resides to use it. The monorepo structure has an important advantage for users: the code of all component packages can be found in the same location, and it makes inspecting the internal implementation of any package easier. In addition, users can open an issue describing a problem or desired feature within the monorepo, without needing to understand which component package is the right target for this issue. This both decreases barriers to interact with the software, while also facilitating the work of contributors who can look at all the issues to address in a centralized way. Similarly, monorepo lend themselves to integrated documentation, which is the approach we have chosen with the online SDT manual.
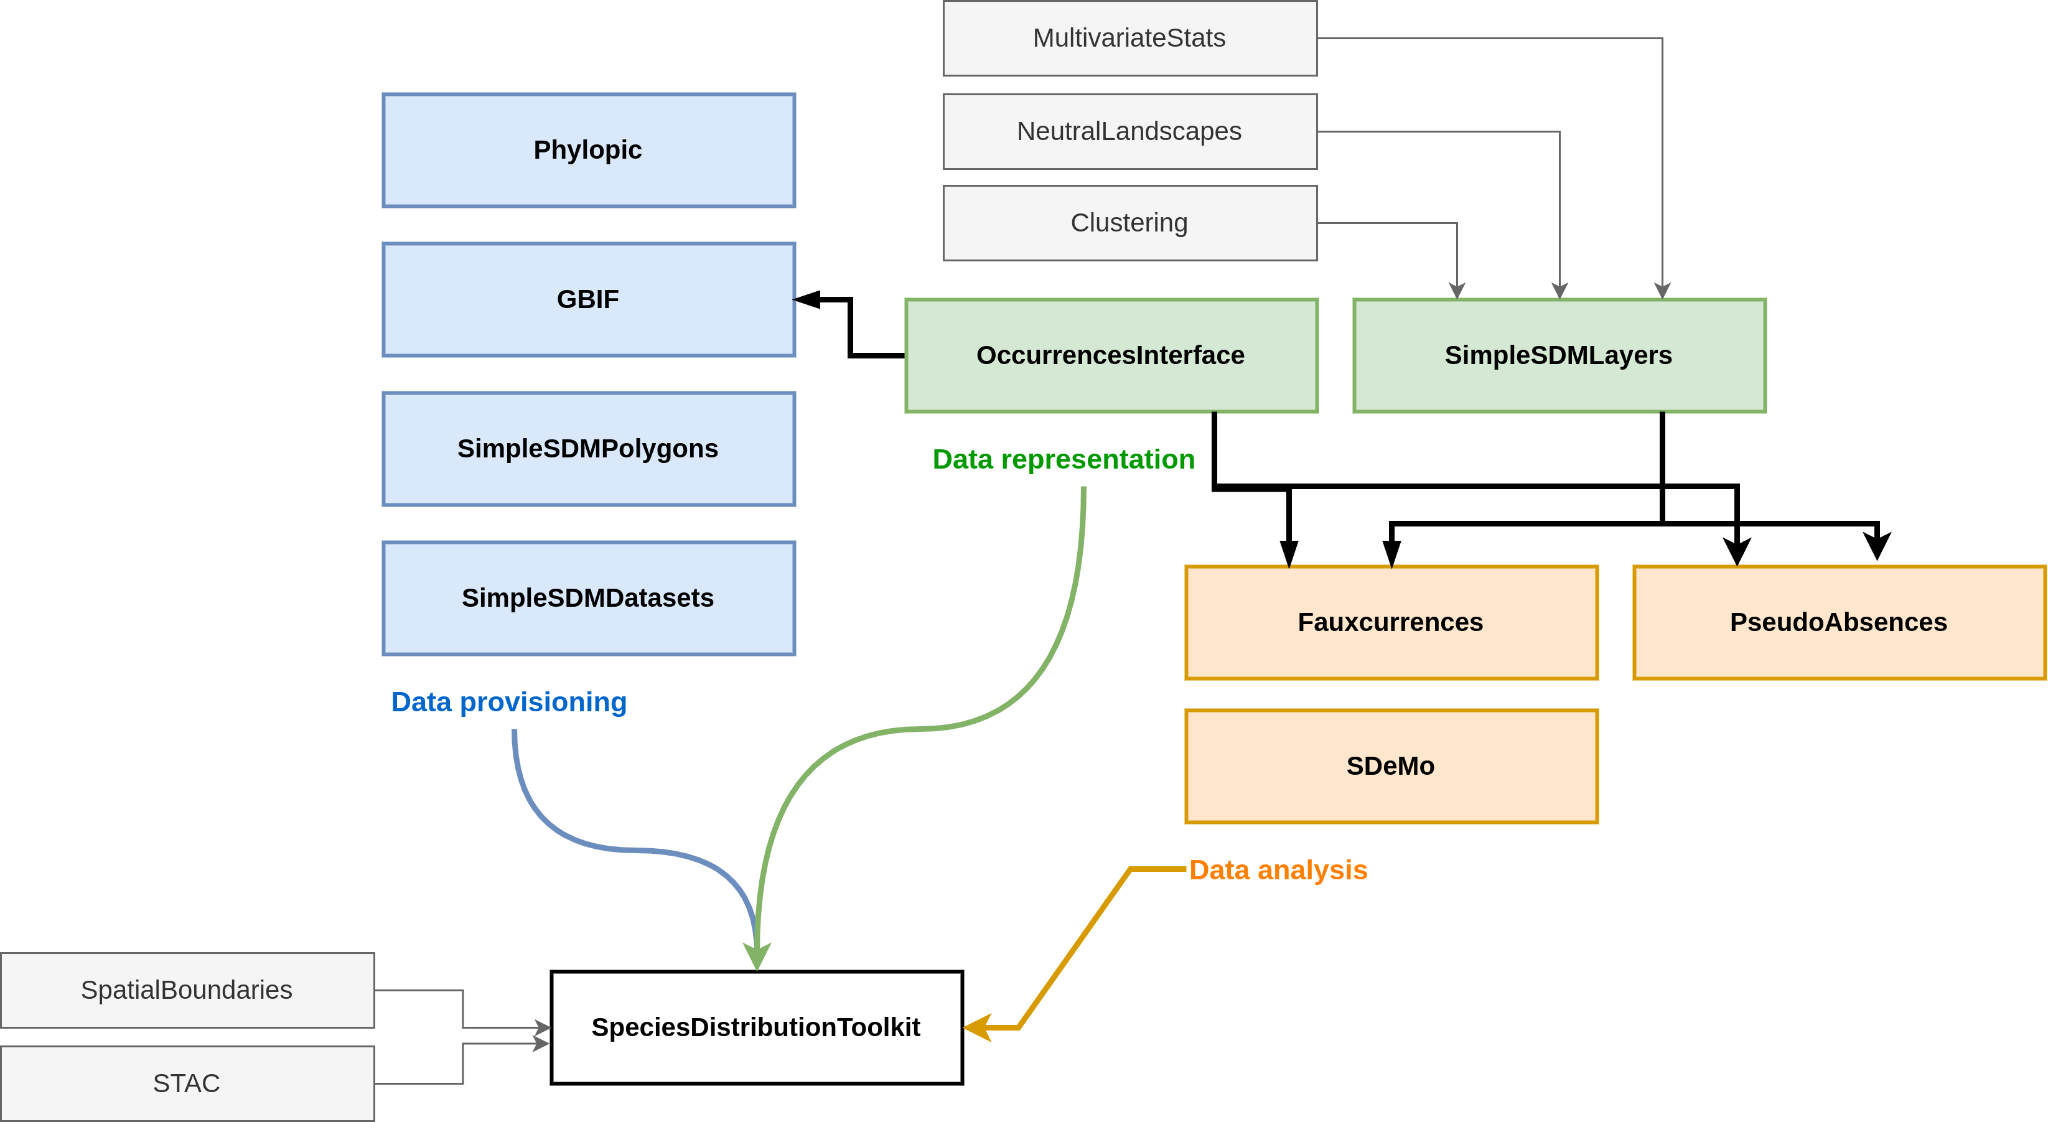
Figure 1 - Overview of the packages included in SpeciesDistributionToolkit. The packages are color-coded by intended use (acquisition, representation, and analysis of data). The specific content of each package is presented in the main text. Note that because the package relies on interfaces to facilitate code interoperability, there are few dependency relationships (black arrows). Some packages can interact with data sources, represented on the left side of the figure. When loading SpeciesDistributionToolkit, all public methods from the package are accessible to the user. Packages that are supported through extensions are in dashed boxes.
SDT uses the built-in Julia package manager to keep all dependencies up to date. Furthermore, we use strict semantic versioning: major versions correspond to changes that would break user-developped code; minor versions represent additional functionalities; patch releases cover minor bug fixes or documentation changes. All component packages are versioned independently, and have their own CHANGELOG file documenting each release. This strict reliance on semantic versioning removes the issues of maintaining compatibility when new functionalities are added: all releases in the v1.x.x branch of SDT depend on component packages in their respective v1.x.x branch, and users can benefit from new functionalities without needing to adapt existing code. This behavior is extensively tested, both through unit tests and through integration testing generated as part of the online documentation.
Component packages
The SDT package primarily provides integration between the other packages via method overloading (reusing method names for intuitive and concise code), allowing to efficiently join packages together (Roesch et al., 2023). Additional functionalities that reside in the top-level package are the handling of polygon data and zonal statistics, and various quality of life methods. Because of the modular nature of the code, any of these functions can be transparently moved to their own packages without affecting reproducibility. Note that all packages can still be installed (and would be fully functional) independently.
The SimpleSDMLayers package offers a series of types to represent raster data in arbitrary projections defined by a proj string (Evenden et al., 2024). This package provides the main data representation for most spatial functionalities that SDT supports, and handles saving and loading data. It also contains utility functions to deal with raster data, including interpolation to different spatial grids and CRS, rescaling and quantization of data, masking, and most mathematical operations that can be applied to rasters.
OccurrencesInterface is a light-weight package to provide a common interface for occurrence data. It implements abstract and concrete types to define a single occurrence and a collection thereof, and a series of methods allowing any occurrence data provider (e.g. GBIF) or data representation to become fully interoperable with the rest of SDT. All SDT methods that handle occurrence data do so through the interface provided by the OccurrencesInterface package, allowing future data sources to be integrated without the need for new code.
The GBIF package offers access to the gbif.org streaming API (GBIF: The Global Biodiversity Information Facility, 2025), including the ability to retrieve, filter, and restart downloads. Although this package provides a rich data representation for occurrence data when access to the full GBIF data schema is required, all the objects it returns adhere to the OccurrencesInterface interface. The package also offers the functionality to download datasets from GBIF using their DOI.
SimpleSDMDatasets implements an interface to retrieve and locally store raster data, which can be extended by users to support additional data sources. It offers access to a series of common data sources for spatial biodiversity modeling, including the biodiversity mapping project (Jenkins et al., 2013), the EarthEnv collection for land cover (Tuanmu and Jetz, 2014) and habitat heterogeneity (Tuanmu and Jetz, 2015), Copernicus land cover 100m data (Buchhorn et al., 2020), PaleoClim (Brown et al., 2018) data, WorldClim 1 and 2 (Fick and Hijmans, 2017) and CHELSA 1 and 2 (Karger et al., 2017) and their projections under various RCPs and SSPs.
SimpleSDMPolygons uses the interface from SimpleSDMDatasets to offer access to geospatial polygons, including the GADM database, the OpenStreetMap polygon API, as well as several providers for georegions, ecoregions, and ecoprovinces (Dinerstein et al., 2017; Olson et al., 2001).
Phylopic offers a wrapper around the phylopic.org API to download silhouettes for taxonomic entities. It also provides utilities for citation of the downloaded images. Its functionalities are similar to the rphylopic package (Gearty and Jones, 2023).
Fauxcurrences is inspired by the work of Osborne et al. (2022), and allows generating a series of simulated occurrence data that have the same statistical structure as observed ones. The package supports multi-species data, with user-specified weights for conserving intra and inter-specific occurrence distances.
PseudoAbsences offers functions to place pseudo-absences points on layers, under various constraint on range and distance to existing observations (Barbet-Massin et al., 2012).
Finally, SDeMo provides a high-level interface to the training, validation, and interpretation of species distribution modeling. The package is built around a series of data transformation steps (PCA, Whitening, z-score, which can be chained together) and several classifiers, currently including BIOCLIM (Booth et al., 2014), Naive Bayes, logistic regression, and decision trees. SDeMo offers functions to demonstrate training and evaluation of SDMs, as well as techniques related to heterogeneous ensembles and bagging with support for arbitrary consensus (Marmion et al., 2009) and voting (Drake, 2014) functions. SDeMo promotes the use of interpretable techniques: the package supports regular (Elith et al., 2005) and inflated (Zurell et al., 2012) partial responses, as well as the calculation and mapping of Shapley values (Wadoux et al., 2023; Mesgaran, Cousens, and Webber, 2014) using the standard Monte-Carlo approach (Mitchell et al., 2021). Counterfactuals (Van Looveren and Klaise, 2019; Karimi et al., 2019), representing perturbation of the input data leading to the opposite prediction (i.e. “what environmental conditions would lead to the species being absent”) can also be generated. The API of SDeMo has been designed to (i) enforce the use of best practices, and (ii) be consistent across analyses, so that the package can be used for educational material. Despite the focus on education, SDeMo has been thoroughly tested and may be used for research. As it implements a generic interface to any predictive model, users can expand it by adding additional classifiers or transformers. This can be done either through a contribution to the SDT repository, or as part of the code written by users for a specific analysis.
Case studies
In this section, we provide a series of case studies to illustrate the use of the package. The on-line manual offers longer tutorials, as well as a series of how-to vignettes to illustrate the full scope of what the package allows. As the notebooks accompanying this article cover the full code required to run these case studies, we do not present code snippets in the main text (as they are presented with detailed explanations in the Supp. Mat.), but rather focus on explaining how the component packages work together in each example.
Landcover consensus map
In this case study (Supp. Mat. 1), we retrieve the land cover data from Tuanmu and Jetz (2014), clip them to a GeoJSON polygon describing the country of Paraguay (SimpleSDMPolygons can download data directly from several polygon providers), and apply the mosaic operation to figure out which class is the most locally abundant. This case study uses the SimpleSDMDatasets package to download (and locally cache) the raster data, as well as the SimpleSDMLayers package to provide basic utility functions on raster data. The results are presented in Figure 2.
SimpleSDMDatasets uses local storage of raster data for future use, to avoid re-downloading data upon repeated use. The location of the data is (i) standardized by the package itself, making the file findable to humans, and (ii) changeable by the user to, e.g., store the data within the project folder rather than in a central location. As much as possible, SDT will only read the part of the raster data that is required given the region of interest to the user. This is done by providing additional context in the form of a bounding box (in WGS84, regardless of the underlying raster data projection, in line with the GeoJSON specification). SDT has methods to calculate the bounding box for all the objects it supports.
Using data from GBIF
SDT provides strong integration between data on species occurrences and source of geospatial information. To illustrate this, we will collect data on the distribution of Akodon montensis (Rodentia, family Cricetidae), a known host of orthohantaviruses (Burgos et al., 2021; Owen et al., 2010), in Paraguay. In Supp. Mat. 2 we (i) request occurrence data using the GBIF package, (ii) download the silhouette of the species through Phylopic, and (iii) extract temperature and precipitation data at the points of occurrence based on bioclimatic data layers. The results are presented in Figure 3. The full notebook includes information about basic operations on raster data, as well as extraction of data based on occurrence records.
In practice, although the data are retrieved using the GBIF package, they are used internally by SDT through the OccurrencesInterface package. This package defines a small convention to handle georeferenced occurrence data, and allows to transparently integrate additional occurrence sources. By defining a handful of methods for a custom data type, or by using the conversions built into the package, users can plug-in any occurrence data source or csv file, and enjoy full compatibility with the entire SDT functionalities.
The GBIF package also supports download of archived GBIF datasets; in the following example, we have generated a dataset from this query, which can be accessed online (GBIF.org, 2025).

Figure 2 - Land cover consensus (defined as the class with the strongest local representation) in the country of Paraguay. Only the classes that were most abundant in at least one pixel are represented. The code to produce this figure is available as Supp. Mat. 2.

Figure 3 - Relationship between temperature and precipitation (BIO1 and BIO12) at each georeferenced occurrence known to GBIF for Akodon montensis. The code to produce this figure is available as Supp. Mat. 1.
Training a species distribution model
In this case study, we illustrate the integration of SDeMo and SimpleSDMLayers to train a species distribution model. Specifically, we re-use the data from Figure 3, with additional layers of bioclimatic variables. We train a rotation forest (Bagnall et al., 2018), an homogeneous ensemble of PCA followed by decision trees where each model has a subset of features and training data. The results are presented in Figure 4. The model is built by selecting an optimal suite of BioClim variables, then predicted in space, and the resulting predicted species range is finally clipped by the elevational range observed in the occurrence data. The data transformations in SDeMo are always applied in a way that prevents the possibility of data leakage (Stock et al., 2023). Because SDeMo works through generic functions, these methods can be applied to any model specified by the user. In practice, generic purpose ML frameworks in Julia, notably MLJ (Blaom et al., 2020), can also be used and interfaced with SDT by using the classifier and transformer interface.
By default, SDeMo will always split data for cross-validation in a way that respect class balance; in other words, the prevalence of the species is always the same in the validation and training set (this is also true when bootstrapping observations to construct homogeneous ensembles). This behavior can be adjusted, or the user may design their own training and validation sets. In the future, PseudoAbsences will be extended to introduce stratified cross-validation (Roberts et al., 2017).
The full notebook (Supp. Mat. 3) has additional information on routines for variable selection, stratified cross-validation, as well as the construction of the ensemble from a single PCA and decision tree. In addition, we report in Figure 5 the partial and inflated partial responses to the most important variable (highlighting an interpretable effect of the variable in the model), as well as the (Monte-Carlo) Shapley values (Wadoux et al., 2023; Mitchell et al., 2021) for each prediction in the training set. Checking the partial responses, in particular in space, is an important step, as some bioclimatic variables are known to have discontinuities stemming from their interpolation that can bias the predicted range of a species (Booth, 2022).
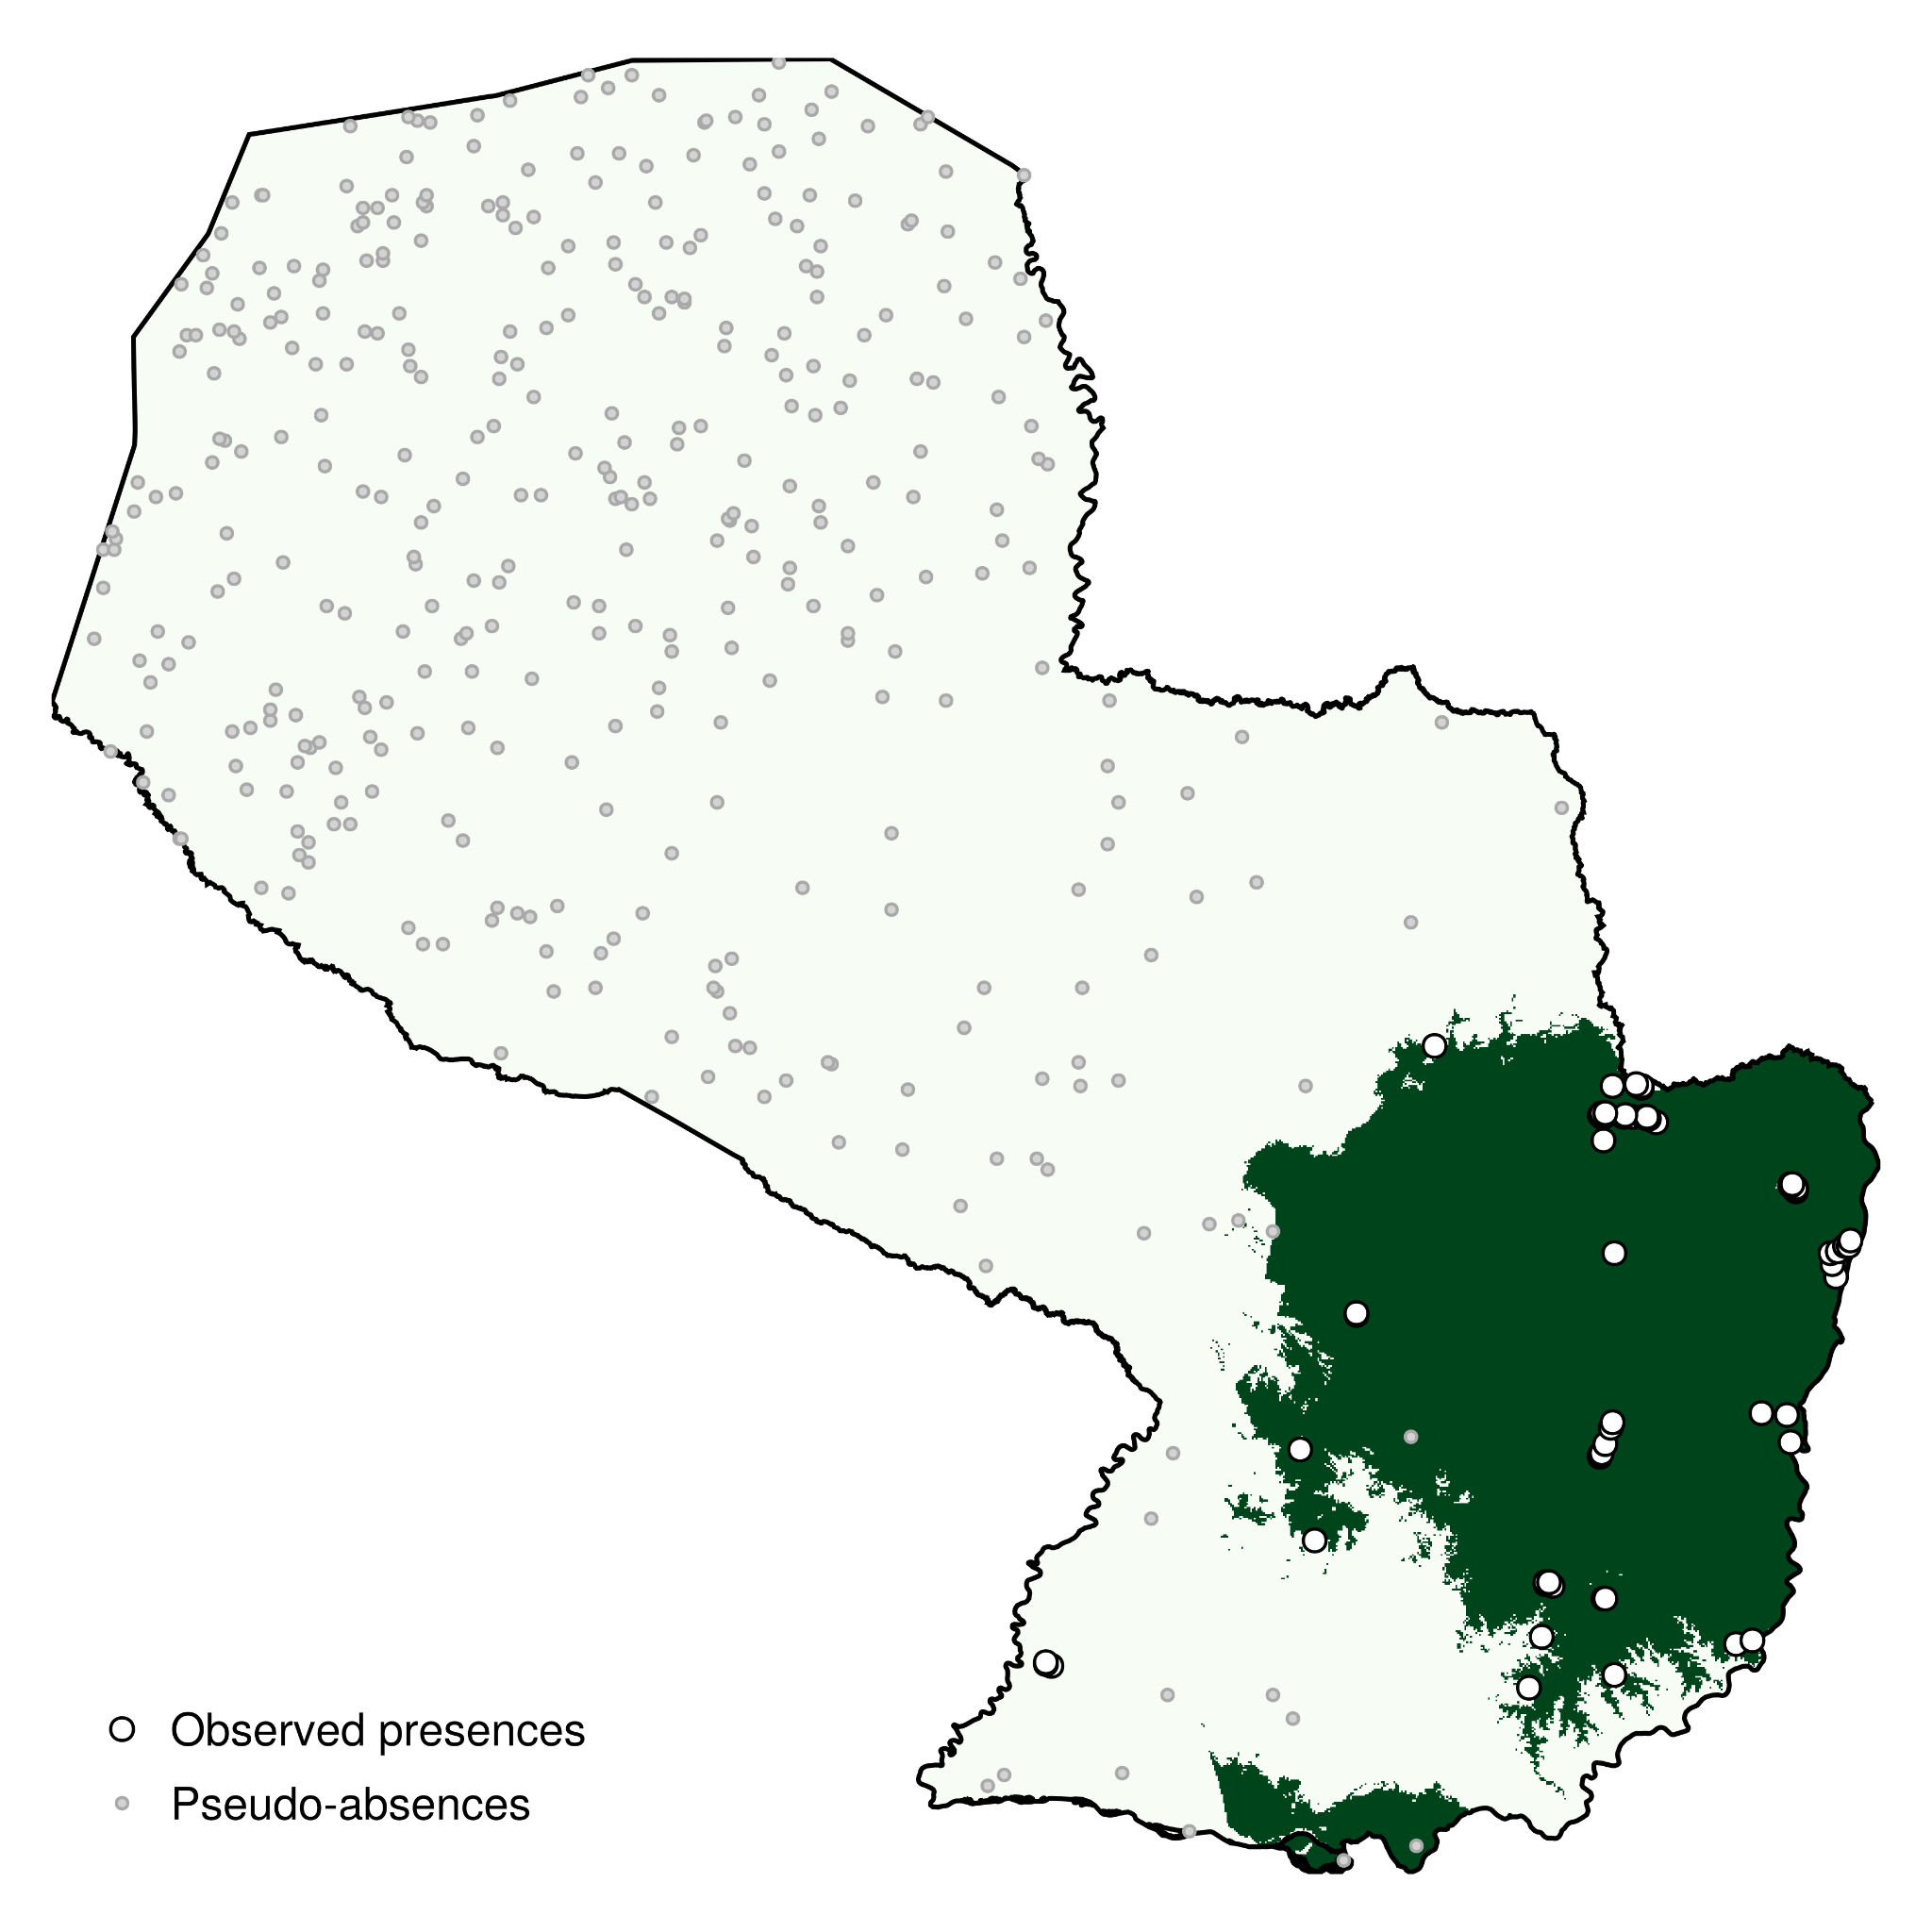
Figure 4 - Predicted range of Akodon montensis in Paraguay based on a rotation forest trained on GBIF occurrences and the BioClim variables. The predicted range is clipped to the elevational range of the species. The code to produce this figure is available as Supp. Mat. 3.

Figure 5 - Partial responses (red) and inflated partial responses (grey) to the most important variable. In addition, the Shapley values for all training data are presented in the same figure; green points are presences, and pale points are pseudo-absences. Shapley values were added to the average model prediction to be comparable to partial responses. The code to produce this figure is available as Supp. Mat. 3.
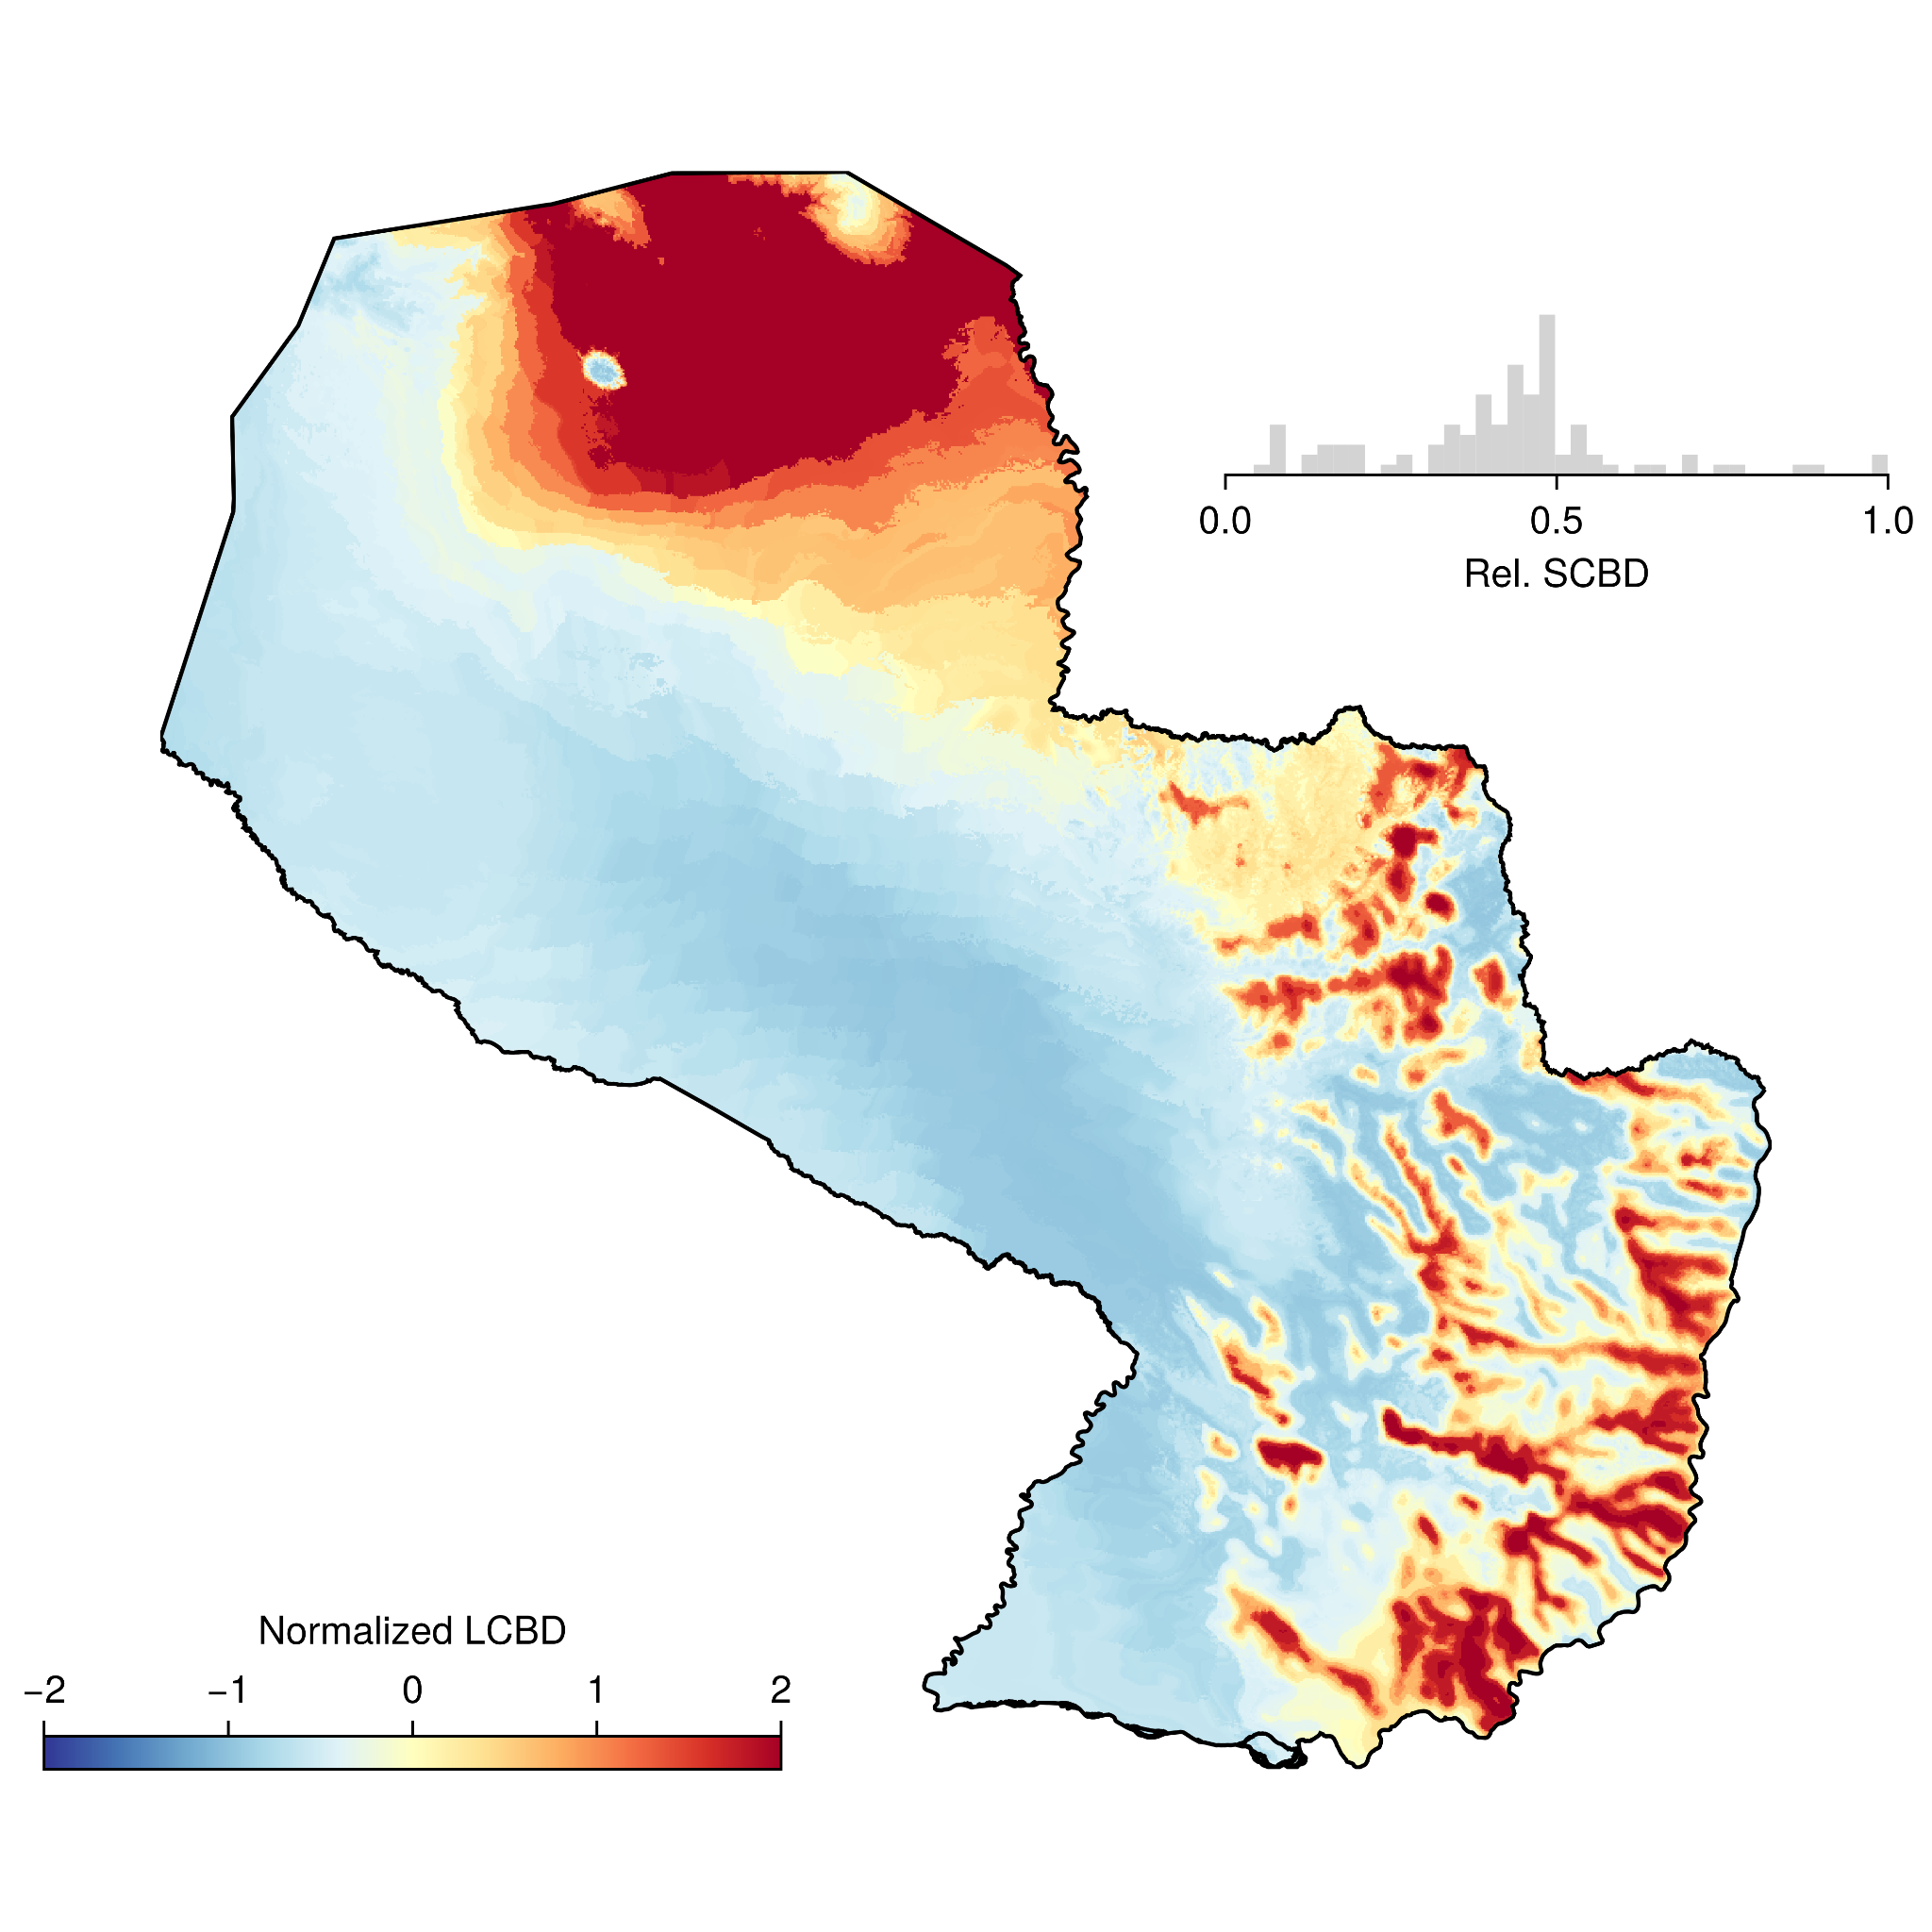
Figure 6 - Virtual distribution of normalized (mean of 0 and unit variance) locality contribution to beta-diversity (Legendre and De Cáceres, 2013), based on a pool of 100 virtual species. The inset histogram represents the standardized species contribution to beta-diversity. Red areas represent comparatively more unique areas in terms of simulated species composition. The code to produce this figure is available as Supp. Mat. 4.
Species and location contribution to beta diversity
In the final case study (Supp. Mat. 4), we simulate the distribution of virtual species (Hirzel et al., 2001) with a logistic response to two environmental covariate (Leroy et al., 2016). We then use this simulated sample to perform the decomposition of 𝛽-diversity introduced by Legendre and De Cáceres (2013) and applied by Dansereau et al. (2022) to spatially continuous data. This simulates the potential distribution of hotspots and coldspots of ecological uniqueness. The results are presented in Figure 6.
Because the layers used by SDT are broadcastable, we can rapidly apply a function (here, the logistic response to the environmental covariate) to each layer, and then multiply the suitabilities together. The last step is facilitated by the fact that most basic arithmetic operations are defined for layers, allowing for example to add, multiply, substract, and divide them by one another.
Conclusion
We have presented SpeciesDistributionToolkit, a package for the Julia programming language aiming to facilitate the collection, curation, analysis, and visualisation of data commonly used in species distribution modeling. Through the use of interfaces and a modular design, we have made this package robust to changes, easy to add functionalities to, and well integrated to the rest of the Julia ecosystem. All code for the case studies can be found in Supp. Mat. 1-4. Plans for active development of the package are focused on (i) additional techniques for pseudo-absence generations, to be incorporated in the PseudoAbsences package, (ii) full compatibility with the MultivariateStatistics for transformation, and (iii) additional SDeMo functionalities to allow cross-validation techniques with biologically relevant structure (Roberts et al., 2017).
The SDT package benefits from close integration with other packages in the Julia universe. Notably, this includes Makie (including GeoMakie; Danisch and Krumbiegel, 2021) for plotting and interactive data visualisation: all relevant plot types are overloaded for layer and occurrence data. Most data handled by SDT can be exported using the Tables interface, which allows data to be consumed by other packages like DataFrames (Bouchet-Valat and Kamiński, 2023) and MLJ (Blaom et al., 2020), or directly saved as csv files. Interfaces to internal Julia methods are implemented whenever they are pertinent. SimpleSDMLayers and OccurrencesInterface objects behave like arrays, are iterable, and broadcastable. The SDeMo package relies in part on the StatsAPI interface, allowing to easily define new data transformation and classifier types to support additional features. Achieving integration with other packages through method overloading and the adherence to well-established interfaces is important, as it increases the chances that additional functionalities external to SDT can be used directly or fully supported with minimal addition of code. For situations where interfaces are not sufficient to link with other packages, we rely on Julia’s extension mechanism. For instance, SimpleSDMLayers objects can be used with Clustering, MultivariateStats, as well as SpatialBoundaries (Strydom and Poisot, 2023), with strict version bounds, ensuring that this integration will remain usable regardless of possible changes in external packages.
A key advantage of Julia for species distribution modeling is its emphasis on extensibility and composability. In developing SDT, we leveraged these strengths by ensuring that each component package operates independently, while the top-level package provides additional methods to integrate their functionalities. Through method overloading, we minimize the number of unique function names users must learn—core operations such as arithmetic, dimension queries, and statistical summaries are consistently available across relevant data types. This unified approach not only streamlines the user experience but also makes the code more readable and accessible, which is particularly beneficial in educational settings. SDT is intentionally structured to promote best practices and long-term sustainability. The unified interface for occurrence, raster, and polygon data allows new data sources or representations to be incorporated with minimal changes to existing workflows. Strict adherence to semantic versioning and interface-based design ensures that updates do not compromise reproducibility. Advanced model interpretation tools—including Shapley values and counterfactuals—are built in, which will help with their adoption, and users can extend the modeling pipeline with custom classifiers or data transformations via Julia’s multiple dispatch.
Data, script, and code availability
The package can be installed from the general Julia registry, and the version used for this manuscript is archived at https://doi.org/10.5281/zenodo.15926733 (Poisot et al., 2025a); occurrence data for Akodon montensis are published by GBIF.org and available from https://doi.org/10.15468/dl.d3cxpr (GBIF.org, 2025); the code for all supplementary material is available from https://doi.org/10.5281/zenodo.15923830 (Poisot et al., 2025b). All of these resources can be accessed for free and anonymously.
Conflict of interest disclosure
The authors declare that they comply with the PCI rule of having no financial conflicts of interest in relation to the content of the article. Timothée Poisot is a recommender and member of the managing board of PCI Ecology.
Funding
TP is funded by an NSERC Discovery grant, a Discovery Acceleration Supplement grant, and a Wellcome Trust grant (223764/Z/21/Z). MDC is funded by an IVADO Postdoctoral Fellowship.
Acknowledgements
Preprint version 2 of this article has been peer-reviewed and recommended by Peer Community In Ecology (https://doi.org/10.24072/pci.ecology.100789; Estay, 2025).