
 CC-BY 4.0
Introduction
The dairy goat sector faces many challenges, such as animals with reduced longevity (Palhière et al., 2018) and high replacement costs. In the future design of livestock farming, breeding and managing robust animals is on the agenda of many research programs. One of the key elements of robustness is to consider goats as a biological system in which productive functions (e.g., lactation, growth, reproduction, etc…) dynamically interact through complex mechanisms involving nutrient partitioning (Bauman & Currie, 1980; Friggens et al., 2017). Nutrient partitioning implies that energy cannot be maximized across all productive functions and therefore some functions are given priority over others, especially to support some physiological stages (e.g. lactation). Thus, individual variability in performance could reveal different nutrient partitioning strategies. A first important aspect to explain changes in nutrient partitioning is the succession of reproductive cycles throughout life. This modifies priorities among functions to support a given physiological stage (e.g., gestation, lactation). In addition to these homeorhetic drivers, priorities can be modified by various aspects of the farming system environment. For instance, it is well documented that genetic selection for milk production has altered priorities among functions in dairy cattle leading to health and reproductive disorders (Pryce et al., 2001; Roche et al., 2009; Friggens et al., 2010). Indeed, high genetic merit for milk has led to energy partitioning in favor of lactation over other biological functions. It is also known that priorities can be modified to cope with nutritional constraints. For instance, most of female mammals will not invest energy in pregnancy during feed shortage (Friggens, 2003).As a central function to support lactation and as a buffer for variation in nutritional environment, body reserves play a central role in energy partitioning among productive functions.
Assessing the diversity of phenotypic lactation curves reflecting productive functions (e.g., milk yield (MY) and body reserves (body weight (BW), body condition score (BCS)) is a way to understand interactions among biological functions and potential trade-offs between them. With time series data based on more frequent measures (e.g., MY, BW, BCS…), the use of mathematical models can provide information about individual phenotypic lactation curves and their variability. Models can be used to transform raw data into biologically meaningful information. Over the past decades, authors have proposed mathematical models to capture the shape of the lactation curve (Wood, 1967; Cobby & Le Du, 1978; Dhanoa, 1981; Wilmink, 1987) and some wanted to have models based on a biological framework (Dijkstra et al., 1997; Friggens et al., 1999; Pollott, 2000). With more frequent data, a recent model was developed to characterize the lactation curve with an explicit representation of perturbations (Ben Abdelkrim et al., 2020). This model allows a better estimation of the lactation potential for a given animal. Having an estimation of the potential lactation curve can help to identify those goats that need improved feeding management (Arnal et al., 2018). Studies on modelling the shape of BW or BCS curves through lactation (Macé et al., 2023) are less frequent. Some mathematical functions with an exponential approach (Sauvant et al., 2012) or a random regression approach (Berry et al., 2003) have been used. In dairy cows, Ollion et al. (2016) developed a method to characterize trade-offs among biological functions. This method was based on principal component analysis (PCA) followed by agglomerative hierarchical classification (AHC) using MY curves, BCS curves and reproductive performance.
Studying the diversity of lactation curve sequences on a lifetime scale opens the perspective to look at potential changes in priorities among functions across the lifespan, and thus to see how early lifetime performance can impact the subsequent productive lifetime. Understanding the career diversity within a herd would allow the development of management strategies adapted to different curve sequence types, thereby favoring animal longevity. To our knowledge, no studies in dairy goats have used models to compare milk, body weight and body condition dynamics at a lactation scale or at a lifetime scale. In this study, we hypothesized that a multi-scale approach (lactation and lifetime scale) based on phenotypic curves would bring insights on energy partitioning strategies among biological functions. The general objective of this work was to analyze the variability of lifetime phenotypic trajectories through a 3-step approach: (1) characterize individual lactation curves, (2) explore the associations between MY, BW and BCS curves at the lactation scale and (3) assess the diversity of phenotypic curves over successive lactations.
Material and methods
Ethics approval
This paper did not require animal experimentation approval because the datasets came from routine data recorded on farm. The two farms, housed their animals in conditions that fully complied with the current regulations on animal housing (directive 98/58/CE).
Datasets
Dataset 1 (1996-2020).
Data came from the experimental farm Le Pradel (agricultural high school Olivier de Serres) located in the French department Ardeche (44° 34' 58.4364" N; 4° 29' 53.2068" E). The data set contained 2,460 lactations from 793 Alpine goats including 93,965 weekly milk records, 28,099 monthly BW records and 26,271 monthly BCS records. Over this period, goats were milked twice daily, and the recorded milk yield value was the sum of the two milkings. BW was measured once a month on a weighing balance. BCS was evaluated at lumbar and sternal regions on a 0 to 5 scale (Morand-Fehr & Hervieu, 1999). Le Pradel farm had a seasonal system with a kidding period between January and February. During the breeding season in August, inseminated goats received a hormonal treatment. Males were introduced 18 days after artificial insemination (AI). Males stayed until October to mate the goats that returned to heat after AI and those that were not inseminated. Goats produced milk from January to November-December. All lactations retained for milk records had a first record less than 30 days after kidding, a last record after 240 days in milk and had less than 30 days interval between two records. All lactations retained for BW and BCS records had a first record less than 17 days after kidding, a last record after 240 days, more than 8 records per lactation and less than 100 days interval between two records. Lactations lasted on average 289.6 ± 28.5 days. The final dataset 1 concerned 2,271 lactations for milk records, 1,935 lactations for BW records and 1,851 lactations for BCS records (Table 1).
Dataset 2 (2006-2022).
Data came from the MoSAR experimental farm (INRAE-AgroParisTech) located in the French department of Yvelines (48° 50' 31.4801" N; 1° 56' 56.5843" E). The data set contained 1,608 lactations from 339 Alpine and 310 Saanen goats including 396,814 daily milk records, 252,725 daily BW records and 11,525 monthly BCS records. The farm has a rotary parlor with an automatic weighing platform, goats were milked and weighed twice a day. The recorded value for milk was the sum of the two milkings. The recorded value for BW was an average of the two measurements. BCS was assessed as the same way as in dataset 1. The MoSAR experimental farm had a seasonal system with a kidding period between January and February. During the breeding season in August, all goats received a hormonal treatment. Selected goats were inseminated after treatment on a fixed date in August. For the goats that were naturally mated, a male was introduced in small groups of 10-12 goats over 6-7 days. Goats produced milk from January to November-December. All lactations retained for milk records in our dataset had a first record less than 5 days after kidding, a last record after 240 days in milk and had less than 30 days interval between two records. All lactations retained for BW and BCS records had a first record less than 20 days after kidding, a last record after 240 days, more than 8 records per lactation and less than 80 days interval between two records. Lactations lasted on average 280.1± 35.1 days. The final dataset 2 concerned 1,256 lactations for milk records, 1,299 lactations for BW records and 381 lactations for BCS records (Table 1).
Table 1 - Lactation selection criteria for milk yield, body weight and body condition score records with parity and breed distribution for dataset 1 and 2.
|
|
|
Milk yield |
Body weight |
Body condition score |
|||
|---|---|---|---|---|---|---|---|
|
|
|
Dataset 1 |
Dataset 2 |
Dataset 1 |
Dataset 2 |
Dataset 1 |
Dataset 2 |
|
Lactation stage |
First record |
<30 |
<5 |
<17 |
<20 |
<17 |
<20 |
|
(d) |
Last record |
>240 |
>240 |
>240 |
>240 |
>240 |
>240 |
|
Interval between records (d) |
<30 |
<30 |
<100 |
<80 |
<100 |
<80 |
|
|
Record per lactation |
|
/ |
/ |
>=8 |
>=8 |
>=8 |
>=8 |
|
Parity |
Primiparous |
671 |
520 |
606 |
499 |
549 |
143 |
|
Multiparous |
1,600 |
736 |
1,329 |
800 |
1,302 |
238 |
|
|
Breed |
Alpine |
2,271 |
716 |
1,935 |
742 |
1,851 |
191 |
|
Saanen |
0 |
540 |
0 |
557 |
0 |
190 |
|
|
Total |
2,271 |
1,256 |
1,935 |
1,299 |
1,851 |
381 |
|
Models of individual phenotypic lactation curves
Models were selected according to data frequency.
Lactation curve fitting of both daily and monthly data (dataset 1 and 2)
The perturbed lactation model proposed by Ben Abdelkrim et al. (2020) was fitted to the MY time-series data (Figure 1).
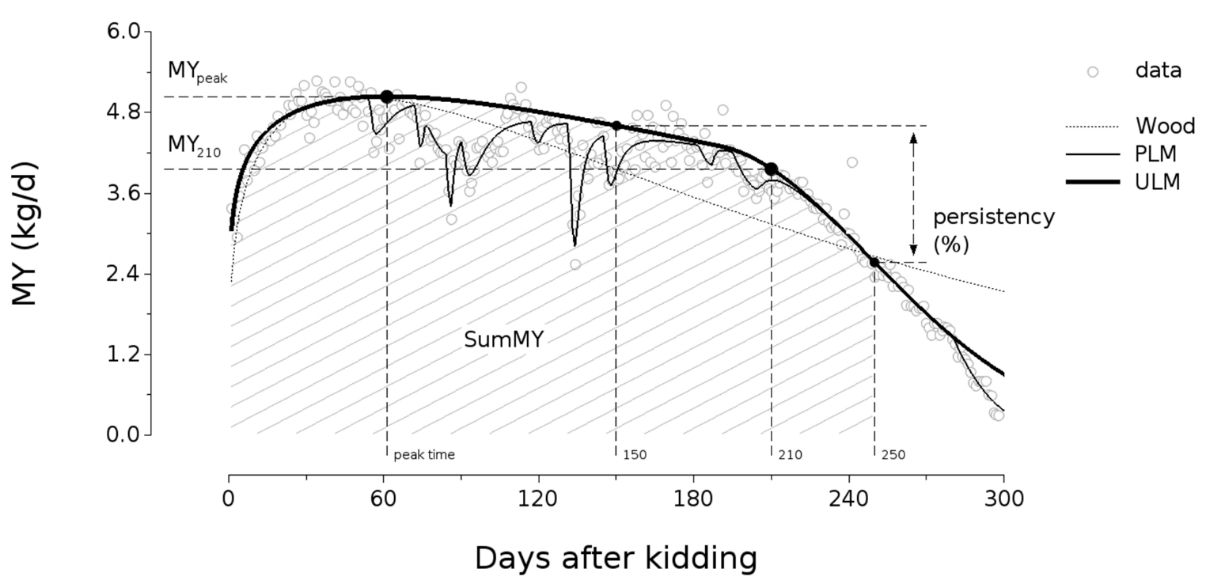
Figure 1 - Example of daily milk records fitted using the model proposed by Ben Abdelkrim et al. (2020) with empty white circles representing raw data, black bold lines representing the unperturbed lactation model (ULM), black thin lines representing the perturbed lactation model (PLM), and grey dotted lines representing the theoretical Wood model. The ULM trajectory was summarized with synthetic indicators: MYpeak = highest milk yield value; MY210 = milk yield value at 210 days; SumMY = sum of daily milk yield values over 250 days; Peak time = time of the highest milk yield value; Persistency = (MY250-MY150 )/MY150) x100.
This model was designed to decompose lactation dynamics into two components: a theoretical unperturbed lactation curve, and the perturbations in milk yield. This approach was selected to characterize lactation curves corrected for perturbations because it captures a proxy of the lactation potential. The model used for the unperturbed lactation was a modified version of the Wood model (Wood, 1967) integrating a late lactation decrease. The model was fitted in Scilab (Version 6.1.1, www.scilab.org) using an updated version (Martin, unpublished/personnal communication) of the fitting protocol described in Ben Abdelkrim et al. (2020). For further details about the model and the fitting procedure see Appendix A, section 1.
BCS curve fitting of monthly data (dataset 1 and 2)
The triphasic model proposed by Grossman et al. (1999) was fitted to monthly BCS time-series data (Figure 2). This model was designed to decompose body condition dynamics into three parts: a depletion phase, a plateau phase and a repletion phase. This model allows characterization of curves with less frequent data (at least five records were needed). The model was fitted using RStudio (version 2023.06.01). For further details about the model and the fitting procedure see Appendix A, section 3.
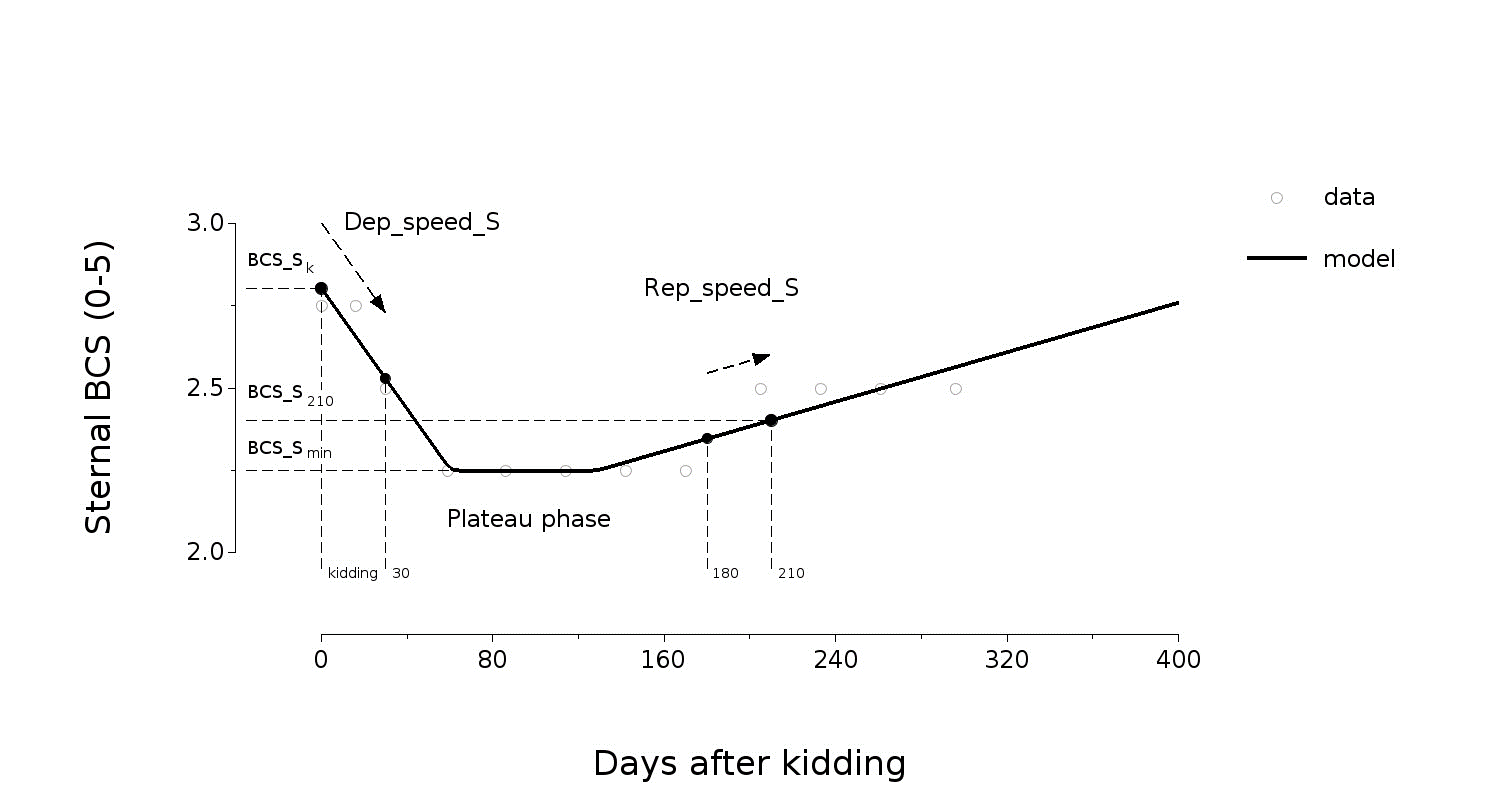
Figure 2 - Example of monthly sternal body condition records fitted using the model proposed by Grossman et al. (1999) with empty white circles representing raw data, black straight lines representing the fitted curve. This fitted curve was summarized with synthetic indicators: BCS_Sk = sternal BCS at kidding; BCS_Smin = minimum sternal BCS; BCS_S210 = sternal BCS at 210 days; Dep_speed_Sk🡪30 : sternal BCS depletion speed between kidding and 30 days = (BCS_S30 - BCS_Sk )/ 30; Rep_speed_S180🡪210: sternal BCS repletion speed between 180 and 210 days = (BCS_S210 - BCS_S180 )/ 30.
BW curve fitting of daily data
The unperturbed weight model proposed by Martin & Ben Abdelkrim, (2019) was fitted to the daily BW time-series data from dataset 2 (Figure 3). This model was designed to decompose the BW dynamics during a lactation into a sequence of depletion/repletion of BW. This model was built to be flexible and to capture various shapes of BW curves. The model was fitted using RStudio (version 2023.06.01). For further details about the model and the fitting procedure see Appendix A section 2.
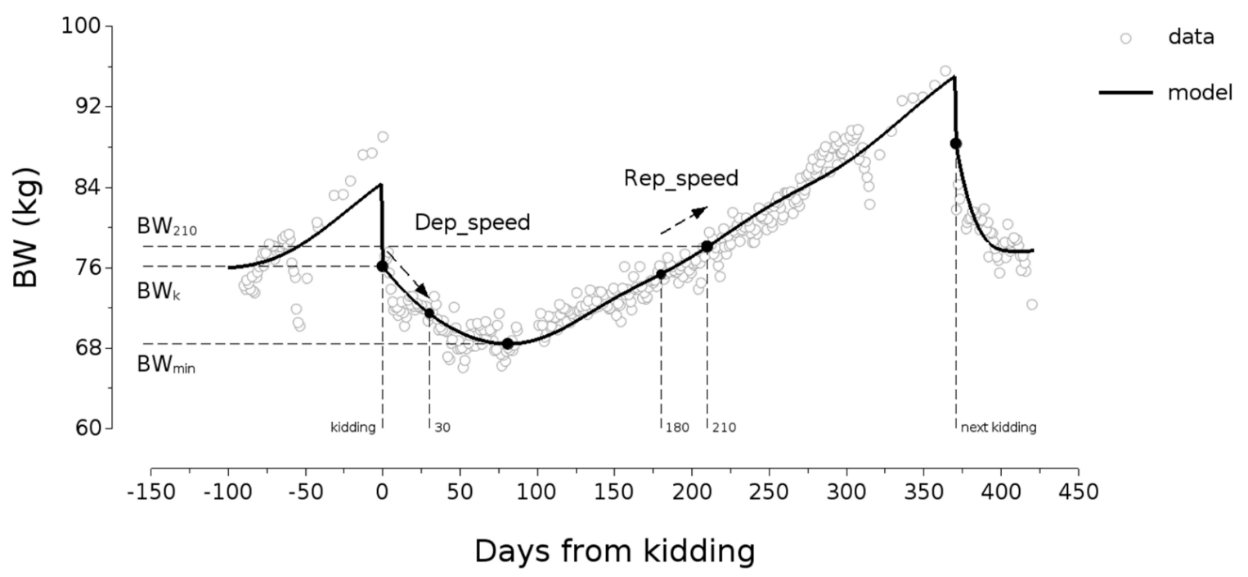
Figure 3 - Example of daily body weight records fitted using the model proposed by Martin & Ben Abdelkrim, (2019) with empty white circles representing raw data, black straight lines representing the fitted trajectory. This fitted trajectory was summarized with synthetic indicators: BWk = body weight at kidding; BWmin = minimum body weight; BW210 = body weight at 210 days; Dep_speedk🡪30 : Body weight depletion speed between kidding and 30 days = (BW30 - BWk)/ 30; Rep_speed180🡪210: Body weight repletion speed between 180 and 210 days = (BW210 – BW180)/ 30.
The same fitting procedure used for BCS was used to fit monthly BW data from dataset 1.
Fitting convergence
Non-convergence of the fitting procedure occurred in situations where the model was irrelevant to describe data. Non-convergence of the fitting procedure accounted for 0 % of lactations of the datasets for MY, 3 % of lactations of the datasets for BW and 30 % of lactations of the datasets for lumbar BCS and 22 % of lactations of the datasets for sternal BCS. Modelled curves with extreme features were removed using the Tukey’s rule (Tukey, 1977) applied to estimates of model parameters and root mean square error (RMSE) (exclusion of values above the third quartile plus three times the interquartile range). Loss associated to extreme features accounted for 3 % of lactations of the datasets for MY, 7 % of lactations of the datasets for BW and 6 % of lactations of the datasets for lumbar and sternal BCS.
Synthetic indicators to describe fitted individual phenotypic lactation curves
Finally, we used synthetic indicators derived from modelled curves to describe lactation, BW and BCS curves during lactation. Two types of indicators were used: level indicators were considered to characterize performance at specific times and dynamic indicators were considered to characterize temporal changes in performance (Table 2).
Statistical analysis
Clusters of phenotypic curves at lactation scale
All statistical analyses were performed using RStudio (version 2023.06.01). Data and scripts can be found in the repository linked to this manuscript (Gafsi et al., 2023). To characterize groups of individual phenotypic curves, principal component analysis (PCA) was performed on the synthetic indicators of MY, BW and BCS separately. The number of principal components (PC) was based on the cumulative variance. To choose the number of PCs at least 75 % of the total variance was needed. PCA was followed by an agglomerative hierarchical clustering (AHC) based on the retained number of PCs for each of MY, BW and BCS, using Ward’s linkage procedure.
Table 2 - Description of the set of synthetic indicators used to describe fitted individual phenotypic curve for milk yield (MY), body weight (BW) and body condition score (BCS).
|
Curve |
Type2 |
Indicator |
Description and calculation |
Unit |
|---|---|---|---|---|
|
Milk production |
L |
SumMY |
Total milk produced between 0 and 250 days of lactation, calculated as the sum of daily milk yield values |
kg |
|
L |
MYpeak |
Highest daily milk yield reached during lactation |
kg/d |
|
|
L |
MY210 |
Daily milk yield at 210 days of lactation |
kg/d |
|
|
D |
Peak time |
Lactation time at which the maximum milk yield value is reached |
d |
|
|
D |
Persistency |
Rate of decrease of milk production between 150 and 250 days of lactation: (MY250-MY150/MY150) x100 |
% |
|
|
Body weight |
L |
BWk |
Daily body weight at kidding |
kg |
|
L |
BWmin |
Minimum daily body weight reached during lactation |
kg |
|
|
L |
BW210 |
Daily body weight value at 210 days of lactation |
kg |
|
|
D |
Dep_speedk->30 |
Speed of body weight depletion between 0 and 30 days of lactation, calculated as (BW30 - BWk)/ 30 |
kg/d |
|
|
D |
Rep_speed180->210 |
Speed of body weight repletion between 180 and 210 days of lactation, calculated as: (BW210- BW180) / 30 |
kg/d |
|
|
Lumbar or sternal body condition score1 |
L |
BCS_Xk |
Lumbar/sternal BCS at kidding |
[0-5] scale |
|
L |
BCS_Xmin |
Minimum lumbar/sternal BCS reached during lactation |
[0-5] scale |
|
|
L |
BCS_X210 |
Lumbar/sternal BCS at 210 days of lactation |
[0-5] scale |
|
|
D |
Dep_speed_Xk->30 |
Speed of lumbar/sternal BCS depletion between 0 and 30 days of lactation, calculated as: (BCS_X30 - BCS_Xk)/ 30 |
[0-5] scale/d |
|
|
D |
Rep_speed_X180->210 |
Speed of lumbar/sternal BCS repletion between 180 and 210 days of lactation, calculated as: (BCS_X210 - BCS_X180)/ 30 |
[0-5] scale/d |
1 X stands for lumbar (L) or sternal (S).
2 L = level; D = dynamic.
Ward’s method is a hierarchical procedure that iteratively merges groups of individuals represented by points in a Euclidean space resulting in the smallest increase in the sum of within-group sums of squares. This clustering method produces groups that minimize intra-group dispersion and maximize inter-group dispersion at each binary fusion. Preliminary analysis was conducted including the farming systems, breed, and parities all together. Breed and farming systems did not play a strong role on cluster characterization. Parity played a strong role in cluster characterization for MY and BW. So, we performed a clustering by parity (primiparous vs. multiparous) for MY and BW, whereas we performed a single clustering for all parities together for BCS. The optimal number of clusters was based on the higher relative loss of inertia criteria. Differences between clusters for each synthetic indicator were assessed using a one-way ANOVA followed by a Tukey test.
At lactation scale, contingency tables between clusters of phenotypic curves
To assess the associations between MY, BW and BCS curves at the lactation scale, we produced two-way contingency tables. After clustering, each lactation was assigned a MY, BW or BCS cluster. A contingency table summarized the conditional frequencies of two clusters (e.g., MY and BW clusters). It was used to assess if a cluster membership for a given phenotypic curve was associated to a particular cluster membership for another phenotypic curve, i.e. it showed how these two clusters were dependent on each other. MY, BW and BCS records concerned different numbers of lactations, so each contingency table (e.g., MY with BW or MY with lumbar BCS) considered different sub-populations. Chi-squared tests were performed to assess for associations, between phenotypic curves. Cramer’s V test was performed on significant associations to evaluate the strength of the associations. Cramer’s V values ranged from 0 to 1. Values close to 1 indicate a strong association, whereas values close to 0 indicate a weak association.
At lifetime scale, changes in cluster composition for each parity
To assess the diversity of phenotypic lactation curves at lifetime scale, we produced bar plots of the composition of each cluster for parity n in terms of clusters in the next parity n+1. With this visual display, it is possible to characterize if goat’s assignment to a cluster is stable across parities (reflecting goats with a stable type of lactation curve across parities) or if assignment to a cluster varies across parities (reflecting goats with various dynamics during their lifetime). Chi-squared tests were performed to assess for associations between lactation curves. Cramer’s V test was performed on significant associations to evaluate the strength of the associations.
Results
Goodness-of-fit
For the two data sets, the RMSE averaged 5.0 % ± 1.9 % of the average MY per lactation, 2.7 % ± 1.0 % of the average BW per lactation, 3.6 % ± 1.6 % of the average lumbar BCS per lactation, and 3.1 % ± 1.3 % of the average sternal BCS per lactation.
Phenotypic lactation curves characterization
For all clusters of MY, BW and BCS, a detailed description of cluster names is given in table 3.
Table 3 - Detailed description of cluster names for MY, BW and BCS. The upper script letter describes the phenotype (Y: milk yield; W: body weight; LU: lumbar BCS and ST: sternal BCS). The superscript describes if the cluster is for primiparous (p) or multiparous (m) goats. The subscript describes the key feature of the cluster (letter for level and plus or minus sign for dynamics).
|
Phenotypic curve |
Cluster |
|
|---|---|---|
|
Primiparous |
Multiparous |
|
|
MY1 |
YpL+ = Low MY and high persistency. |
YmM+ = Medium MY and high persistency. |
|
YpL- = Low MY and low persistency. |
YmM- = Medium MY and low persistency. |
|
|
YpM- = Medium MY and low persistency. |
YmH = High MY and medium persistency. |
|
|
YpH = High MY and medium persistency. |
||
|
BW |
WpL- = Low BW and low depletion. |
WmL-= Low BW and low depletion. |
|
WpH+ = High BW and high depletion. |
WmH+ = High BW and high depletion. |
|
|
WpH- = High BW and low depletion. |
WmH- = High BW and low depletion. |
|
|
All parities |
||
|
Lumbar BCS |
LUM+ = Medium lumbar BCS and depletion. LUM = Medium lumbar BCS and low depletion. LUH+ = High lumbar BCS and depletion. |
|
|
Sternal BCS |
STM+ = Medium sternal BCS and depletion. STM = Medium sternal BCS and low depletion. STH+ = High sternal BCS and depletion. |
|
|
1Abbreviations: MY = milk yield; BW = body weight; BCS = body condition score |
||
Clusters of MY lactation curves
The first two PCs accounted for 83.5 % of the total variance for primiparous goats and 81.6 % for multiparous goats. The first PC captured the total amount of milk produced during the lactation and accounted for 53.1 % of the total variance for primiparous goats and 50.7 % for multiparous goats. The second PC captured the persistency and peak time of the lactation curve and accounted for 30.4% of the total variance for primiparous goats and 30.8 % for multiparous goats. Based on the highest loss of inertia, four clusters were retained for primiparous goats, and three clusters were retained for multiparous goats (Figure 4).
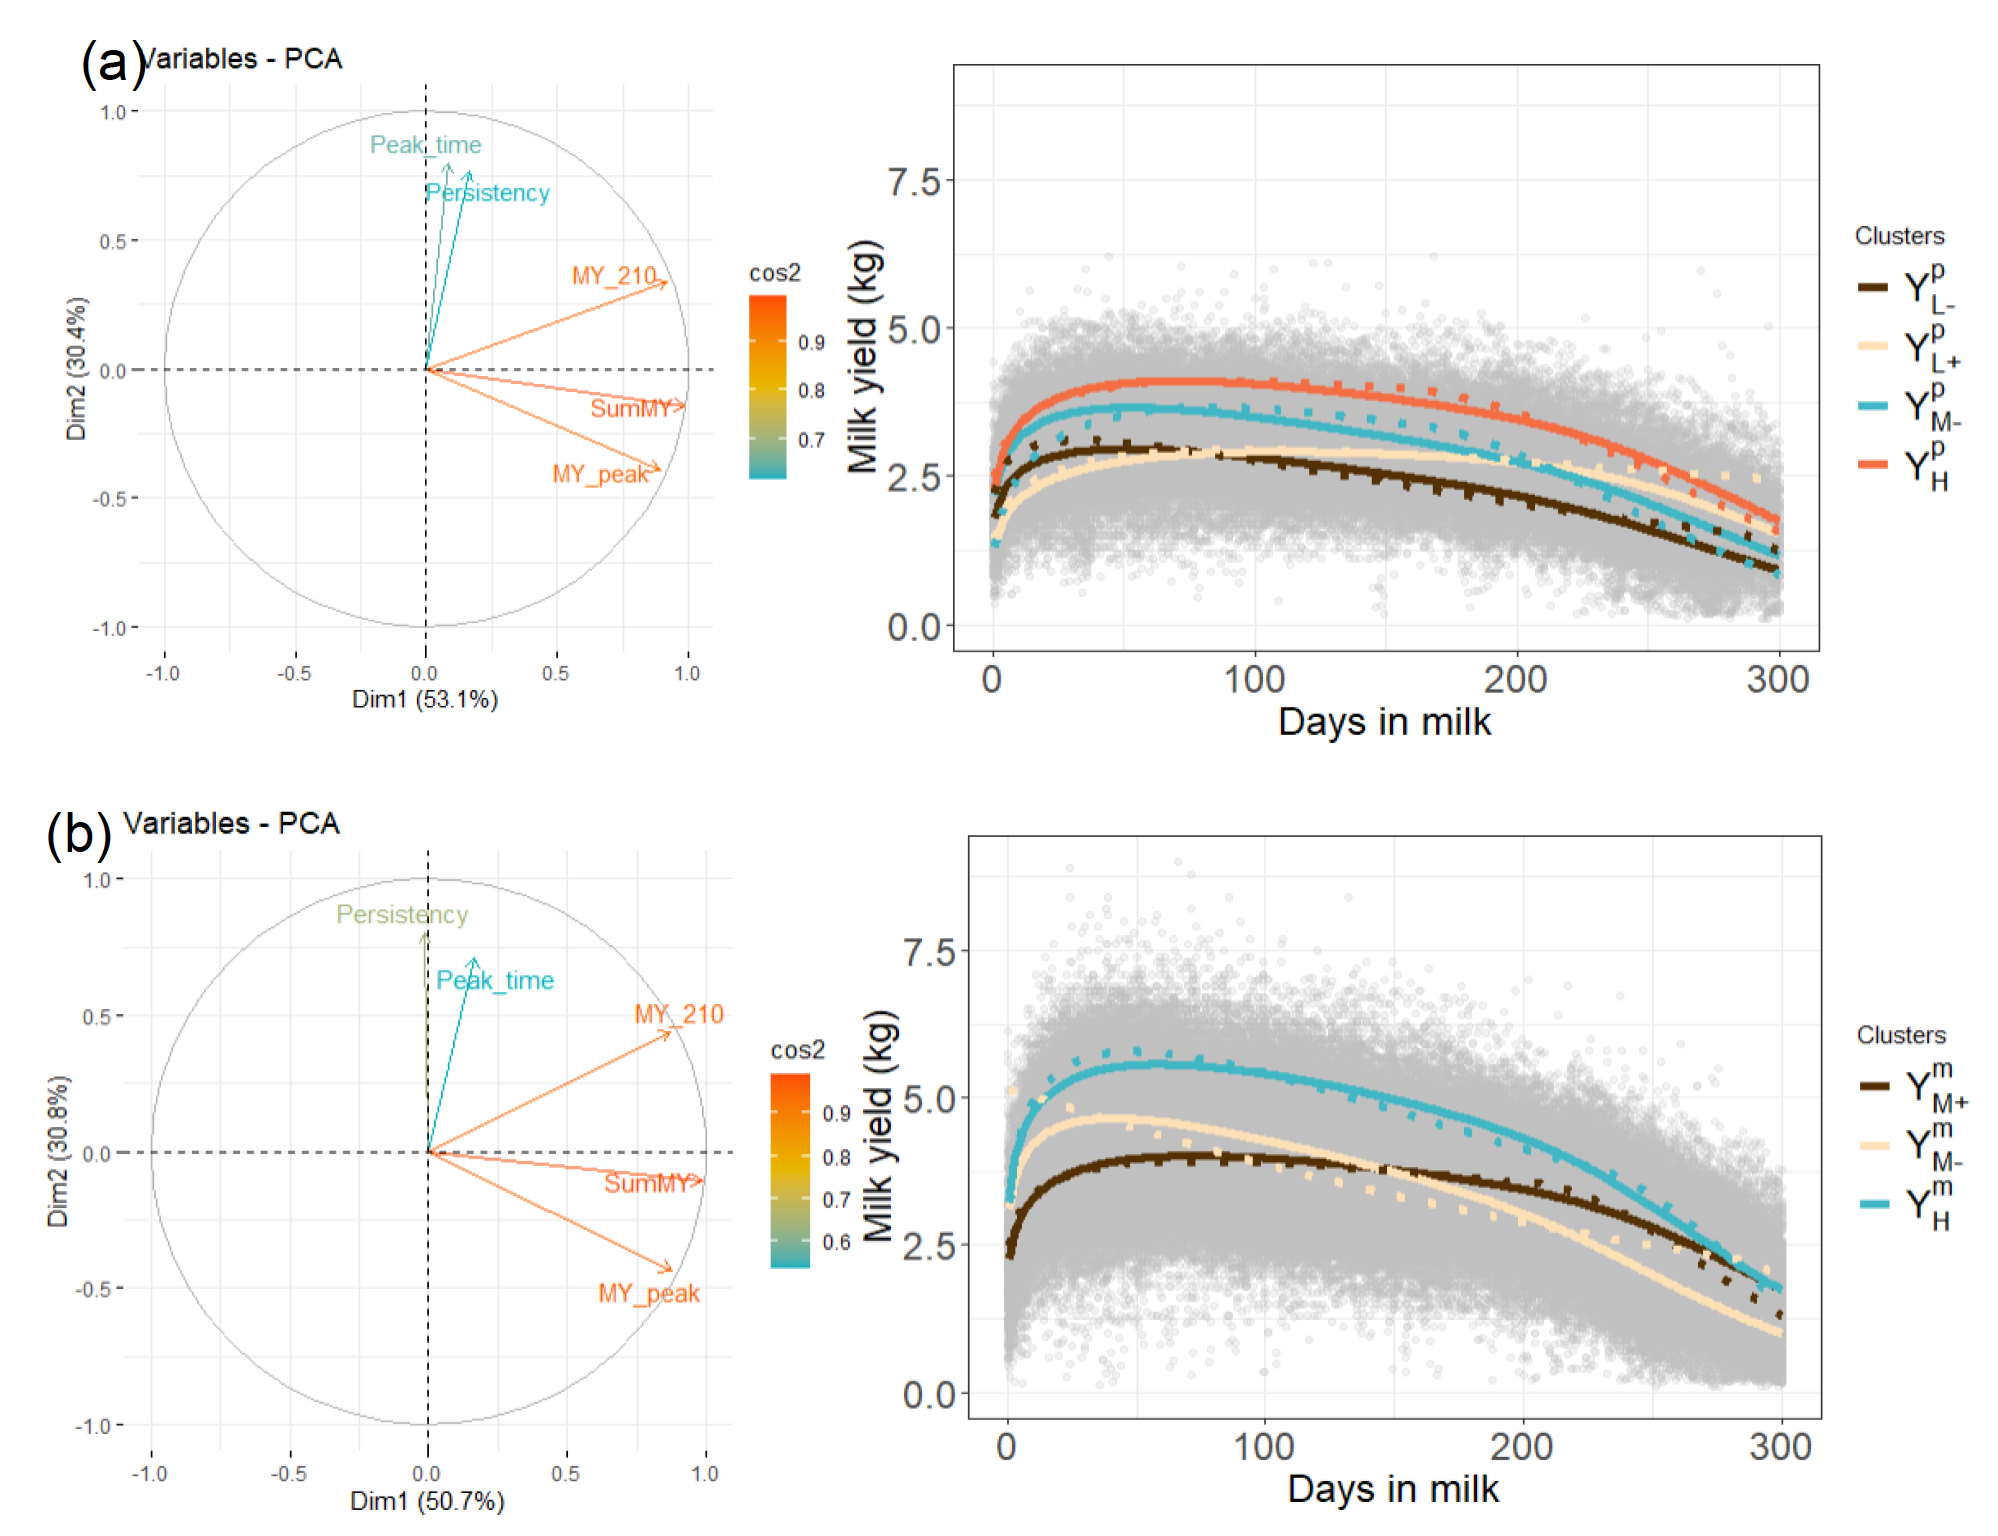
Figure 4 - PCA and clusters of milk yield synthetic indicators in primiparous (a) and multiparous (b) goats with grey circles representing raw data, lines representing the mean cluster and dotted lines representing a paragon cluster (i.e., the most representative goat in the cluster) (MYpeak = highest milk yield value; MY210 = milk yield value at 210 days; SumMY = sum of daily milk yield values over 250 days; Peak time = time of the highest milk yield value; Persistency = (MY250-MY150/MY150) x100; YpL+= Low milk yield and high persistency cluster for primiparous; YpL-= Low milk yield and low persistency cluster for primiparous; YpM- = Medium milk yield and low persistency cluster for primiparous; YpH = High milk yield and medium persistency cluster for primiparous; YmM+= Medium milk yield and high persistency cluster for multiparous; YmM- = Medium milk yield and low persistency cluster for multiparous; YmH = High milk yield and medium persistency cluster for multiparous).
Full details for each cluster are given in tables 4a and 4b.
Primiparous clusters were characterized by:
-
a group of low persistency clusters with two different total milk production levels (63.3% of the primiparous): a low-level cluster (YpL-) that produced 155.6 kg less over the lactation than a medium-level cluster (YpM-).
-
a medium persistency cluster with the highest total milk production level that gathered 22.6% of the primiparous (YpH).
-
the highest persistency cluster with a low total milk production level that gathered 14.1% of the primiparous (YpL+).
Table 4a - Statistical description of synthetic indicators for MY clusters in primiparous goats.
|
Indicator |
YpL-3 |
YpL+ |
YpM- |
YpH |
Pooled SE |
p-value2 |
|---|---|---|---|---|---|---|
|
n = 273 |
n = 163 |
n = 459 |
n = 262 |
|||
|
SumMY1 |
629.1 a |
675.5 b |
784.7 c |
925.4 d |
67.2 |
*** |
|
MYpeak |
3.0 a |
3.0 a |
3.7 b |
4.2 c |
0.4 |
*** |
|
MY210 |
2.1 a |
2.7 b |
2.6 b |
3.4c |
0.3 |
*** |
|
Peak time |
47.4 a |
106.0 b |
49.8 a |
71.4 c |
26.7 |
*** |
|
Persistency |
-36.7 a |
-19.2 b |
-35.2 a |
-27.2 c |
10.9 |
*** |
a-d Means with superscripts differ significantly by row.
1 SumMY = sum of daily milk yield values over 250 days; MYpeak = highest milk yield value; MY210 = milk yield value at 210 days; Peak time = time of the highest milk yield value; Persistency = (MY250-MY150/MY150) x100.
2 p-value resulting from Tukey's test assessing the significance of differences between profiles for each variable. NS (p<0.1), *(p<0.05); and ***(p≤0.001).
3 YpL+ = Low milk yield and high persistency cluster; YpL- = Low milk yield and low persistency cluster; YpM- = Medium milk yield and low persistency cluster; YpH = High milk yield and medium persistency cluster.
Multiparous clusters were characterized by:
-
a group of medium total milk production levels with two different persistency (65.4 % of the multiparous): a high persistency cluster (YmM+) that maintained 20.4 % more the production than a low persistency cluster (YmM-).
-
the highest total milk production level cluster with a medium persistency (YmH) that gathered 34.6 % of the population.
Table 4b - Statistical description of synthetic indicators for MY clusters in multiparous goats.
|
Indicator |
YmM+3 |
YmM- |
YmH |
Pooled SE |
p-value2 |
|---|---|---|---|---|---|
|
n = 741 |
n = 740 |
n = 783 |
|||
|
SumMY1 |
911.4 a |
940.9 b |
1,212.4 c |
111.5 |
*** |
|
MYpeak |
4.1 a |
4.7 b |
5.7 c |
0.6 |
*** |
|
MY210 |
3.4 a |
2.9 b |
4.1 c |
0.5 |
*** |
|
Peak time |
71.1 a |
38.1 b |
58.3 c |
27.4 |
*** |
|
Persistency |
-25.9 a |
-46.3 b |
-36.3 c |
12.4 |
*** |
a-c Means with superscripts differ significantly by row.
1 SumMY = sum of daily milk yield values over 250 days; MYpeak = highest milk yield value; MY210 = milk yield value at 210 days; Peak time = time of the highest milk yield value; Persistency = (MY250-MY150/MY150) x100.
2 p-value resulting from Tukey's test assessing the significance of differences between profiles for each variable. NS (p<0.1), *(p<0.05); and ***(p≤0.001).
3 YmM+ = Medium milk yield and high persistency cluster; YmM- = Medium milk yield and low persistency cluster; YmH = High milk yield and medium persistency cluster.
With respect to farm, for primiparous goats, Pradel’s Alpine goats, Grignon’s Alpine goats, and Grignon’s Saanen goats were more represented in the YpM- cluster because this is the cluster with the highest number of goats overall. For multiparous goats, Pradel’s Alpine goats were more represented in the YmH cluster, whereas Grignon’s Alpine goats were less represented in this cluster. Grignon’s Saanen goats were more represented in the YmM+ cluster. See Appendix B section 1 for more details.
Clusters of BW lactation curves
The first two PCs accounted for 77.4% of the total variance for primiparous goats and 79.4% for multiparous goats. The first PC represented the level of BW at different times of lactation and accounted for 52.8% of the total variance for primiparous goats and 56.9% for multiparous goats. The second PC represented the BW speed loss in the 30 days after kidding and accounted for 24.7% of the total variance for primiparous goats and 22.5% for multiparous goats. Three clusters were retained for each parity group due to the highest loss of inertia (Figure 5).
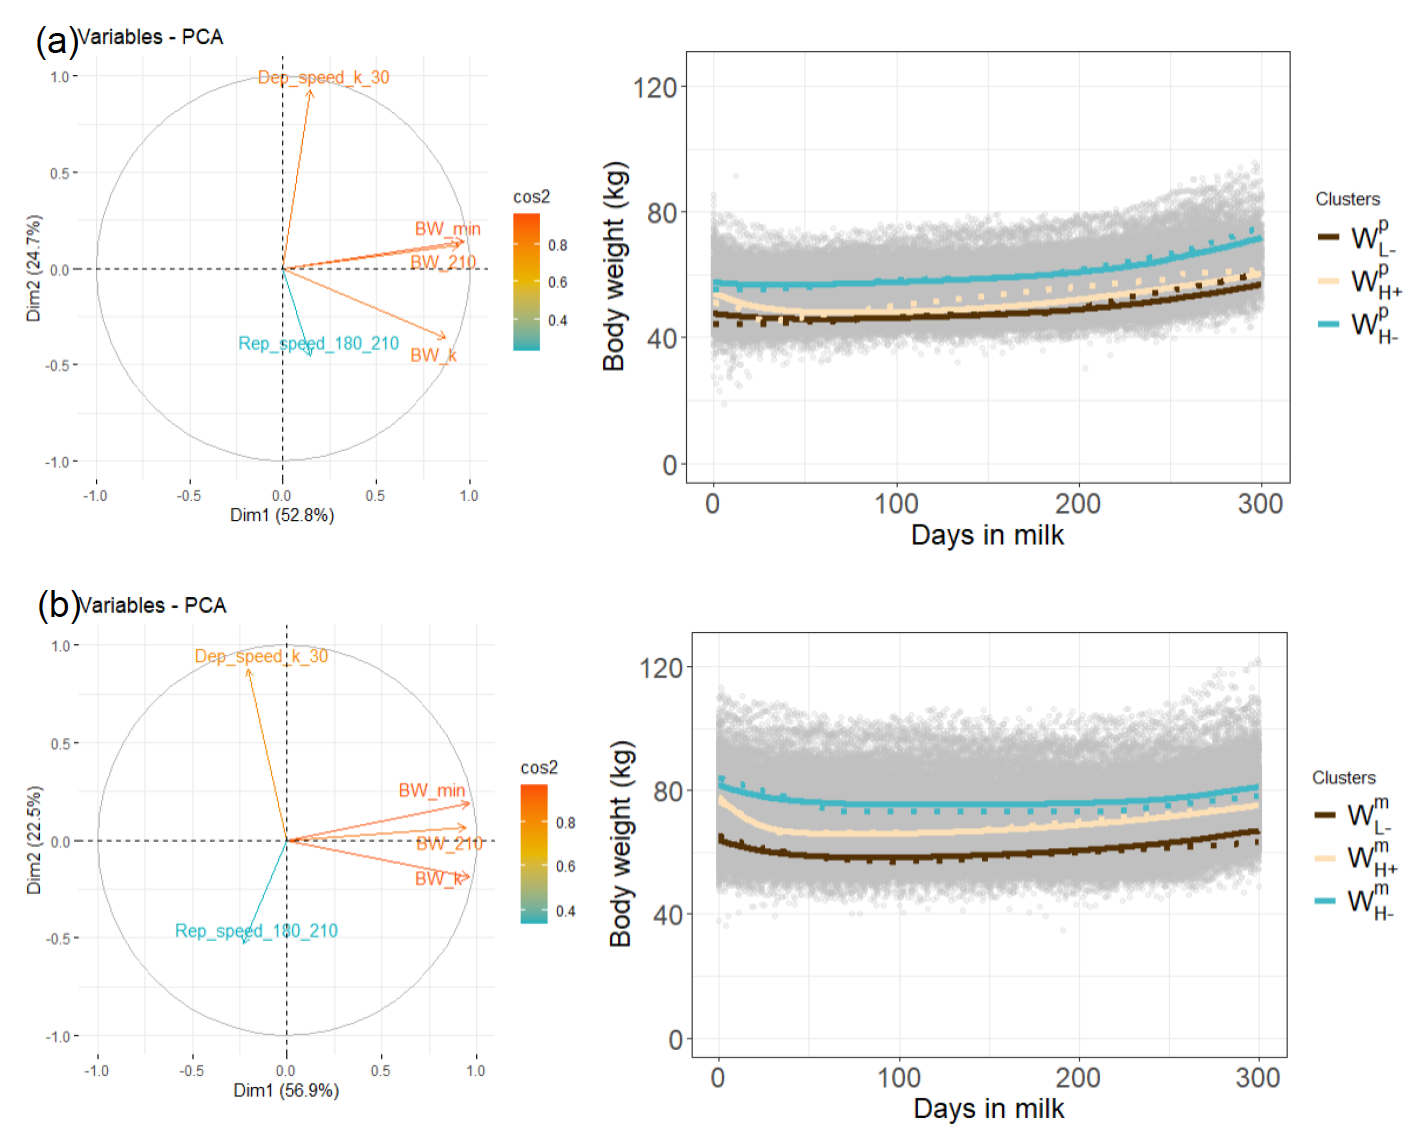
Figure 5 - PCA and clusters of body weight synthetic indicators in primiparous (a) and multiparous (b) goats with grey circles representing raw data, lines representing the mean cluster and dotted lines a paragon cluster (i.e., the most representative goat in the cluster) (BWk = body weight at kidding; BWmin = minimum body weight; BW210 = body weight at 210 days; Dep_speedk🡪30: Body weight depletion speed between kidding and 30 days = (BW30 - BWk )/ 30; Rep_speed180🡪210: Body weight repletion speed between 180 and 210 days = (BW210 – BW180 )/ 30; WpL- = Low body weight and low depletion cluster in primiparous; WpH+ = High body weight and high depletion cluster in primiparous; WpH-= High body weight and low depletion cluster in primiparous; WmL- = Low body weight and low depletion cluster in multiparous; WmH+= High body weight and high depletion cluster in multiparous; WmH-= High body weight and low depletion cluster in multiparous).
Full details for each cluster are given in tables 5a and 5b.
Primiparous clusters were characterized by:
-
a group of low depletion clusters with two different BW level at kidding (68.6% of the primiparous): a low-level cluster (WpL-) that averaged 10.0 kg less at kidding than a high-level cluster (WpH-). Those profiles had a higher BW210 than BWk.
-
the highest depletion cluster with a high BW level at kidding (WpH+) that gathered 31.4% of the population. Despite having the highest repletion speed, this cluster presented a lower BW210 than BWk due to the high level of depletion, that is not totally compensated at 210 days of lactation.
Table 5a - Statistical description of synthetic indicators for BW clusters in primiparous goats.
|
Indicator |
WpL-3 |
WpH+ |
WpH- |
Pooled SE |
p-value2 |
|---|---|---|---|---|---|
|
n = 418 |
n = 312 |
n = 264 |
|||
|
BWk1 |
47.7a |
54.3b |
57.7c |
4.0 |
*** |
|
BWmin |
45.2a |
47.6b |
55.6c |
3.5 |
*** |
|
BW210 |
49.5a |
52.9b |
61.5c |
4.3 |
*** |
|
Dep_speedk->30 |
-0.05a |
-0.17b |
-0.03c |
0.07 |
*** |
|
Rep_speed180->210 |
0.04a |
0.06 b |
0.05c |
0.03 |
*** |
a-c Means with superscripts differ significantly by row.
1 BWk = body weight at kidding; BWmin = minimum body weight; BW210 = body weight at 210 days; Dep_speedk🡪30 = (BW30 - BWk)/ 30; Rep_speed180🡪210 = (BW210 – BW180) / 30.
2 p-value resulting from Tukey's test assessing the significance of differences between profiles for each variable. NS (p<0.1), *(p<0.05); and ***(p≤0.001).
3 WpL- = Low body weight and low depletion cluster; WpH+= High body weight and high depletion cluster; WpH-= High body weight and low depletion cluster.
Multiparous clusters were characterized by:
-
a group of low depletion clusters with two different BW level at kidding (73.4 % of the multiparous): a low-level (WmL-) that averaged 17.6 kg less at kidding than a high-level cluster (WmH-). For these clusters BW210 was lower than BWk.
-
the highest depletion cluster with a high BW level at kidding (WmH+) that gathered 26.6% of the multiparous. Despite having the highest repletion speed, this profile presented a lower BW210 than BWk due to the high level of depletion, that is not totally compensated at 210 days of lactation.
Table 5b - Statistical description of synthetic indicators for BW clusters in multiparous goats.
|
Indicator |
WmL-3 |
WmH+ |
WmH- |
Pooled SE |
p-value2 |
|---|---|---|---|---|---|
|
n = 835 |
n = 513 |
n = 583 |
|||
|
BWk1 |
64.1a |
78.1 b |
81.7c |
6.2 |
*** |
|
BWmin |
57.8a |
65.5 b |
74.2 c |
5.2 |
*** |
|
BW210 |
61.1 a |
69.4 b |
76.2 c |
5.4 |
*** |
|
Dep_speedk->30 |
-0.14 a |
-0.35 b |
-0.14 a |
0.12 |
*** |
|
Rep_speed180->210 |
0.04 a |
0.04 b |
0.01 c |
0.03 |
*** |
a-c Means with superscripts differ significantly by row.
1 BWk = body weight at kidding; BWmin = minimum body weight; BW210 = body weight at 210 days; Dep_speedk🡪30 = (BW30 - BWk)/ 30; Rep_speed180🡪210 = (BW210 – BW180) / 30.
2 p-value resulting from Tukey's test assessing the significance of differences between profiles for each variable. NS (p<0.1), *(p<0.05); and ***(p≤0.001).
3 WmL- = Low body weight and low depletion cluster; WmH+= High body weight and high depletion cluster; WmH-= High body weight and low depletion cluster.
For primiparous goats, Pradel’s Alpine goats were more represented in the WpL- and WpH+ clusters. Grignon’s Alpine goats were more represented in the WpL- cluster. Grignon’s Saanen goats were more represented in the WpH- cluster. For multiparous goats, Pradel’s Alpine goats and Grignon’s Alpine goats were more represented in the WmL- cluster. Grignon’s Saanen goats were more represented in the WmH- cluster. See Appendix B section 2 for more details.
Clusters of BCS lactation curves
For lumbar and sternal BCS, clusters were built all parities together. For lumbar BCS, the first two PCs accounted for 75.8% of the total variance. The first PC represented levels of lumbar score at different times of the lactation (BCS_Lmin and BCS_Lk) and accounted for 46.9% of the total variance. The second PC represented the lumbar BCS speed loss in the 30 days after kidding and accounted for 28.9% of the total variance. Three clusters were retained due to the highest loss of inertia. For sternal BCS, the first two PCs represented 78.6% of the total variance. The first PC represented levels of sternal score at different times of the lactation (BCS_Smin and BCS_S210) and accounted for 50.7% of the total variance. The second PC represented the sternal BCS speed loss in the 30 days after kidding and accounted for 27.9% of the total variance. Three clusters were retained due to the highest loss of inertia (Figure 6).

Figure 6 - PCA and clusters of lumbar (a) and sternal (b) body condition score synthetic indicators with grey circles representing raw data, lines representing the mean cluster and dotted lines a paragon cluster (i.e., the most representative goat in the cluster) (BCS_Lk = lumbar BCS at kidding; BCS_Lmin = minimum lumbar BCS; BCS_L210 = lumbar BCS at 210 days; Dep_speed_Lk🡪30: lumbar BCS depletion speed between kidding and 30 days = (BCS_L30 - BCS_Lk)/ 30; Rep_speed_L180🡪210: lumbar BCS repletion speed between 180 and 210 days = (BCS_L210 - BCS_L180)/ 30;BCS_Sk = sternal BCS at kidding; BCS_Smin = minimum sternal BCS; BCS_S210 = sternal BCS at 210 days; Dep_speed_Sk🡪30: sternal BCS depletion speed between kidding and 30 days = (BCS_S30 - BCS_Sk) / 30; Rep_speed_S180🡪210: sternal BCS repletion speed between 180 and 210 days = (BCS_S210 - BCS_S180) / 30; LUM+ = Medium lumbar body condition score and depletion cluster; LUM = Medium lumbar body condition score and low depletion cluster; LUH+ = High lumbar body condition score and depletion cluster; STM+ = Medium sternal body condition score and depletion cluster; STM = Medium sternal body condition score and low depletion cluster; STH+ =High sternal body condition score and depletion cluster).
Full details for each cluster are given in tables 6 and 7.
Lumbar BCS clusters were characterized by:
-
a group of depletion clusters with two different lumbar BCS level at kidding (68.7 % of the population): a medium level cluster (LUM+) that averaged 0.4 points less at kidding than a high-level cluster (LUH+). LUM+ profile presented the highest repletion speed and the lowest minimum lumbar BCS value.
-
the lowest depletion cluster with a medium lumbar BCS level at kidding that gathered 31.3% of the population (LUM). LUM cluster presented the same repletion speed than LUH+.
Table 6 - Statistical description of synthetic indicators for lumbar BCS clusters in goats.
|
Indicator |
LUM+3 |
LUM |
LUH+ |
Pooled SE |
p-value2 |
|---|---|---|---|---|---|
|
n = 437 |
n = 459 |
n= 572 |
|||
|
BCS_Lk1 |
2.5 a |
2.4 b |
2.9 c |
0.2 |
*** |
|
BCS_Lmin |
2.1 a |
2.3 b |
2.6 c |
0.2 |
*** |
|
BCS_L210 |
2.3 a |
2.5b |
2.7 c |
0.2 |
*** |
|
Dep_speed_Lk->30 |
-0.009 a |
0.002 b |
-0.006 c |
0.005 |
*** |
|
Rep_speed_L180->210 |
0.002 a |
0.001 b |
0.001 b |
0.001 |
*** |
a-c Means with superscripts differ significantly by row.
1 BCS_Lk = lumbar BCS at kidding; BCS_Lmin = minimum lumbar BCS; BCS_L210 = lumbar BCS at 210 days; Dep_speed_Lk🡪30 = (BCS_L30 - BCS_Lk)/ 30; Rep_speed_L180🡪210 = (BCS_L210 - BCS_L180)/ 30.
2 p-value resulting from Tukey's test assessing the significance of differences between profiles for each variable. NS (p<0.1), *(p<0.05); and ***(p≤0.001).
3 LUM+ = Medium lumbar body condition score and depletion cluster; LUM = Medium lumbar body condition score and low depletion cluster; LUH+ = High lumbar body condition score and depletion cluster
Sternal BCS profiles were characterized by:
-
a group of depletion clusters with two different sternal BCS level at kidding (56.5 % of the population): a medium-level cluster (STM+) that averaged 0.7 points less at kidding than a high-level cluster (STH+). STM+ cluster presented the lowest minimum sternal BCS. These clusters presented the highest and the same repletion speed.
-
the lowest depletion cluster with a medium sternal BCS level at kidding that gathered 43.5 % of the population (STM). STM cluster presented the lowest repletion speed.
Table 7 - Statistical description synthetic indicators for sternal BCS clusters in goats.
|
Indicator |
STM+3 |
STM |
STH+ |
Pooled SE |
p-value2 |
|---|---|---|---|---|---|
|
n = 489 |
n = 708 |
n = 433 |
|||
|
BCS_Sk1 |
3.0a |
3.1 b |
3.7 c |
0.2 |
*** |
|
BCS_Smin |
2.5 a |
2.9 b |
3.2 c |
0.2 |
*** |
|
BCS_S210 |
2.6 a |
3.0 b |
3.4 c |
0.2 |
*** |
|
Dep_speed_Sk->30 |
-0.010 a |
-0.003 b |
-0.010 a |
0.006 |
*** |
|
Rep_speed_S180->210 |
0.0020 a |
0.0004 b |
0.0020 a |
0.001 |
*** |
a-c Means with superscripts differ significantly by row.
1 BCS_Sk = sternal BCS at kidding; BCS_Smin = minimum sternal BCS; BCS_S210 = sternal BCS at 210 days; Dep_speed_Sk🡪30 = (BCS_S30 - BCS_Sk)/ 30; Rep_speed_S180🡪210 = (BCS_S210 - BCS_S180)/ 30.
2 p-value resulting from Tukey's test assessing the significance of differences between profiles for each variable. NS (p<0.1), *(p<0.05); and ***(p≤0.001).
3 STM+ =Medium sternal body condition score and depletion cluster; STM =Medium sternal body condition score and low depletion cluster; STH+ =High sternal body condition score and depletion cluster.
For lumbar BCS, Pradel’s Alpine goats were more represented in the LUH+ cluster, whereas Grignon’s Alpine goats were more represented in the LUM cluster. Grignon’s Saanen goats were more represented in the LUM cluster. Primiparous represented between 30 % and 38 % of the population in each profile for lumbar BCS. For sternal BCS, Pradel’s Alpine goats were more represented in the STM cluster, whereas Grignon’s Alpine goats were more represented in the STH+ cluster. Grignon’s Saanen goats were more represented in the STH+ cluster. Primiparous represented between 30 % and 35 % of the population in each profile for sternal BCS. See Appendix B section 3 for more details.
Diversity of phenotypic curves at lactation scale
Associations between MY curves and BW curves
In this section, the association between MY and BW is presented. For primiparous goats, the association between MY and BW clusters is shown in Table 8a. The Chi² test was significant (P<0.001) with a Cramer’s V of 0.17. The association YpM- with WpL- accounted for the highest proportion of goats with 17.8 % of the population, followed by the associations YpL- with WpL- and YpM- with WpH+ with 13.9 % of the population. The association YpL+ with WpH+ accounted for the lowest proportion of goats with 2.8 % of the population. The remaining 51.6% of the population was almost equally distributed among the clusters.
Table 8a - Contingency table displaying the frequency of individual primiparous lactations affected to MY and BW clusters (see section 2 for clustering methodology).
|
Body weight profile |
Total |
||||||||||
|---|---|---|---|---|---|---|---|---|---|---|---|
|
WpL-2 |
WpH+ |
WpH- |
|||||||||
|
Milk yield profile |
n |
%1 |
n |
% |
n |
% |
n |
% |
|||
|
YpL-2 |
124 |
13.9 |
45 |
5.0 |
43 |
4.8 |
212 |
23.7 |
|||
|
YpL+ |
44 |
4.9 |
25 |
2.8 |
44 |
4.9 |
113 |
12.7 |
|||
|
YpM- |
159 |
17.8 |
124 |
13.9 |
77 |
8.6 |
360 |
40.3 |
|||
|
YpH |
60 |
6.7 |
86 |
9.6 |
62 |
6.9 |
208 |
23.3 |
|||
|
Total |
387 |
43.3 |
280 |
31.4 |
226 |
25.3 |
893 |
100.0 |
|||
1 % = proportion of lactations among the 893 primiparous goats.
2 YpL+= Low milk yield and high persistency cluster; YpL-= Low milk yield and low persistency cluster; YpM- = Medium milk yield and low persistency cluster; YpH = High milk yield and medium persistency cluster; WpL- = Low body weight and low depletion cluster; WpH+= High body weight and high depletion cluster; WpH-= High body weight and low depletion cluster.
For multiparous goats, the association between MY and BW clusters is shown in Table 8b. The Chi² test was significant (P<0.001) with a Cramer’s V of 0.17. The association YmM+ with WmL- accounted for the highest proportion of goats with 18.6% of the population. The association YmM+ with WmH+ accounted for the lowest proportion of goats with 5.6 % of the population. The remaining 75.8 % of the population was almost equally distributed among the clusters.
Table 8b - Contingency table displaying the frequency of individual multiparous lactations affected to MY and BW clusters (see section 2 for clustering methodology).
|
|
|
Body weight profile |
Total |
||||||||
|---|---|---|---|---|---|---|---|---|---|---|---|
|
WmL-2 |
WmH+ |
WmH- |
|||||||||
|
Milk yield profile |
n |
%1 |
n |
% |
n |
% |
n |
% |
|||
|
YmM+2 |
313 |
18.6 |
95 |
5.6 |
145 |
8.6 |
553 |
32.8 |
|||
|
YmM- |
242 |
14.4 |
166 |
9.9 |
140 |
8.3 |
548 |
32.5 |
|||
|
YmH |
169 |
10.0 |
200 |
11.9 |
215 |
12.8 |
584 |
34.7 |
|||
|
Total |
724 |
43.0 |
|
461 |
27.4 |
|
500 |
29.7 |
|
1,685 |
100.0 |
1 % = proportion of lactations among the 1,685 multiparous goats.
2 YmM+= Medium milk yield and high persistency cluster; YmM- = Medium milk yield and a low persistency cluster; YmH = High milk yield and a medium persistency cluster; WmL- = Low body weight and low depletion cluster; WmH+= High body weight and high depletion profile cluster; WmH-= High body weight and low depletion cluster.
The conclusions were the same for the associations between MY and lumbar BCS curves and for the associations between MY and sternal BCS curves see Appendix C section 1 and 2.
Associations between BW and sternal BCS curves
In this section, the association between BW and sternal BCS is presented. For primiparous goats, the association between BW and sternal BCS clusters is shown in Table 9a. The Chi² test was significant (P<0.001) with a Cramer’s V of 0.25. The association WpL- with STM+ and WpH+ with STM accounted for the highest proportion of goats with 18.8 % of the population, followed by the association WpL- with STM with 17.9 % of the population. The association WpH- with STM+ accounted for the lowest proportion of goats with 1.6 % of the population. The remaining 42.9 % of the population was almost equally distributed among the clusters.
Table 9a - Contingency table displaying the frequency of individual primiparous lactations affected to BW and sternal BCS clusters (see section 2 for clustering methodology).
|
|
Sternal BCS profile |
Total |
|||||||||
|---|---|---|---|---|---|---|---|---|---|---|---|
|
STM+2 |
STM |
STH+ |
|||||||||
|
Body weight profile |
n |
%1 |
n |
% |
n |
% |
n |
% |
|||
|
WpL-2 |
84 |
18.8 |
80 |
17.9 |
24 |
5.4 |
188 |
42.0 |
|||
|
WpH+ |
75 |
16.7 |
84 |
18.8 |
29 |
6.5 |
188 |
42.0 |
|||
|
WpH- |
7 |
1.6 |
29 |
6.5 |
36 |
8.0 |
72 |
16.0 |
|||
|
Total |
166 |
37.1 |
|
193 |
43.1 |
|
89 |
19.9 |
|
448 |
100.0 |
1 % = proportion of lactations among the 448 primiparous goats.
2 WpL- = Low body weight and low depletion cluster; WpH+= High body weight and high depletion cluster; WpH-= High body weight and low depletion cluster; STM+ =Medium sternal body condition score and depletion cluster; STM =Medium sternal body condition score and low depletion cluster; STH+ =High sternal body condition score and depletion cluster.
For multiparous goats, the association between BW and sternal BCS clusters is shown in Table 9b. The Chi² test was significant (P<0.001) with a Cramer’s V of 0.18. The association WmL- with STM accounted for the highest proportion of goats with 18.6 % of the population, followed by the association WmL- with STM+ with 14.2 % of the population. The association WmH- with STM+ accounted for the lowest proportion of goats with 2.8 % of the population. The remaining 64.4 % of the population was almost equally distributed among the clusters.
Table 9b - Contingency table displaying the frequency of individual multiparous lactations affected to BW and BCS sternal clusters (see section 2 for clustering methodology).
|
|
Sternal BCS profile |
Total |
|||||||||
|---|---|---|---|---|---|---|---|---|---|---|---|
|
STM+2 |
STM |
STH+ |
|||||||||
|
Body weight profile |
n |
%1 |
n |
% |
n |
% |
n |
% |
|||
|
WmL-2 |
139 |
14.2 |
182 |
18.6 |
74 |
7.6 |
395 |
40.5 |
|||
|
WmH+ |
120 |
12.3 |
132 |
13.5 |
93 |
9.5 |
345 |
35.3 |
|||
|
WmH- |
27 |
2.8 |
115 |
11.8 |
94 |
9.6 |
236 |
24.2 |
|||
|
Total |
286 |
29.3 |
|
429 |
44.0 |
|
261 |
26.7 |
|
976 |
100.0 |
1 % = proportion of lactations among the 976 multiparous goats.
2 WmL- = Low body weight and low depletion cluster; WmH+= High body weight and high depletion cluster; WmH-= High body weight and low depletion cluster; STM+ =Medium sternal body condition score and depletion cluster; STM =Medium sternal body condition score and low depletion cluster; STH+ =High sternal body condition score and depletion cluster.
The conclusions were the same for the associations between BW and lumbar BCS curves see Appendix C section 3.
Association between lumbar and sternal BCS curves
For primiparous goats, the association between lumbar and sternal BCS clusters is shown in Table 10a. The Chi² test was significant (P<0.001) with a Cramer’s V of 0.27. The association LUM+ with STM+ accounted for the highest proportion of goats with 21.4 % of the population, followed by the association LUH+ with STM with 19.5 % of the goats. The association LUM with STM+ accounted for the lowest proportion of goats with 6.7 % of the population. The remaining 52.4 % of the population was almost equally distributed among the clusters.
Table 10a - Contingency table displaying the frequency of individual primiparous lactations affected to BCS lumbar and BCS sternal clusters (see section 2 for clustering methodology).
|
|
Sternal BCS profile |
Total |
|||||||||
|---|---|---|---|---|---|---|---|---|---|---|---|
|
STM+2 |
STM |
STH+ |
|||||||||
|
Lumbar BCS profile |
n |
%1 |
n |
% |
n |
% |
n |
% |
|||
|
LUM+2 |
80 |
21.4 |
31 |
8.3 |
28 |
7.5 |
139 |
37.2 |
|||
|
LUM |
25 |
6.7 |
51 |
13.6 |
30 |
8.0 |
106 |
28.3 |
|||
|
LUH+ |
27 |
7.2 |
73 |
19.5 |
29 |
7.8 |
129 |
34.5 |
|||
|
Total |
132 |
35.3 |
|
155 |
41.4 |
|
87 |
23.3 |
|
374 |
100.0 |
1 % = proportion of lactations among the 374 primiparous goats.
2 LUM+ = Medium lumbar body condition score and depletion cluster; LUM = Medium lumbar body condition score and low depletion cluster; LUH+ =High lumbar body condition score and depletion cluster; STM+ =Medium sternal body condition score and depletion cluster; STM = Medium sternal body condition score and low depletion cluster; STH+ =High sternal body condition score and depletion cluster.
For multiparous goats, the association between lumbar and sternal BCS clusters is shown in Table 10b. The Chi² test was significant (P<0.001) with a Cramer’s V of 0.35. The association LUM+ with STM+ accounted for the highest proportion of goats with 20.0 % of the population, followed by the association LUH+ with STM with 18.6 % of the goats. The association LUM+ with STH+ accounted for the lowest proportion of goats with 4.1 % of the population. The remaining 57.3 % of the population was almost equally distributed among the clusters.
Table 10b - Contingency table displaying the frequency of individual multiparous lactations affected to lumbar and sternal BCS clusters (see section 2 for clustering methodology).
|
|
Sternal BCS profile |
Total |
|||||||||
|---|---|---|---|---|---|---|---|---|---|---|---|
|
STM+2 |
STM |
STH+ |
|||||||||
|
Lumbar BCS profile |
n |
%1 |
n |
% |
n |
% |
n |
% |
|||
|
LUM+2 |
148 |
20.0 |
52 |
7.0 |
30 |
4.1 |
230 |
31.1 |
|||
|
LUM |
59 |
8.0 |
108 |
14.6 |
45 |
6.1 |
212 |
28.6 |
|||
|
LUH+ |
36 |
4.9 |
138 |
18.6 |
124 |
16.8 |
298 |
40.3 |
|||
|
Total |
243 |
32.8 |
|
298 |
40.3 |
|
199 |
26.9 |
|
740 |
100.0 |
1 % = proportion of lactations among the 740 multiparous goats.
2 LUM+ = Medium lumbar body condition score and depletion cluster; LUM = Medium lumbar body condition score and low depletion cluster; LUH+ =High lumbar body condition score and depletion cluster; STM+ =Medium sternal body condition score and depletion cluster; STM = Medium sternal body condition score and low depletion cluster; STH+ =High sternal body condition score and depletion cluster.
Diversity of phenotypic lactation curves at lifetime scale
MY lactation curves throughout parities
Individual lactation transition in MY curves between successive lactations is shown in Figure 7. Between parity 1 to 4, the Chi² test was significant (P<0.001) with a Cramer’s V ranging from 0.27 to 0.32. For primiparous goats, almost half of the goats in the YpH cluster remained the most productive ones in parity 2 (YmH), while the other half switched to other clusters. More than half of the goats in the two lowest productive clusters (YpL- and YpL+ ) switched to the YmM+ cluster. Goats in the YpM+ cluster were almost equally distributed among the clusters in parity 2. For multiparous goats, more than two third of the goats in the YmH cluster remained in this cluster in successive lactations. The proportion of goats that remained in the YmM- cluster in successive lactations increased with parity. Goats in the YmM+ cluster were almost equally distributed among the clusters in successive lactations.
BW lactation curves throughout parities
Individual lactation transition in BW curves between successive lactations is shown in Figure 8. Between parity 1 and 4, the Chi² test was significant (P<0.001) with a Cramer’s V ranging from 0.41 to 0.44. For primiparous, goats in the WpH- cluster switched clusters in parity 2. More than 80% of the goats in the WpH+ and in the WpL- clusters switched to the WmL-cluster in parity 2. For multiparous, more than two third of the goats in the WmH- cluster remained in this cluster in successive lactations. Half of the goats in the WmH+ cluster remained in this cluster, while the other half switched clusters in successive lactations. Half of the goats in the WmL- cluster remained in this cluster, while the other half switched clusters in successive lactations.
BCS lactation curves throughout parities
Only sternal BCS is presented here. Individual lactation transition in sternal BCS curves between successive lactations is shown in Figure 9. Between parity 1 and 4, Chi² test was significant (P<0.001) with a Cramer’s V ranging from 0.35 to 0.49. For primiparous, more than half of the goats in the three clusters remained in their cluster in parity 2, while the other part switched to other clusters. For multiparous, more than three quarters of the goats in the STH+ profile remained in this cluster in successive lactations, while the other part switched to other clusters. More than half of the goats in the STM+ and STM profile remained in their cluster in successive lactations, while the other part switched to other clusters.
Discussion
Our dataset is relatively large and the frequency of measurement of the different variables is high. However, it reflected only the management of two farms. The observations made here are a starting point for a better understanding of the relationships between milk production, body condition score and body weight in goats, but will need to be confirmed in various systems. In addition, it will be necessary to add reproductive performance, which is also considered when making decisions about culling.
The first objective of this work was to characterize the diversity of phenotypic curves of performance (MY, BW, BCS) at the lactation scale.
MY curves
For MY curves we found four clusters for primiparous goats and three clusters for multiparous goats. Parity had a strong effect on the scale of the lactation curve. Over the lactation, primiparous had lower total milk yield than multiparous goats (Gipson & Grossman, 1990). Parity also affected the shape of the lactation curve. For all parities, some clusters presented the same shape characterized by a low persistency with different milk production levels (YpL-, YpM-, YmM-). These clusters, in terms of shape, were close to the mean curve of cluster 2, which represented the most common shape of lactation observed by Arnal et al. (2018) over the French dairy goat population. This cluster 2 represented 39 % of the French dairy goat population, characterized by a marked peak and a medium persistency, i.e. a low persistency for our study because Arnal et al. had an additional atypical cluster with a very low persistency. For primiparous goats, one cluster combined a low level of milk with the highest persistency over the whole population (YpL+). This is consistent with observations made by Gipson & Grossman, (1990),where persistency was the highest in primiparous goats and decreased when parity increased.
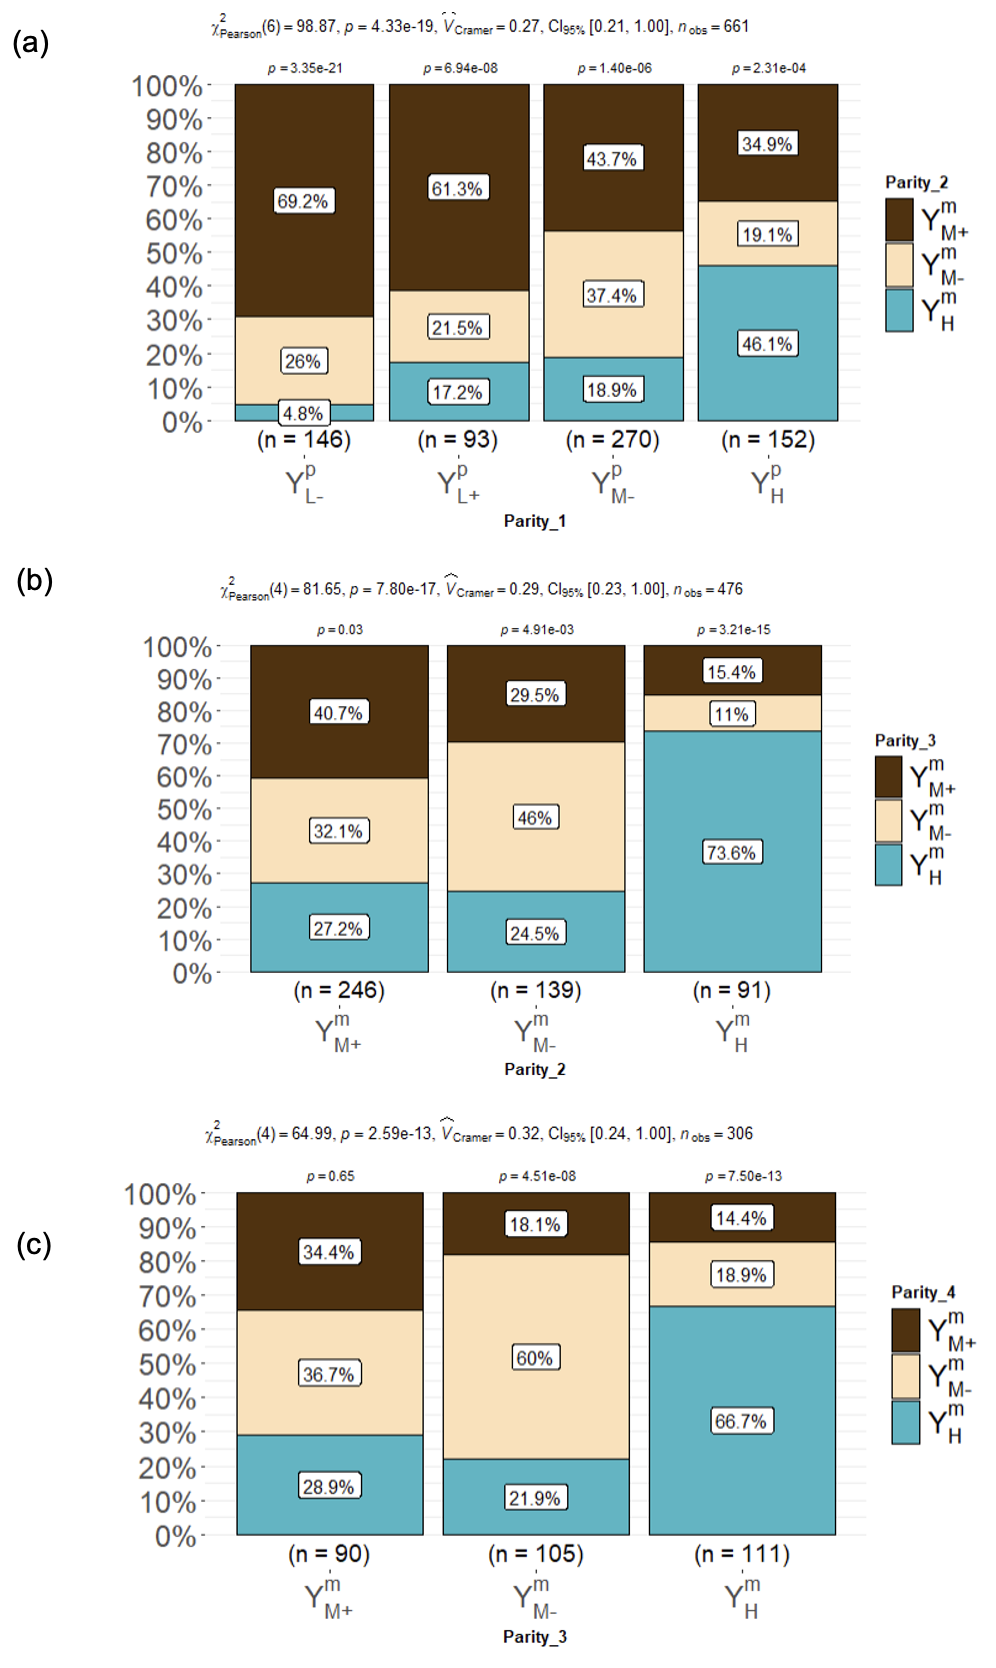
Figure 7 - Barplots displaying the frequency of goats affected to a MY cluster between (a) parity 1 and 2, (b) parity 2 and 3 , (c) parity 3 and 4 (YpL+= Low milk yield and high persistency cluster for primiparous; YpL-= Low milk yield and low persistency cluster for primiparous; YpM- = Medium milk yield and low persistency cluster for primiparous; YpH = High milk yield and medium persistency cluster for primiparous; YmM+ = Medium milk yield and high persistency cluster for multiparous; YmM- = Medium milk yield and low persistency cluster for multiparous; YmH = High milk yield and medium persistency cluster for multiparous).

Figure 8 - Barplots displaying the frequency of goats affected to a BW cluster between (a) parity 1 and 2, (b) parity 2 and 3 , (c) parity 3 and 4 (WpL- = Low body weight and low depletion cluster; WpH+= High body weight and high depletion cluster; WpH- = High body weight and low depletion cluster; WmL- = Low body weight and low depletion cluster; WmH+ = High body weight and high depletion cluster; WmH-= High body weight and low depletion cluster).
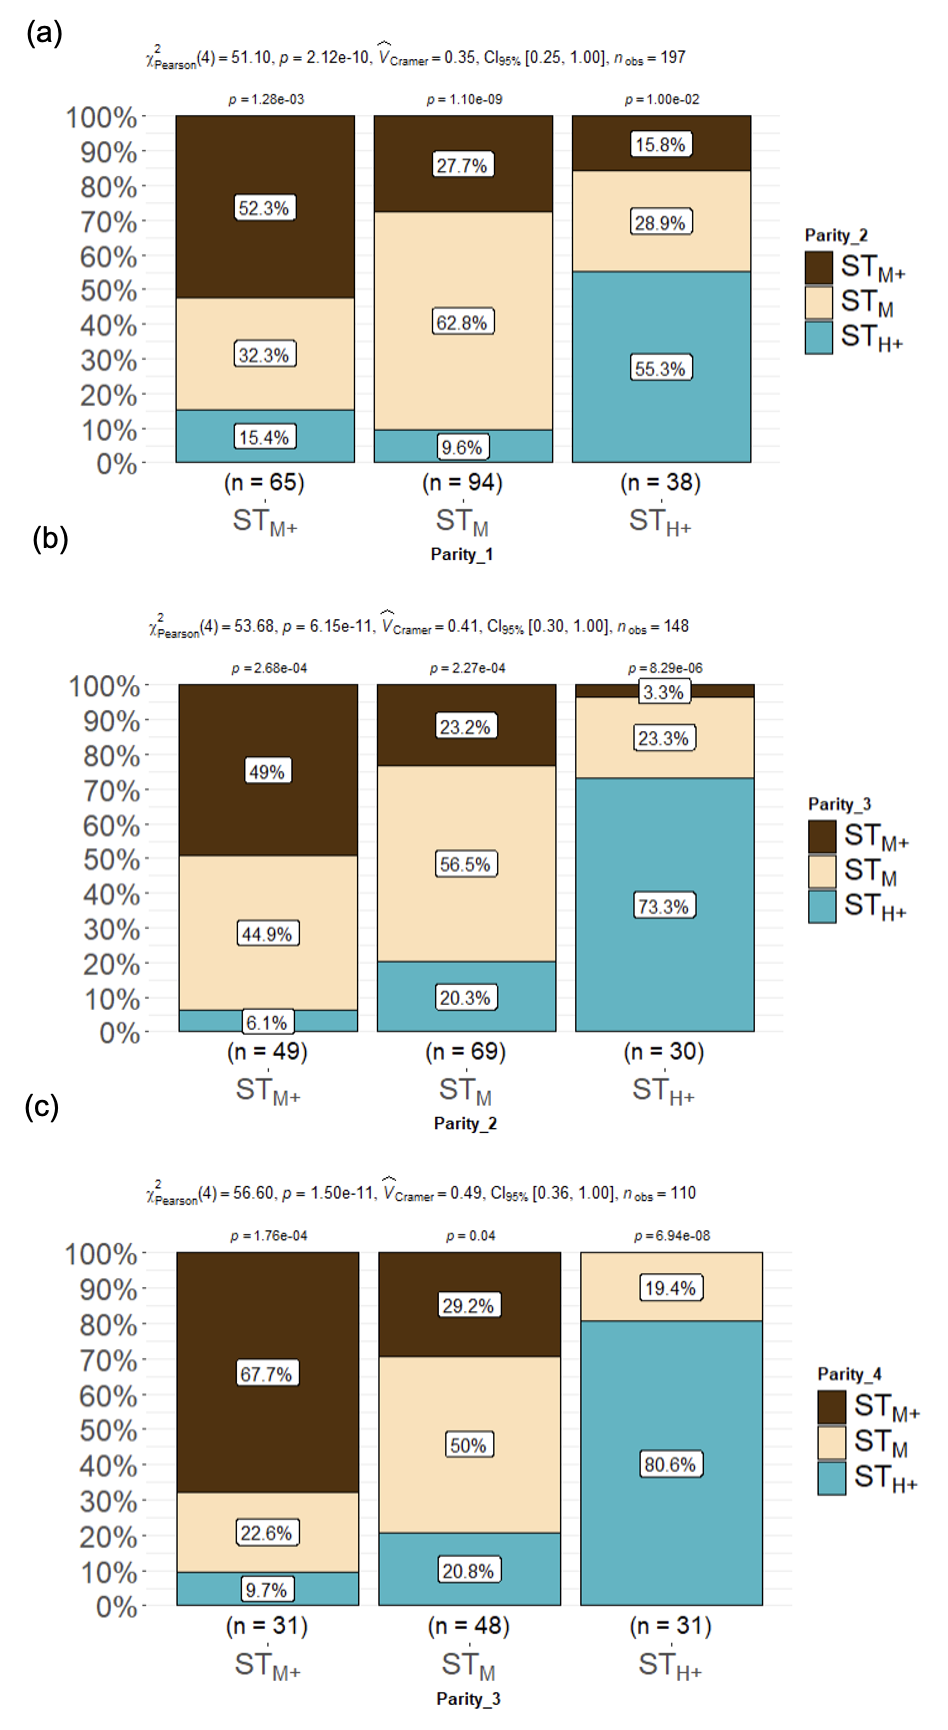
Figure 9 - Barplots displaying the frequency of goats affected to a sternal BCS cluster between (a) parity 1 and 2, (b) parity 2 and 3 and (c) parity 3 and 4 (STM+ =Medium sternal body condition score and depletion profile; STM =Medium sternal body condition score and low depletion profile; STH+ = High sternal body condition score and depletion profile).
This can be explained by a lower level of development of the mammary gland (Safayi et al., 2010).This shape of lactation curve was also observed in the study of Arnal et al. (2018). However, persistency and MY are not always negatively correlated, because for all parities we observed that the highest productive clusters were those with a medium persistency (YpH, YmH) rather than those with the lowest persistency. This result is close to the finding of Arnal et al. (2018) that their highest productive cluster had a high persistency.We can hypothesize that better fed goats produce more milk and are better able to maintain that production.
Despite differences between Saanen and Alpine goats being reported in the literature (Gipson & Grossman, 1990; Rupp et al., 2011; Arnal et al., 2018), breed did not have a significant effect on the scale or the shape of the lactation curves in the present study, regardless of parity on the two farms. It should be noted that the two breeds were only present on one farm (Grignon) and thus had the same feeding and management environment.
Lactation curves of BW
For BW curves we found three clusters for primiparous and multiparous goats. Parity and breed played a strong role on the scale of BW curves. As expected, primiparous goats were lighter than multiparous ones. For all parities, we found low depletion clusters (WpL-, WmL-, WpH-, WmH-) and high depletion clusters (WpH+, WmH+). The low depletion clusters had the same shape but differed in terms of level. Only the high depletion clusters differed in terms of shape from the other clusters. However, the depletion speed was lower in primiparous goats than in multiparous goats. Indeed, for primiparous goats, the difference between kidding and the minimum of BW averaged 3.7 kg, while for multiparous this difference averaged 8.3 kg. These results are consistent with what Sauvant et al. (2012) observed when they modelled the BW curve by parity. They observed that primiparous were lighter and lost less BW (4.0 kg on average) than multiparous goats (7.3 kg on average). To our knowledge, little work has been done to characterize BW curves in dairy goats. Our work can be compared to the study of Macé et al. (2019) in meat sheep. They analyzed BW longitudinal data in 1146 ewes to characterize curves over multiple production cycles. Most of their curves had the same shape but differed in terms of level.
All multiparous clusters had a higher BW at kidding (BWk) than at the beginning of the subsequent gestation (BW210). In contrast, for primiparous clusters the opposite was mainly true, indicating that primiparous goats were still growing in first lactation. For multiparous and for all clusters BWk was higher than BW210 at the end of lactation. BW is easy to measure on farm to monitor animals, especially to quantify energy balance (Thorup et al., 2012). However, BW measures also include digestive content, growth, gravid uterus and body reserves. Therefore, BW measures alone are not consistent enough to quantify body reserve changes. They need to be analyzed with BCS to better understand body reserves dynamics.
A breed effect was observed for BW curves: Saanen goats were more represented in the high-level clusters for all parities (WpH- , WmH). They were generally heavier than Alpine goats (Sauvant et al., 2012).
Lactation curves of BCS
For lumbar and sternal BCS we found three clusters for all parities. First for all parities, we found high depletion clusters for lumbar (LUM+, LUH+) and sternal (STM+, STH+ ) BCS. Then, we found low depletion clusters for lumbar (LUM) and sternal (STM) BCS. High depletion clusters presented the same shape but differed in terms of level. Only the low depletion clusters differed in terms of shape. These results are also consistent with the observations of Macé et al. (2019). They found the same shape but differing in terms of level. Moreover, for the high depletion clusters, the variation between kidding and the minimum of BCS averaged 0.4 points for LUM+ , 0.3 points for LUH+,and 0.5 points for STM+ and STH+. Our values, especially for sternal BCS, are lower but close to those described in the French feeding system (Inra, 2018).
Parity did not significantly affect BCS curves. Indeed, primiparous goats represented a third of the whole population in each of the clusters. Breed did not significantly affect BCS curves. We observed only a farm effect on BCS because Grignon’s Alpine and Saanen goats were more represented in the LUM and STH+ clusters. This can probably be explained by differences in the personel carrying out the BCS evaluation (although differences in herd management, or a random distribution linked to the clustering approach cannot be excluded).
A great diversity of associations among biological functions
The second objective of this work was to assess the diversity of associations among the different phenotypic curves. We investigated whether one phenotypic curve was associated with another. At the lactation scale, the Chi² test was significant for associations but the Cramer’s V showed weak to moderate values (globally less than 0.4) (Kotrlik et al., 2011). This lack of strong associations among lactation curves of MY, BW and BCS suggests there exists a relatively large diversity of energy partitioning strategies among individuals. Associations among MY, BW and BCS were well-studied in dairy cows. Some studies showed a positive correlation between pre-calving BCS and milk production (Waltner et al., 1993; Roche et al., 2007), whereas other studies did not find any relationship between these variables (Garnsworthy & Topps, 1982; Garnsworthy & Jones, 1987). More recently, Ollion et al. (2016) assessed the diversity of trade-offs between milk production, body reserves and reproduction in early lactation dairy cows. They showed four different trade-off profiles according to a priority given to a biological function. The first trade-off profile represented cows giving priority to lactation instead of reproduction, the second trade-off profile represented cows giving priority to reproduction instead of lactation. The third trade-off profile represented cows with poor performances in all functions, and the last trade-off profile represented cows with no trade-off among functions. All of these approaches considered correlations between traits at one time point and not at the whole lactation scale. Moreover, these performance traits were evaluated at the beginning of the lactation where cows exhibited a negative energy balance allowing energy partitioning in favor of milk over body reserves. Another possible explanation for the lack of strong associations found in our study is that trade-off between life functions, and therefore correlations between traits, are well expressed when animals face feed shortage (Blanc et al., 2006; Friggens et al., 2017). Our data came from two experimental farms where we can assume that animals are well managed and not so constrained in terms of nutrition.
The diversity of associations among biological functions found in the present study could also suggest a great diversity in intake at the individual level. However, we are not able today to accurately evaluate individual intake. Furthermore, BCS was used as a proxy to evaluate body reserve dynamics. As a subjective evaluation of body reserves, BCS was probably not accurate enough to capture a relationship with MY. MY fat would have been important to consider, because at equal MY fat could vary a lot. However, this variable was not considered in our study because although some data were available, the frequency was low (less than one measurement per month). On the one hand, this diversity of biological profiles can be seen as a potential resource to improve farming system resilience (Dumont et al., 2020). On the other hand, this diversity raises questions about feeding systems that assumed a relationship between a BW and a MY curve. There is a need to better quantify body reserves contribution in terms of energy to goat’s requirements (Inra, 2018). These findings question management strategies that are based on the average animal, i.e; ignoring cluster types. A perspective can be to adapt management strategies to the diversity of individual profiles in terms of phenotypic curves and then better match animal’s requirements.
The final objective of this work was to assess the diversity of phenotypic curves at the lifetime scale. For each phenotypic trait, the Chi2 test was significant. Cramer’s V test showed lower values for MY than for BW and BCS suggesting stronger associations for BW and BCS. For MY curves, we saw for primiparous goats that almost half of the goats in the YpH cluster remained in this cluster in parity 2, while the lowest productive goats (YpL- and YpL+ ) switched cluster in parity 2. For multiparous, we observed a more stable pattern of cluster membership with two thirds of the goats in the YmH cluster remaining in this cluster in successive lactations. Usually, milk production increases from first to fourth parity. After the fourth parity, the level of milk production decreases (Arnal et al., 2018). However, with genetic improvement, we can make the hypothesis that some goats can reach their milk potential earlier. Goats that stayed in the highest productive clusters could be animals that have reached their milk potential relatively early. Goats that are changing clusters could be the ones that have not reached their potential early. For BW curves across parities, we saw that for primiparous goats, most of the goats in the WpL- remained in the lowest BW cluster (WmL- ) in parity 2, while WpH+ switched to the WmL- cluster. Goats in the WpH+ presented the highest depletion speed, so they were not able to recover from the intense depletion and remained in the lowest cluster in parity 2. For multiparous goats, we also observed a pattern of cluster membership, with more than three-quarters of the goats in the WmH- profile remaining in this cluster in successive lactations. Half of the goats in the WmL- remained in this cluster in successive lactations. For sternal BCS curves across parities, we saw that more than half of the primiparous goats in the three clusters remained in their cluster in parity 2. For multiparous goats, we observed that three-quarters of the goats in the STH+ cluster remained in this cluster in successive lactations. More than half of the goats in the STM+ and STM remained in their cluster in successive lactations. These observations on BW and BCS over successive lactations, are consistent with what Macé et al. (2019) observed in meat sheep. They observed one-third up to half of ewes remaining in the same profile during successive cycles of production. They supposed that changes in profile distribution could be linked to litter size that can play a role in body weight depletion. We did not consider the prolificacy of the goats in our study. This information was missing for 35% of the animals. When the number of kids was known (single kid for 33% of the goats, two kids for 51%, three kids and more for 16%), we did not find any relationship with our clusters. However, it is an information to consider in further analysis as it is described to be a factor related to milk production (Hayden et al., 1979; Zamuner et al., 2020). These results highlighted the importance of a lifetime approach to better understand potential changes in priorities among functions and see how an early lifetime performance can impact the whole productive lifespan (Puillet & Martin, 2017). Lifetime and longevity approaches are increasingly being studied because in France from 1991 to 2011, the female productive life decreased by 346 days, which led to an average productive lifespan of 2.7 years per goat (Palhière et al., 2018),which increases replacement costs.
A methodology to analyze trade-off between phenotypic curves with heterogeneous data frequency
This methodology was built to analyze the trade-off between phenotypic lactation curves based on longitudinal data with different frequencies. We used models adapted to the data frequency to better characterize our curves. However, this approach implied the creation of synthetic indicators to have the same baseline for phenotypic curves characterized by different models. For MY curves, synthetic indicators were simple to find, because we used common indicators to summarize a lactation curve with level and dynamic indicators such as the MYpeak, Peak time and Persistency. However, because the BW (dataset 1) and BCS data were less frequent (datasets 1 and 2) less elaborate models were used. This then meant that a more simple set of summary indicators was used to characterize these curves, which may not be as informative as those for MY. With heterogeneity in frequencies, it is difficult to use the same models to capture phenotypic curves. Differences in frequencies could lead to use simple models with parameters that are not always biologically meaningful. Or it may lead to the use of more complex models that deal with problems of parameters identifiability. It is important to find a way to use biologically meaningful parameters from different models as inputs for a clustering approach. This approach with model parameters will help to summarize the phenotypic curves without considering synthetic indicators.
Further development and potential use of on-farm record for managing animal
With development of on-farm automatic measuring technologies, more frequent data for MY or BW are becoming available. Some authors developed methods to characterize new indicators such as the deviation of milk production from a theoretical potential production (Ben Abdelkrim et al., 2020; Poppe et al., 2020; Adriaens et al., 2021).Intense and rapid MY or BW losses might be used as indicators of disease or metabolic disorders. Being able to identify these animals is of great interest for farming management. In our study, we used specific models that dissociated the effects of perturbation from a theoretical unperturbed curve. To characterize phenotypic curves, we focused only on unperturbed curves, which represented the potential production that an animal could have in a non-perturbed environment. With unperturbed MY and BW curves we saw a diversity of associations, it would be of future interest to also consider perturbations. The extent to which there are common perturbations on MY and BW curves may be informative. This approach has been used in dairy cows where Ben Abdelkrim et al. (2021) identified common perturbations in MY and BW. Using perturbations in a phenotypic curve analysis could help to select animals that better cope with their environment.
Data acquisition for BCS is more complicated in goats than in dairy cows. Manual BCS evaluation provided satisfactory results but is still a subjective method depending on the operator (Lerch et al., 2021). Recent studies have shown that new methods such as 3-dimension imaging did not provide satisfactory estimators of body composition and further developments may be needed to develop a robust phenotyping tool (Lerch et al., 2021). For all parities, BCS curves were well discriminated one month after kidding and stayed constant over the whole lactation. This observation suggests that BCS measures frequency can be reduced to key periods (kidding period, two months before breeding period, dry-off). This paper is the first step of a study that will include reproductive success in the analysis. Including reproduction outcome will help to predict fertility according to phenotypic curves for a given lactation. This analysis will be conducted also on the lifetime scale to look for potential unfavorable clusters. These further analyses will clarify this diversity of phenotypic curves and will provide metrics to better manage at-risk animals in terms of reproduction (e.g., finding the best periods to monitor at-risk animals). In the dairy goat sector, extended lactations became an alternative farming management to reduce culling and give another chance for a goat to reproduce. Being able to make early decisions on reproductive management, can be of economic interest and may increase sustainability (Adriaens et al., 2020).
Conclusion
With a multi-scale approach on MY, BW and BCS time-series data, it was possible to characterize the diversity of associations between phenotypic lactation curves related to milk production and the use of body reserves. For each of MY, BW and BCS, the lactation curves clustered into 4 (MY) or 3 (BW, BCS) clusters. The diversity of associations at the lactation scale between clusters suggests a diversity of energy partitioning strategies among goats, which may provide different adaptive responses to environmental perturbations. Our results challenge mainstream management strategies that are based on average animal profiles. Rather, considering diversity of performance profiles can be a way to better adapt management to individuals or groups of individuals to improve their robustness. At the lifetime scale, change among clusters are more pronounced between first and second lactation, while a stable pattern of cluster membership appears for multiparous goats. Indeed, more than two thirds of the highest clusters for each phenotypic curve remained in these clusters in successive lactations. To further identify some clusters or combination of clusters that are at risk of culling, a first perspective of this study is to combine reproductive performance with MY, BCS and BW curves and then provide metrics to better manage animals at risk of culling.
Acknowledgements
We gratefully acknowledge the teams at the INRAE UMR 791 Modélisation Systémique Appliquée aux Ruminants (Ile-De-France, France) experimental farm and Le Pradel experimental farm (Ardeche, France) for the care of the animals and their work to provide the different dataset. We gratefully acknowledge Maxime Legris from l’Institut de l’Elevage (Ile-De-France, France) for his help on statistical support for this paper. We gratefully acknowledge Nicolas Friggens for his help to revise the English of the manuscript.
Preprint version 3 of this article has been peer-reviewed and recommended by Peer Community In Animal Science (https://doi.org/10.24072/pci.animsci.100234; Atzori, 2024).
Funding
This work was funded by the French Livestock Institute and was supported by ANRT (Association Nationale de la Recherche et de la Technologie) with a CIFRE doctoral fellowship (2020/1547). This doctoral fellowship is a part of a research axis of a Technical Joint Unit called “Sustainable goat systems of tomorrow” (UMT SC3D).
Conflict of interest disclosure
The authors declare that they comply with the PCI rule of having no financial conflicts of interest in relation to the content of the article. Laurence Puillet is a recommender of PCI Animal Science.
Data, scripts, code, and supplementary information availability
Data and scripts/code are deposited on Recherche Data Gouv (https://doi.org/10.57745/C1XPQ2; Gafsi, 2023a)
Appendices
Appendices are deposited on Zenodo (https://doi.org/10.5281/zenodo.10090604; Gafsi, 2023b)