
Latest Articles
-
Section: Health & Movement Sciences ; Topics: Psychological and cognitive sciences
Exploring the Role of Physical Effort in the Rewarding Value of Sedentary Behavior
10.24072/pcjournal.820 - Peer Community Journal, Volume 6 (2026), article no. e113
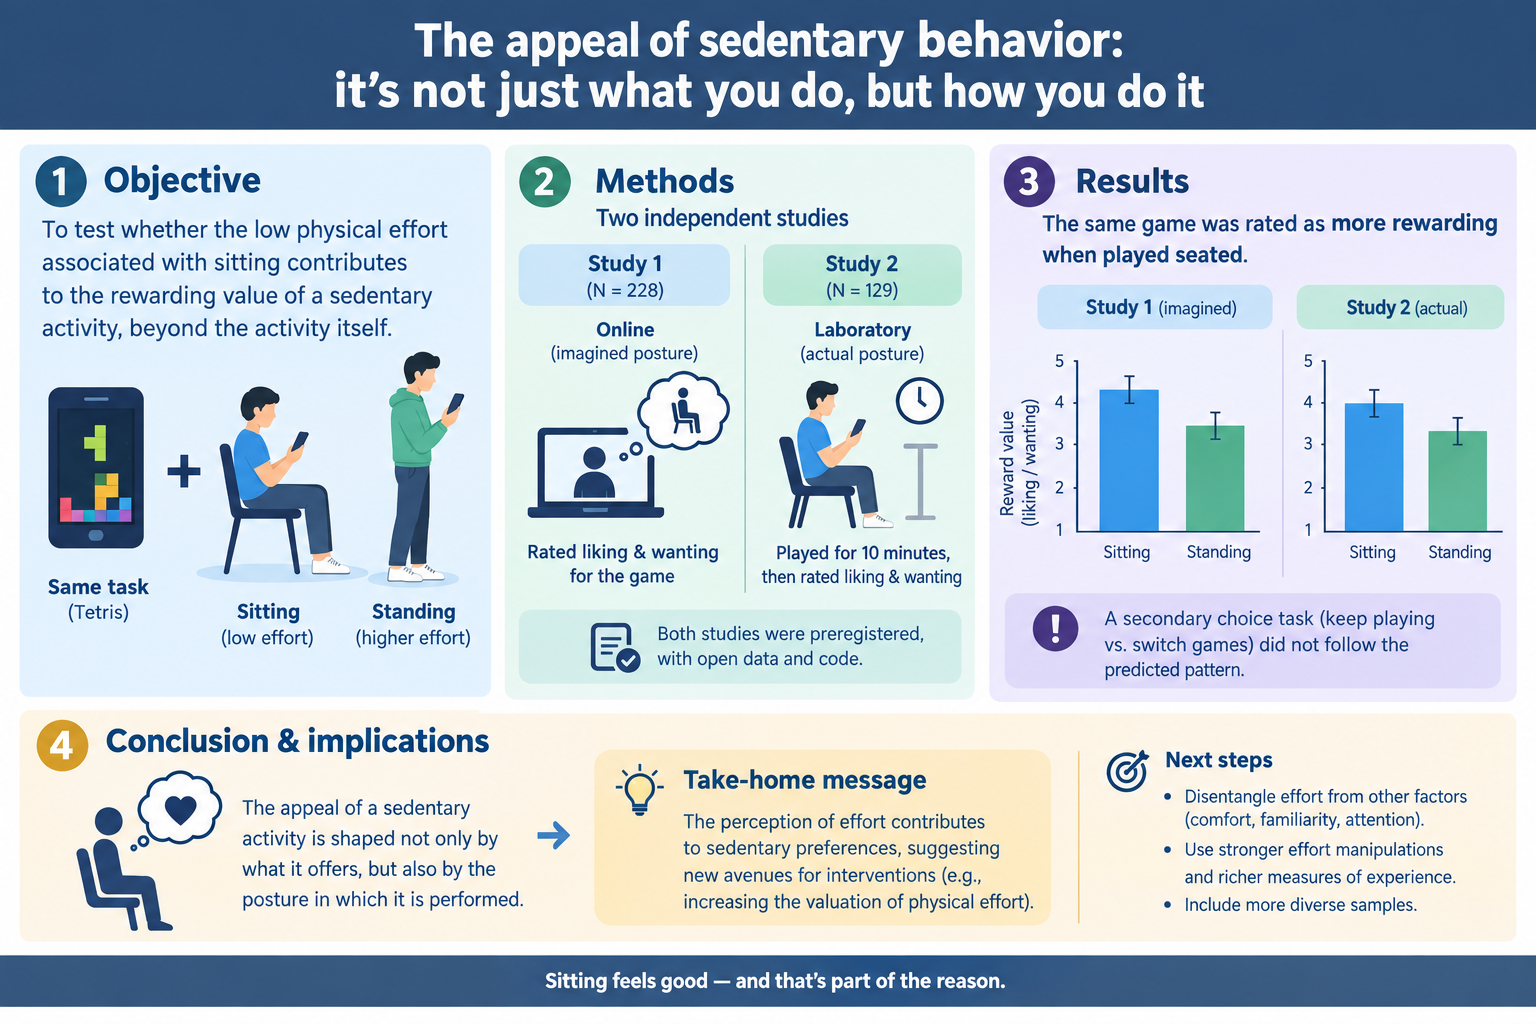
Get full text PDFObjective: Sedentary behavior is commonly studied based on the value of the higher-order task being performed, such as watching TV, using a phone, or playing video games. However, it is possible that the low physical effort associated with these behaviors also contributes to their appeal. That is, individuals may be drawn not just to the task but to the low effort it is paired with. This study aims to test this possibility by manipulating body position (sitting vs. standing) while participants engage in a familiar sedentary task (i.e., playing Tetris). Methods: To test this hypothesis, we manipulated body position during a smartphone video game task to examine how sitting versus standing affected the rewarding value assigned to the game. Results: Our results (two independent studies, N = 228 and N = 129) show that the rewarding value of this sedentary behavior also stems from the low effort cost associated with sitting. Conclusions: These findings suggest that the perception of effort may contribute to influencing sedentary preferences and provide valuable insights for interventions aimed at reducing excessive sedentary behavior, such as targeted strategies to increase the valuation of physical effort.
-
Section: Mathematical & Computational Biology ; Topics: Biophysics and computational biology, Systems biology, Cell biology
Questioning the G2 phase in the budding yeast cell cycle with a qualitative and possibilistic model
10.24072/pcjournal.807 - Peer Community Journal, Volume 6 (2026), article no. e112
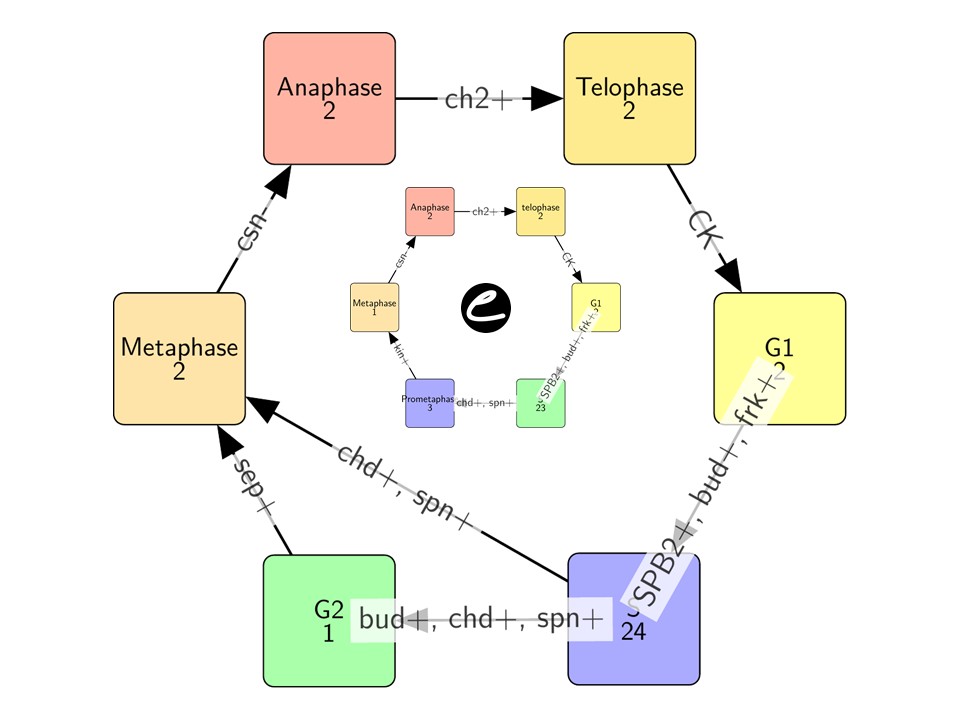
Get full text PDFThe budding yeast S. cerevisiae, a foundational model for cell cycle studies, exhibits a complex phase organisation (G1, S, G2/M) governed by checkpoints ensuring faithful cellular inheritance. However, the existence of a distinct G2 phase in yeast remains debated, with some advocating for a prometaphase instead. To address this issue, we developed a discrete-event, qualitative, and possibilistic model, the first one to our knowledge, to integrate organelle-level components (replication forks, sister chromatids, mitotic spindle, bud) while remaining parsimonious. Unlike molecular-centred or overly complex whole-cell models, this approach bridges broad systemic and finer mechanistic scales.Our results demonstrate that the model faithfully recapitulates cell cycle progression and supports the dispensable G2 phase. This possibilistic model inspired from recent applications in ecology advocates in favor of the necessity of prometaphase. This study thus provides a unifying and flexible framework to resolve long-standing ambiguities in yeast cell dynamics, while avoiding the pitfalls of excessive complexity or reductionism.
-
Section: Evolutionary Biology ; Topics: Evolution
Evaluating the roles of testosterone and sex-linked genes in territorial aggression of sex-reversed XY females in the African pygmy mouse
Heitzmann, Louise D.; Perez, Julie;
Charbonnier, Romann;
Fichter, Marc;
Hautecoeur, Xavier;
Deremarque, Théo;
Martin, Agnès O.;
Veyrunes, Frédéric
Perez, Julie;
Charbonnier, Romann;
Fichter, Marc;
Hautecoeur, Xavier;
Deremarque, Théo;
Martin, Agnès O.;
Veyrunes, Frédéric
10.24072/pcjournal.786 - Peer Community Journal, Volume 6 (2026), article no. e111
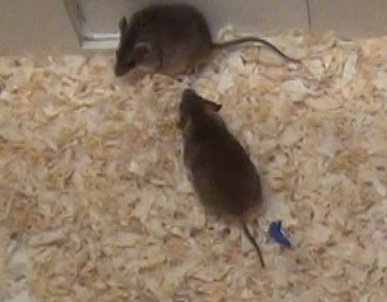
Get full text PDFSex differences in social aggression are widespread across the animal kingdom, with males typically displaying greater territoriality. While this dimorphism has traditionally been attributed to sex hormones, sex chromosomes can also contribute to it independently of hormonal influence. In the African pygmy mouse, Mus minutoides, naturally occurring sex-reversed XY females (named X*Y due to a mutation on the X chromosome) are highly territorial in comparison to the other female genotypes present in the population (XX and XX*). However, the molecular basis of this phenotype remains unknown. Here, we evaluate molecular factors - known to correlate with aggressiveness - following a standardized behavioural assessment of aggression. We focus on i) the androgen pathway by quantifying testosterone serum levels and expression of its receptor in the brain; ii) the brain dopaminergic system through expression of dopamine-regulating genes, including the sex-determining Sry gene; and iii) neuroendocrine circuits, via vasopressin and oxytocin expression. These systems, although distinct, converge on hypothalamic-limbic circuits that regulate social behaviour and threat responses, providing an integrated framework for the modulation of aggression. Contrary to earlier reports, we found reduced level of aggression in X*Y females, likely to reflect a breeding facility effect. We also observe no correlations between aggressiveness and androgen levels or gene expression of the tested factors. However, our results support a stimulation of the dopaminergic system and of the oxytocin pathway following the agonistic assay suggesting their potential involvement in aggression-related responses. This further supports the idea that aggression is multifactorial. It is shaped by the interaction of several neuroendocrine and neurotransmitter pathways rather than a single determinant.
-
Section: Ecotoxicology & Environmental Chemistry ; Topics: Agricultural sciences, Environmental sciences, Ecology
Citizen-science data reveal drivers of PFAS variability in backyard chicken eggs
10.24072/pcjournal.816 - Peer Community Journal, Volume 6 (2026), article no. e110
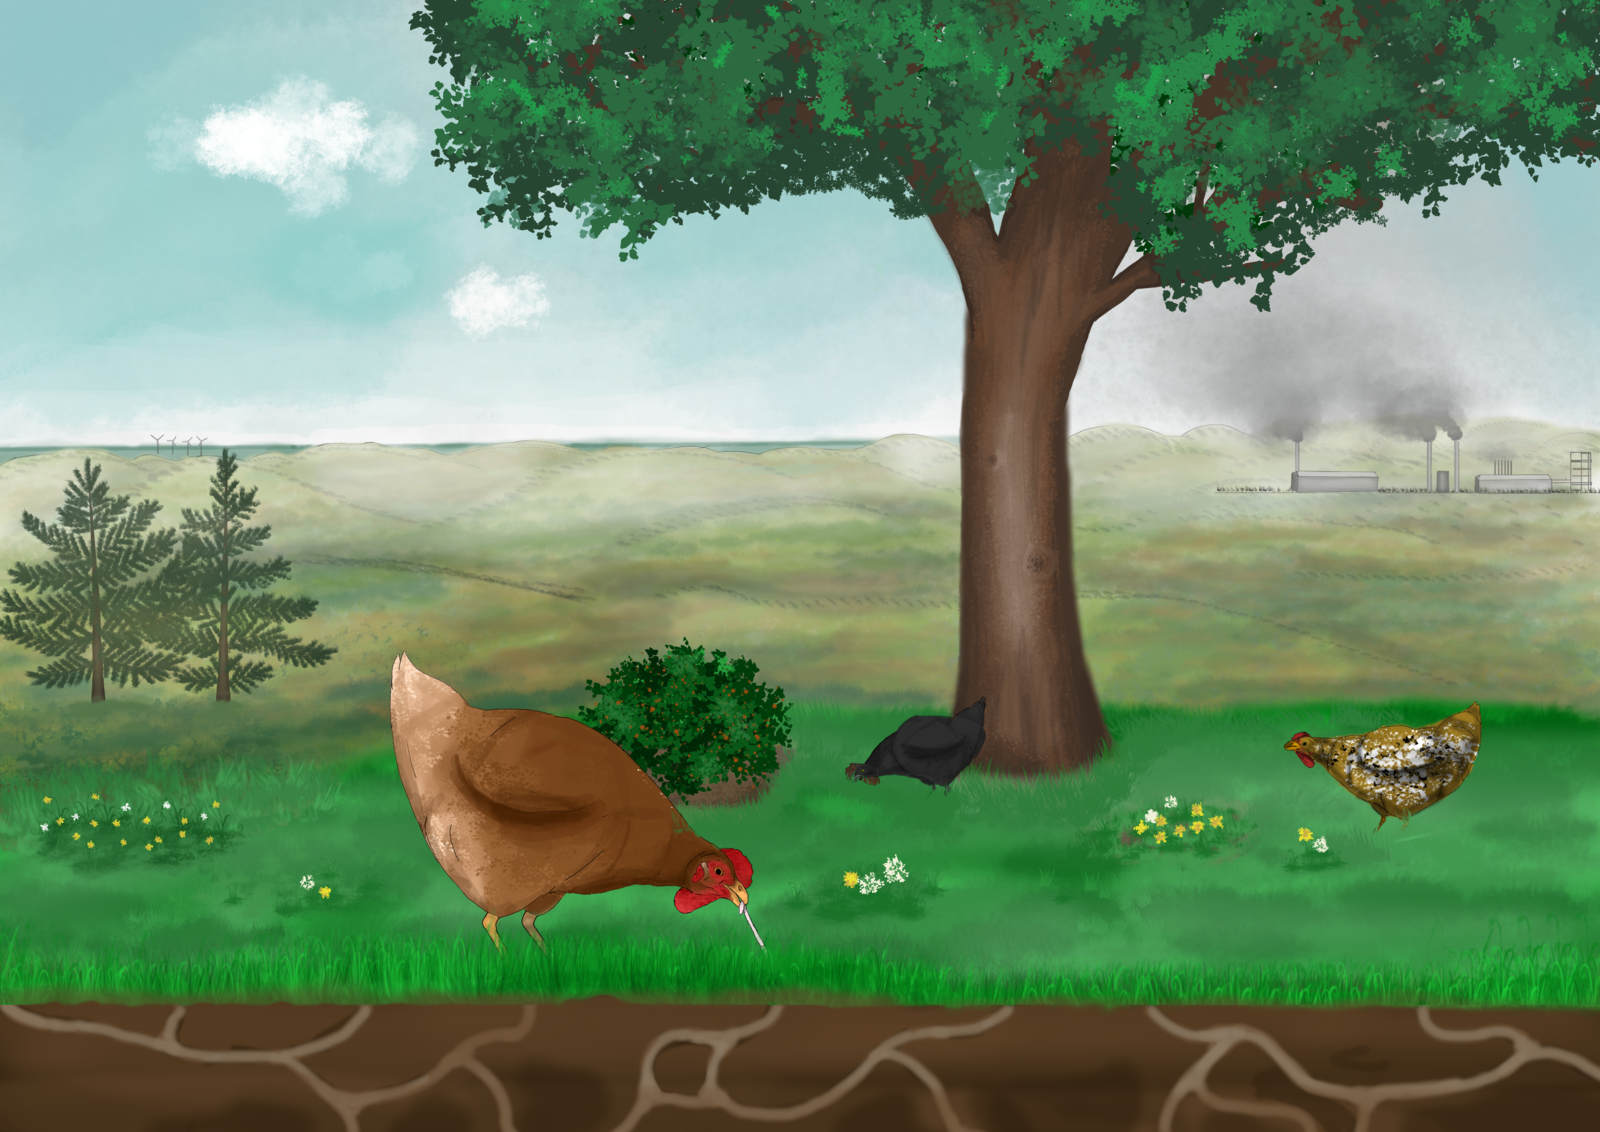
Get full text PDFPer- and polyfluoroalkyl substances (PFAS) are widespread synthetic contaminants that can accumulate in food, such as chicken eggs. Although European Union maximum levels for PFOS, PFOA, PFNA and PFHxS apply to commercialised eggs, backyard chicken egg concentrations frequently exceed these limits. Consequently, in the Netherlands, the national health authority advised against consuming backyard eggs. In response, many chicken owners tested their eggs and openly shared the results through a citizen-science initiative, resulting in the first large, citizen-led PFAS dataset worldwide. The dataset comprises 801 laboratory measurements and includes information on husbandry conditions, including uncovered outdoor space, flock size, feed type and water source. We conducted an exploratory analysis to identify variables associated with variation in the egg concentrations of the EFSA-4 PFAS: PFOS, PFOA, PFNA and PFHxS. Contamination was widespread, with only 36% of samples below EU maximum levels. PFOS dominated, accounting for 87% of the mean summed concentration. Repeated egg sampling revealed substantial temporal variation, indicating that concentrations are dynamic and that single measurements do not reliably reflect human exposure. Generalised additive models showed that surface area of uncovered outdoor space per hen was often the strongest predictor, with larger foraging areas being associated with higher PFAS levels. Larger flock size, higher egg production, and continuous access to food were associated with lower concentrations for three of the four PFAS. Diet and water source were not significantly associated with PFAS levels. Spatial patterns showed decreasing PFAS concentrations with distance from the coast, possibly caused by sea spray aerosol deposition, while PFOA levels were strongly related to distance from a fluorochemical plant, with the highest concentrations downwind. These results suggest that atmospheric deposition shapes PFAS spatial distribution, and uptake by free-ranging hens most likely occurs predominantly via ingestion of contaminated soil invertebrates. Future experimental studies could evaluate mitigation options targeting the soil compartment, including soil modification or limiting soil fauna access through chicken enclosure modifications.







Sections
- Animal Science 34
- Archaeology 49
- Ecology 149
- Ecotoxicology & Environmental Chemistry 21
- Evolutionary Biology 115
- Forest, Tree & Wood Sciences 11
- Genomics 65
- Health & Movement Sciences 17
- Infections 39
- Mathematical & Computational Biology 34
- Microbiology 25
- Network Science 6
- Nutrition 5
- Neuroscience 13
- Organization Studies 4
- Paleontology 16
- Plants 5
- Psychology 5
- Statistics & Machine learning 2
- Registered Reports 4
- Zoology 29





Membership



Image Credits
The network image was drawn by Martin Grandjean: A force-based network visualization CC BY-SA