
 CC-BY 4.0
Introduction
Fifty shades of dental microwear
Dental microwear analysis has been a prominent method for investigating the diet of extant and extinct species during the last 40 years (e.g., Walker et al., 1978; Kay, 1981; Teaford, 1985, 1988; Ungar, 1996; Teaford et al., 1996; Solounias & Semprebon, 2002; Merceron et al., 2005; Merceron, Blondel et al., 2005; Scott et al., 2005; Ungar et al., 2008; Rivals & Semprebon 2011). It is based on the observation that food leaves microscopic wear marks on dental wear facets, and that those marks fade as the tooth wears, only to be replaced by new microwear marks (Walker et al., 1978; Gordon, 1982; Teaford & Oyen, 1989; Winkler et al., 2020). The nature (scratches or pits), size (small to large), and frequency of microwear depend on the food's physical properties, mostly hardness, and abrasiveness, while their spatial distribution and their anisotropy are related to chewing motions and food toughness (Teaford, 1988; Scott et al., 2006; Teaford et al., 2020; Kubo & Fujita, 2021). This allows us to infer an animal's diet during the last few weeks before its latest meal (Teaford & Oyen, 1989; Winkler et al., 2020). Apart from diet, the role of exogenous soil mineral particles and environmental conditions in dental microwear formation should not be minimized (Schulz-Kornas et al., 2019; Schulz-Kornas et al., 2020). Grit is indeed reportedly harder than enamel tissue and more abrasive than food particles (Sanson et al., 2007; Lucas et al., 2013). Still, controlled feeding experiments on sheep have shown that differences in dental microwear texture better reflect diet than the amount of exogenous particles (Merceron et al., 2016). Their digestive anatomy explains this as ruminants remove the largest external grit from food while the finest particles mimic organic amorphous silica (Clauss et al., 2023).
Initially, microwear analysis used scanning electronic or light microscopes to count pits and scratches left by the food on the enamel surface. But despite a proven ability to separate surfaces according to diet, this method is reliant on the tuning of light orientation, the counting method, the observer experience, etc. (Grine et al., 2002; Galbany et al., 2005; Mihlbachler et al., 2012). With the advent of high-resolution digitization techniques, new methods for quantifying the three-dimensional surface texture have emerged. Scale Sensitive Fractal Analysis (SSFA) uses surface parameters strongly correlated to food material properties, such as surface scale roughness estimated from area-scale fractal complexity (Asfc) that correlates to food hardness, or anisotropy (epLsar) that correlates to food toughness (Ungar et al., 2003; Scott et al., 2005; Hua et al., 2020). A second approach, Surface Texture Analysis (STA) consists of computing ISO-25178 area parameters (Schulz et al., 2010; Kaiser et al., 2015). Both SSFA and STA methods belong to the larger field of dental microwear texture analysis (DMTA). They have been used to investigate the diet of animals from a broad range of species, including insectivorous mammals (Purnell et al., 2013) but also selachians (Weber et al., 2021), lepidosaurians (Winkler et al., 2019) or dinosaurs (Sakaki et al., 2022; Winkler et al. 2022).
New methods, new challenges
Despite their reliability, DMTA approaches are facing several methodological challenges. First, they sometimes fail to separate specimens that an expert eye could visually tell apart using the number of specific microwear marks (Fig. 1). This can be mitigated by using filters to enhance the microwear versus the raw shape of the tooth surface, for instance by removing the 2nd or 8th order polynomial of the surface using least square approximation (Francisco et al., 2018a, 2018b). Failure to tell surfaces apart can also come from distinct structures concealed in the average signal. One of the SSFA parameters can solve this issue by estimating heterogeneity of complexity (HAsfc, Scott et al., 2005, 2006). An alternative approach is to consider a grid of standard number and size of cells and to measure every parameter for each cell: the presence of distinct structures would increase the dispersion of values, and could be detected using percentiles, minimal or maximal values, etc. (Francisco et al., 2018a).
Computing heterogeneity of DMTA variables helps track the most elusive structures, but it tends to generate a “jungle of parameters” (Francisco et al., 2018b), that is, too many variables to keep track of a given phenomenon. One way to bypass this issue is to compare the variables’ ability to discriminate groups, for instance using analyses of variance (ANOVAs) to find which groups can be separated using post-hoc analysis such as Tukey’s HSD or Fisher’s LSD. This analysis pipeline is very efficient and could separate animals according to their diet in several studies (Francisco et al., 2018a, 2018b; Louail et al., 2021; Merceron et al., 2021b).
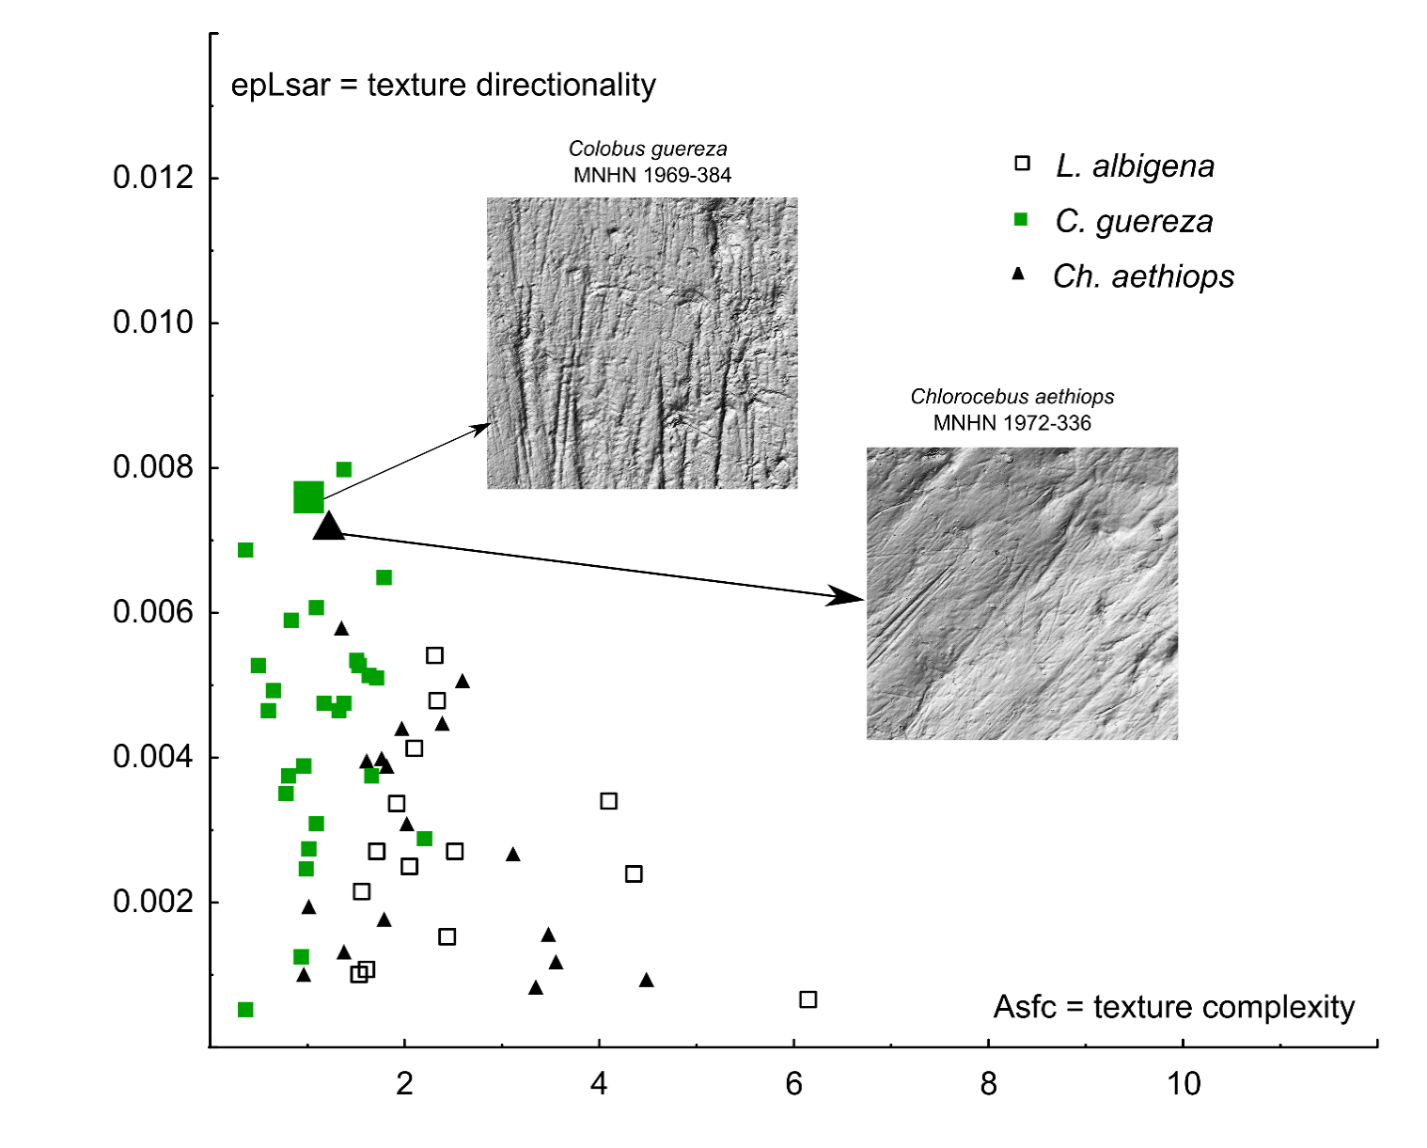
Figure 1 - Biplot showing variations of dental microwear texture anisotropy (epLsar) and complexity (Asfc) on crushing molar facets of wild-caught specimens belonging to three species of extant monkeys: the leaf-eating colobine Colobus guereza, the fruit/seed-eating mangabey Lophocebus albigena, and the opportunistic vervets Chlorocebus aethiops. There are quite notable overlaps between specific ranges. This is due to several specimens for which although an expert eye can visually differentiate surfaces (200 × 200 µm), dental microwear texture analysis cannot. For example, experts will count more wide scratches on the leaf-eating colobine (MNHN 1969-384) than on the opportunistic vervets (MNHN 1972-336). In contrast, DMTA fails to discriminate using both anisotropy (epLsar) and complexity (Asfc). Using trident and specifically the subsampling method to explore heterogeneity for all variables solves the issue.
Yet two more limitations can be identified. The first one concerns the repeatability of measures, as the code was not accessible in previous works. The second limitation is the ease of use since the pipeline made use of a combination of Fortran, Python, and R to collect the data. Consequently, fine-tuning the nature of data collection and analysis was only possible for people familiar with those languages. An open-source graphical user interface would solve both issues and make measuring, analyzing, and untangling DMTA data easier, faster, and more intuitive for beginners.
Here, we introduce trident, a graphical user interface, and its associated R source package trident for measuring dental microwear textures and analyzing the discriminant ability of DMTA variables. It can load .SUR files, remove abnormal peaks and measure 16 variables from 24 DMTA parameters (for a total of 384 variables) on batches. The computed DMTA variables (along with variables possibly added by the user on the source .txt file) can be classified according to their ability to discriminate discrete categories such as species, diet, and any other categorical variable. trident also comes with tools to perform univariate, bivariate, and multivariate analysis. All the functions can be performed from the user interface. It is worth noting that trident is free of access and the code is available to the scientific community.
We then showcase its functionalities using three case studies, representative of research questions that could be answered using dental microwear analysis:
Diet-related differences in dental microwear: The first case study is based on a controlled feeding experiment involving a single omnivorous species (Sus domesticus). Similarly to Louail et al. (2021), animals participated in trials only differing in the dietary composition of their daily ration. The influence of diet on DMTA was then quantified using trident.
Meta-analysis of a large multi-species sample: The second case study is based on a large sample grouping 260 specimens from 15 species of cercopithecid primates of Asia and Africa. We used trident to detect patterns related to species, their tribe (Cercopithecini, Colobini, Papionini, and Presbytini), or their general diet according to the literature.
Comparison with extant species to infer the diet of extinct species: The third case study is based on four sympatric species of ruminants from the Bauges Natural Regional Park, French Alps. In a previous study, SSFA variables could find differences between species, reflecting differences in dietary behavior and spatial use (Merceron et al., 2021a). We used trident to explore the dental microwear textures of this community and then used the most discriminating variables to make inferences on the diet of Gazellospira torticornis, an extinct antelope from Greece (Hermier et al., 2020).
Material and Methods
Material
Case study A: Diet-related differences in dental microwear
The first case study is based on three of the feeding trials with domestic pigs (Sus domesticus) detailed in Louail et al. (2021), to which was added another trial. The control group (N = 5) was fed exclusively with a base diet composed of ground cereal and soy seeds. The three other groups were also fed this base diet, with a supplement depending on their group:
-
The barley group (N = 5) was fed 30 % of barley seeds.
-
The corn kernel group (N = 5) was 20 % of corn (Zea mays) flour, supplemented with 20 % (as dry matter weight) of corn kernels.
-
The corn silage group (N = 5) was fed 100 % of the base diet but had access to corn silage at will.
We analyzed the deciduous upper fourth premolars of pigs aged between 6.5 and 9.5 months. See Louail et al. (2021) for more details on the experiment.
Case study B: Meta-analysis of a large multi-species sample
The second case study is based on skulls and jaws of extant cercopithecids from osteological collections of Europe, Asia, and Africa (for a detailed listing of institutions, see Supplementary Materials 1). A total of 260 casts of upper and lower second molars from 15 extant species were obtained as detailed in previous studies (Merceron et al., 2021b; Thiery et al., 2021). Each tribe of extant cercopithecids (Cercopithecini, Colobini, Papionini, and Presbytini) is represented by at least 2 species (Supplementary Materials 1). Overall, the selected taxa encompass a broad range of diets, from a large geographic range (see Rowe et al., 1996 and citations therein).
Case study C Comparison with extant species to infer the diet of extinct species
The Bauges Natural Regional Park is a typical subalpine massif located in the French Alps. In the third case study, four extant ruminants from the Bauges have been investigated: Cervus elaphus, a mixed-feeding species; Capreolus capreolus, a selective browser; Ovis gmelini musimon, and Rupicapra rupicapra, two bovid species known to be mixed feeders. Mandibles were collected at the same locality, during a short period (for more details, see Merceron et al., 2021a), representing a hypothetical fossil assemblage composed of different species occupying different small-scale habitats (open alpine grassland, bushland, shrubland, deciduous, mixed, coniferous forests) in a common geographical range.
These four extant species were then compared to the extinct antelope Gazellospira torticornis (Bovidae), from the Early Pleistocene of Greece. Specimens come from the site of Dafnero and have been described by Hermier et al. (2020).
Surface acquisition
Each tooth surface was cleaned and molded as described in previous works (Louail et al., 2021; Merceron et al., 2021a; Merceron et al., 2021b) and on the TRIDENT website (http://anr-trident.prd.fr/v/). For case study A, we investigated both the shearing (phase I) and crushing (phase II) dental facet of the very same tooth, whereas we focused on crushing facets for case study B (primates) and on shearing facets for case study C (ruminants). Each facet was scanned separately using a white-light confocal profilometer Leica DCM8, named “TRIDENT”, with a 100× objective housed at the PALEVOPRIM lab, CNRS and University of Poitiers, France (Leica Microsystems). All surfaces analyzed in the current study were pre-processed with LeicaMap (v. 8.2; Leica Microsystems) following Merceron et al. (2016). The procedure resulted in the obtention of .SUR files (saved as SUR version 7.2 or older), which were then imported into trident. It is worth noting that alternative free-of-access software, such as Gwyddion (http://gwyddion.net/) could be used to generate similar pre-treatments.
DMTA with trident
Presentation of trident
Here we introduce the R package trident, which is devoted to measuring microwear textures and classifying variables according to their discriminant power. It was implemented on two levels:
-
Functions that can be launched from the R console, for which detailed instructions can be found in the metadata and the help files of the package.
-
A shiny app named trident, which is launched from the console using the line trident.app(). The app is a wrapper for the package functions, connecting them to other packages for statistical analyses, multivariate analyses, or graphical rendering.
Below are summarized the functionalities of the interface used in the three case studies. The reader can find a more detailed description of the interface in the user manual, provided as supplementary materials (Supplementary Materials 2).
Beside R (R Core Team, 2021), trident was built using the following dependencies: car (Weisberg & Fox, 2011), DescTools (Signorell et al., 2024), doSNOW (Daniel & Weston 2022), dplyr (Wickham et al., 2023a), DT (Xie et al., 2024), factoextra (Kassambara & Mundt, 2020), FactoMineR (Lê et al., 2008), foreach (Daniel et al., 2022), ggpubr (Kassambara, 2023), ggplot2 (Wickham et al., 2023b), MASS (Venables & Ripley, 2002), nortest (Gross and Ligges, 2015), plyr (Wickham, 2011), shiny (Chang et al., 2024), shinyjs (Attali, 2021), shinyFiles (Pedersen et al., 2022), snow (Tierney et al., 2021) and stringr (Wickham, 2023).
Dental microwear texture analysis (DMTA)
Surfaces were first enhanced using the polynomial removal procedure; all procedures mentioned below are detailed in Francisco, Brunetière et al. (2018). The primary surface S1 was first numerically and automatically cleaned of any abnormal peaks. Then, considering the large-scale tooth surface geometry as an 8th-order polynomial (PS8), the latter was subtracted via a least square approximation. This procedure was performed on surfaces of the same size, as subtracting PS8 from smaller surfaces would remove larger amounts of relief. The software also allows to remove of the 2nd order polynomial (PS2).
Afterward, DMTA variables were computed. The program can currently compute four families of parameters (Table 1). The first one is complexity i.e., an estimation of the density of microwear textures across scales. The second family is height, or parameters describing the average height, its dispersion, and its variation over the surface whatever the location. The third family is spatial parameters, which describe the distribution and nature of the textures. The last family is topology, a combination of height and spatial parameters, measuring the proportion of the surface above or below determined heights. A comparison of the height parameter values found for trident and the DigitalSurf Mountains software (here the Mountains-derived software LeicaMAP is used) is provided in the supplementary information (supplementaryMaterial_Software comparisons.txt).
Lastly, we estimated the heterogeneity of complexity, height, spatial, and topology variables. The heterogeneity of a (dental) surface is related to the spatial distribution of its features: for instance, a single pit in the enamel implies more heterogeneity than several pits uniformly distributed through the enamel surface (Scott et al., 2006). Following Francisco, Brunetière et al. (2018), trident uses a fast and intuitive approach for estimating heterogeneity: the surface is divided into n grid cells, and DMTA parameters are computed for each grid cell. Then, the distribution of DMTA parameters across grid cells is used to compute heterogeneity variables e.g., mean Asfc2, maximal Asfc2, or 25th percentile of Asfc2 (Table 2). Note that this way of assessing heterogeneity differs from SSFA parameters such as HAsfc (Box 1). In the end, a total of 384 variables can be computed, giving a highly detailed description of dental microwear textures. Out of these, 24 variables correspond to the 24 parameters from Table 1 measured on the whole surface, but the remaining 360 are estimates of surface heterogeneity (Table 2).
trident does not allow to compute SSFA variables. Still, the user can find equivalents among the 384 variables available in trident. For instance, Asfc can be approximated from Asfc2, which also strongly correlates with Sdar. EpLsar, which is an SSFA estimate of anisotropy, is related to spatial variables in trident. It is especially correlated with Rmax, Sal, and Stri (Str-1), which are calculated with s = 0.5; value adapted for enamel wear surface (Francisco et al. 2018a, 2018b). Note that trident can open and manage any other variables (e.g.. SSFA, furrows, δ13C …) that a user might want to add to the source .txt file. This way, it is easy to compare trident’s variables with other parameters.
Table 1 - DMTA parameters measured in trident
|
Parameter |
Family |
Significance |
Description |
|
Asfc2 |
Complexity |
Area scale fractal complexity (#) |
Asfc2 estimates roughness through scale-sensitive fractal analysis. Asfc2 would be low for smooth dental surfaces of leaf-eating colobine monkeys and high for rough surfaces frequent in hard seed-eating cercopithecine monkeys. |
|
Sdar |
Complexity |
Relative area (developed area/projected area -1) |
Sdar is higher for rough surfaces frequent in hard seed-eating cercopithecine monkeys than for smooth dental surfaces (of leaf-eating colobine monkeys; Sdar = 0 for a perfect horizontal plane surface) |
|
Sa |
Height |
Arithmetic mean of the absolute of the heights (*) |
Sa assesses surface roughness with low values for smooth dental surfaces of leaf-eating colobine monkeys and higher ones for rough surfaces frequent in hard seed-eating cercopithecine monkeys. |
|
Sp |
Height |
Absolute of the largest height (*) |
Sp is the height of the highest peaks, which is expected to be higher for rough surfaces found in species eating hard and brittle food items. |
|
Sq |
Height |
Height standard deviation (*) |
Sq is also expected to be higher for rough surfaces than smooth ones, such as the ones found for leaf-eating colobine monkeys. |
|
Sv |
Height |
Absolute of the smallest height (*) |
Sv is the height of the deepest pit, which is still expected to be higher for rough surfaces frequent in species eating hard and brittle food items. |
|
Ssk |
Height |
Height skewness (*) |
Ssk tends to be more negative for a surface with few deep pits as expected on dental surfaces of soft foliage and closer to 0 when a rough surface has many peaks and pits found in species eating hard and brittle food items. |
|
Sku |
Height |
Height kurtosis (*) |
Sku is expected to be higher (>>3) when the surface is smooth with few deep pits or/and high peaks, and close to 3 when peaks and pits have a wider range of height values around the mean |
|
Sm |
Height |
Mean height (0 for the whole surface, but non-zero for its samples) |
Useful when associated with statistics. It tells how the subsurface heights are distributed. Differences are expected with stepped surfaces |
|
Smd |
Height |
Median height |
Useful when associated with statistics. It tells how the subsurface heights are distributed. |
|
Rmax |
Spatial |
Semi-major axis of the fACF ellipsis (**) |
Rmax is higher for surfaces with long and parallel scratches usually found on molar facets of mammals avoiding hard and brittle foods that would require orthogonal crushing motion |
|
Sal |
Spatial |
Semi-minor axis of the fACF ellipsis (**) |
Sal is higher for wide and parallel scratches |
|
Stri(*) = Str-1 |
Spatial |
Rmax/Sal ratio (**) |
Stri is high when there are numerous and long scratches. |
|
b.sl |
Spatial |
Highest slope of fACF (**) at the distance rs from the origin β |
Another way of quantifying the anisotropy. Highly correlated to Sal. |
|
r.sl |
Spatial |
b.sl/s.sl ratio (**) |
Another way of quantifying the anisotropy. Highly correlated to Stri. |
|
s.sl |
Spatial |
Smallest slope of fACF (**) at the distance rsβ from the origin |
Another way of quantifying the anisotropy. Highly correlated to Rmax. |
|
Std EX |
Spatial |
Texture direction |
Std provides main orientation direction. Useful when combined with statistics, it shows how the direction of texture changes from one part of the surface to another. |
|
Sk1, Sk2 |
Topology |
Relative area of the surface above h1ββ and h2ββ respectively |
Sk1 and Sk2 are higher for surfaces with many high heights. |
|
Smc1, Smc2 |
Topology |
Median relative area of the cells with heights exceeding h1ββ and h2ββ respectively |
Smc1, Smc2 are higher for surfaces with many high heights arranged in large peaks. |
|
Snb1, Snb2 |
Topology |
Number of cells with heights exceeding h1ββ and h2ββ respectively |
Snb1, Snb2 are higher for surfaces with many high heights arranged in thin peaks. |
|
Sh |
Topology |
Percentage of quasi-horizontal faces (normal within a 4° cone) |
Sh is low for rough surfaces and high for flat surfaces |
EX, parameters available in trident, but excluded from the three case studies; * ISO 25178; ** autocorrelation function at z=0.5 (Francisco et al., 2018a; 2018b); β maximum slope radius; ββ h1 = 85% of total height (Sv+Sp) and h2 = 95% of total height (Sv+Sp); #, Area Scale Fractal Complexity is labeled Asfc2 because its calculation mode slightly differs from the Asfc computed in Scott et al., 2006).
Table 2 - Heterogeneity variables.
|
Statistics |
Description |
|
minEX |
Minimal value |
|
maxEX |
Maximal value |
|
sd |
Standard deviation |
|
mean |
Arithmetic mean |
|
med |
Median |
|
fst.05 |
5th percentile |
|
lst.05 |
95th percentile |
|
min.05 |
Mean of values under the 5th percentile |
|
max.05 |
Mean of values above the 95th percentile |
|
fst.25 |
1st quartile |
|
lst.25 |
3rd quartile |
|
min.25 |
Mean of values under the 1st quartile |
|
max.25 |
Mean of values above the 3rd quartile |
|
skw |
Skewness of the histogram of distribution |
|
kurt |
Kurtosis of the histogram of the distribution |
EX, variables excluded from the analysis.
In each of the three case studies, all variables except minimal and maximal values were calculated on 23 parameters (Std was excluded because it is scanning orientation-dependent), for a total of 322 variables: this avoids measuring the effect of a single feature. To assess the heterogeneity, the resampling statistics were calculated for a grid of 256 cells (16×16) measuring 33 × 33 µm each (256 × 256 pixels) from the original surface measuring 200 × 200 µm (1551 × 1551 pixels).
Multichecks
The second most important part of trident relates to the classification of variables according to their ability to separate informed categories, such as diet, species, etc. In case study A, the factor is diet whereas in case study B and C, the factor is species. The software proposes functions for adding a factor variable by combining variables from different datasets, by entering it manually or automatically (see Supplementary Materials 2).
Afterward, the discriminant ability of variables is calculated using a pipeline of analysis initially designed by Francisco and colleagues (Francisco, Blondel et al., 2018; Francisco, Brunetière et al., 2018):
-
Normality: the normality of the data is tested using the Shapiro-Wilk test. If unsuccessful, we compute the skewness ratio, computed as the skewness divided by its confidence interval. If the skewness ratio is inferior to 2, the distribution is considered nearly normal.
-
Homoscedasticity: for normally distributed data, the homogeneity of variances is tested using the Bartlett test. If the test fails, the groups are still nearly homoscedastic if the variance ratio, computed as the maximum variance divided by the minimum variance for each group, is lower than 3. For nearly normal data, Levene’s test is performed to check the group variance homogeneity.
-
Ability to separate categories: If both normality and homoscedasticity assumptions are respected, or if no more than one condition is nearly respected, then the discriminant ability of variables is tested using an ANOVA. Otherwise, the discriminant ability of variables is tested using a non-parametric test, the Kruskal-Wallis test.
All these tests are implemented with a default alpha of 0.05. They have been grouped in a ‘multi check’ function (Supplementary Materials 2). If data are not normally distributed, they can also be transformed using either a base 10 logarithm function or a Box-Cox transformation (Supplementary Materials 2).
Classification of variables
We implemented five different classification methods, which can be used depending on the situation:
-
Rank based on ANOVA: Performs an ANOVA and arranges variables by ascending p-value. The purpose here is to separate discriminant from non-discriminant variables. To make things easier for users, variables are ranked by the p values of the ANOVA. One could be interested to have a first glance at the discriminant variables and most discriminating ones whatever the number of groups involved in the study.
-
Rank based on Kruskal-Wallis: Performs a Kruskal-Wallis rank-sum test and arranges variables by ascending p-value; in case the sample is far from normality or in case of small samples. This way of ranking is equivalent to the first mode but adapted for variables whose distribution does not respect conditions required for parametric tests, meaning that variables are ranked by the p values of the Kruskal Wallis analysis.
-
Rank based on post-hoc (average): Performs an ANOVA and arranges by decreasing the number of significant p-values per pair and then ascending mean p-value from post-hoc tests. The mean p-value can be either arithmetic or geometric, and the user can choose to use only significant p-values to calculate it (this is the default option). This mode allows the users to go further in classifying discriminant variables. The aim is to target the variables that discriminate the highest number of groups. Then, among variables discriminating a same number of groups, we ordered them by the increasing values of the mean of the significant p-values of the post hoc tests (here we have chosen the Tukey test). For instance, with 4 discriminant groups among 7, the mean of the 6 p values of the 6 pairs of significantly different samples is computed for each discriminant variable. They are then ordered. One could then run a PCA on trident or export the dataset with only variables showing differences on the six or five pairs.
-
Rank based on post-hoc (pairwise): Performs an ANOVA and then for a given pair, arranges variables by ascending pairwise post-hoc p-value. This mode of classification is similar to the former one. However, it differs in targeting variables that discriminate groups of interest. For instance, it can be used for a study including several species for which two of them overlap when considering traditional dental microwear textures although differences were expected because these two species have different feeding preferences. In such a case, trident can select the variables that discriminate the two species at priority.
-
Top 3: For each pair of categories, arranged by the number of significant pairwise p-values from Tukey’s HSD, then by the mean of significant p-values. The function returns the 3 best-classified variables. Because this function makes a new classification for each pair of groups, computation time and length of results increase exponentially as the number of categories goes up. Although it remains possible to use this function on any number of categories, we do not recommend using this approach for more than 5 categories (10 pairs). In most cases when comparing a few groups, three parameters appear to be the easiest and fastest way to find out which and how variables discriminate the groups.
Note that all these tests are implemented with a default alpha of 0.05. Regardless of the chosen workflow, it is possible to visualize variables using boxplots and violin plots. It is also possible to perform a principal component analysis (PCA) on a selection of variables. It provides a histogram of the percentage of variance explained by each principal component (scree plot), as well as buttons for saving and exporting the PCA results, a bivariate diagram of the selected principal components, and circles of correlations. Graphics can be saved as images.
Case-specific analysis
Case study A: Diet-related differences in dental microwear between controlled-fed pigs.
For each wear facet (crushing and shearing), data were analyzed separately. They were Box-Cox transformed, then checked for normality, homoscedasticity, and their ability to discriminate categories (Fig. 2A).
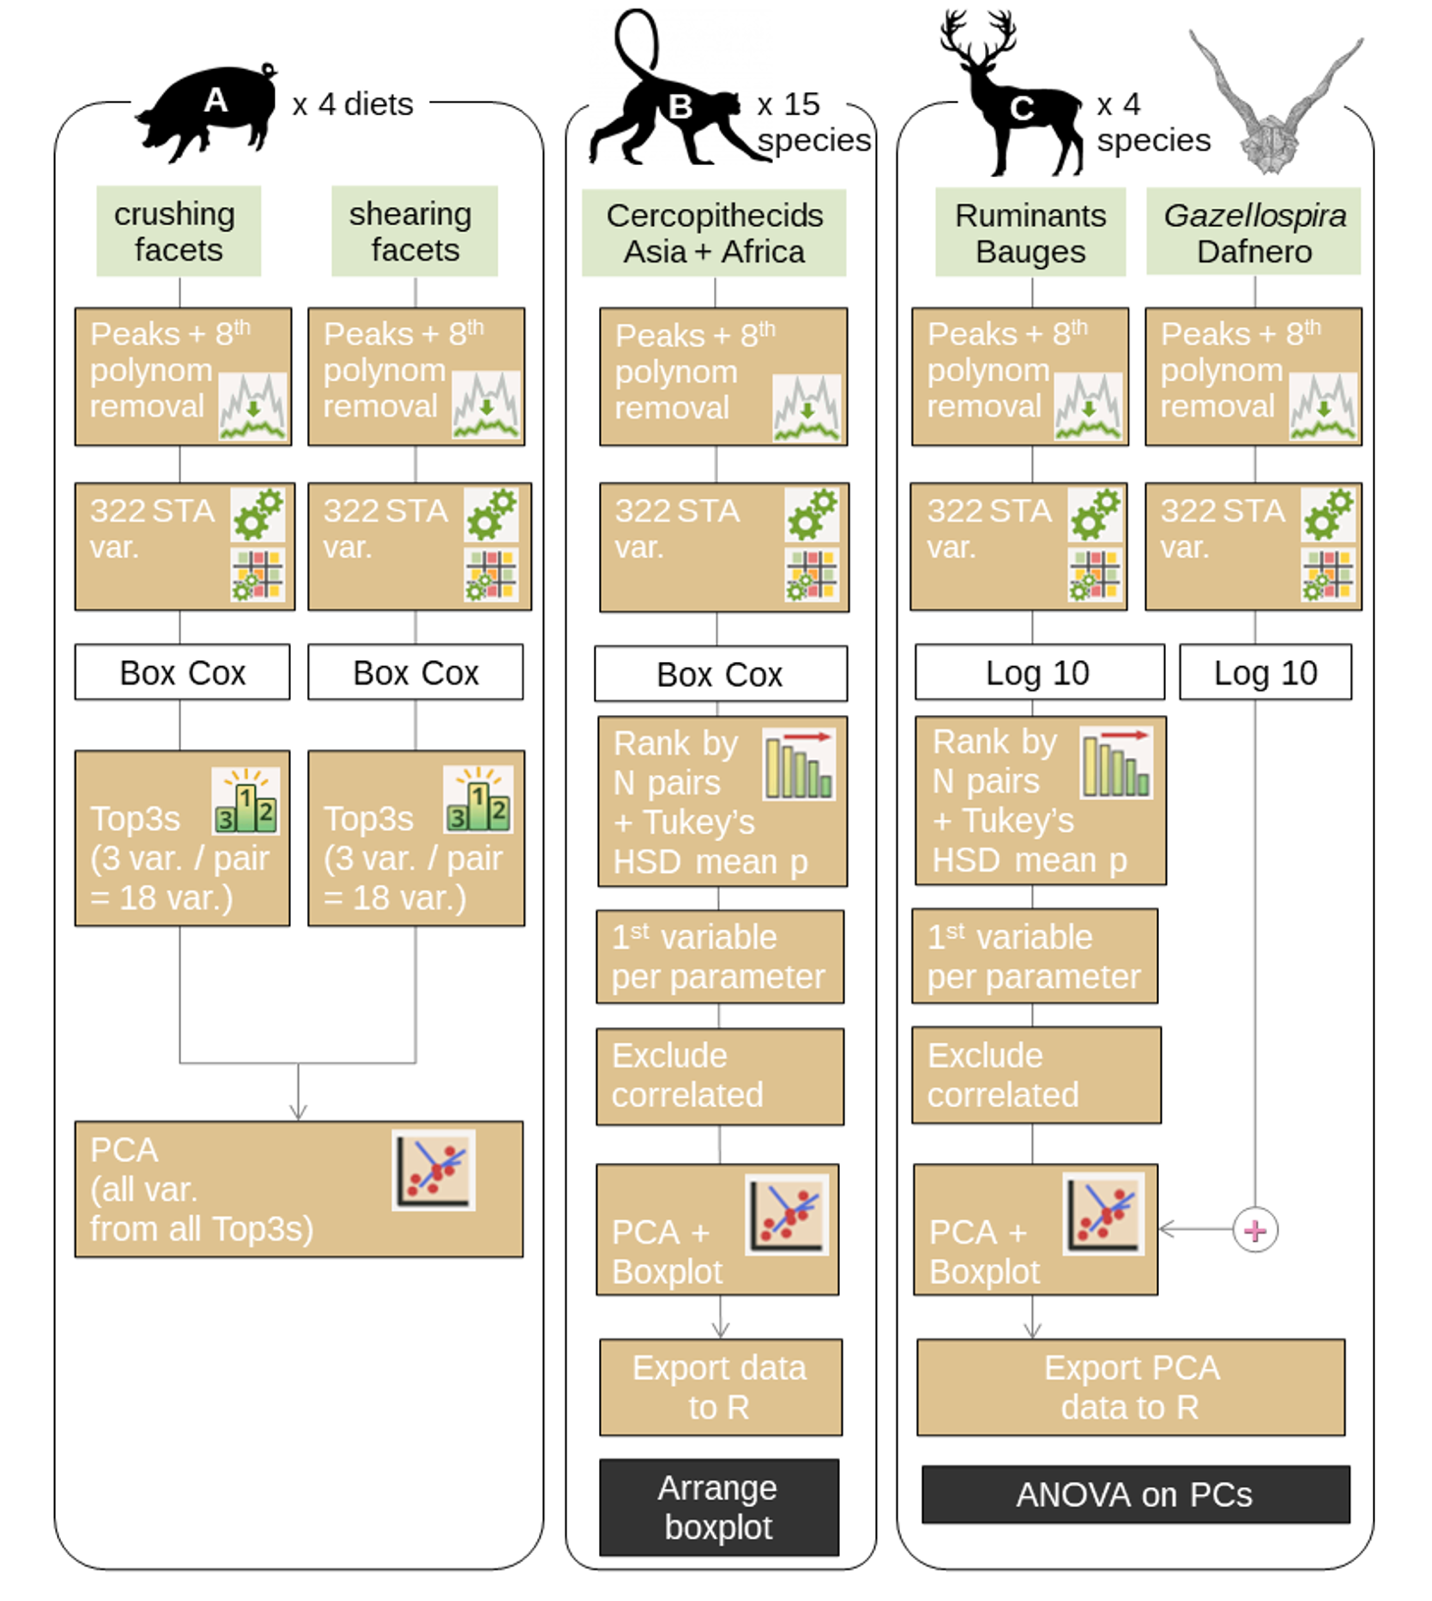
Figure 2 - Flowchart depicting the analysis for the three case studies; var. = variables; black boxes refer to step done on R without the use of the graphic interface.
Variables that passed the multi check were classified using the mean of the significant p-values from Tukey’s HSD post-hoc analysis of an ANOVA with diet as factor. They were ranked according to (1) the number of groups discriminated and (2) the arithmetic mean of Tukey’s HSD discriminant p-values (the p-value of non-discriminated groups were ignored for calculating this arithmetic mean). Among these variables, we retained only the 3 best-ranked variables (Top3). Afterward, all the retained variables for both crushing and shearing facets were combined. We performed a Principal Component Analysis (PCA) to explore their influence on data distribution. All analyses were done exclusively in trident.
Case study B: Meta-analysis of a large multi-species sample of cercopithecids.
Data were Box-Cox transformed, then checked for normality, homoscedasticity, and their ability to discriminate categories (Fig. 2B). Variables that passed the checking step were classified using the results of a post-hoc analysis of an ANOVA with species as a factor. They were ranked according to (1) the number of groups discriminated and (2) the geometric mean of Tukey’s HSD discriminant p-values (the p-value of non-discriminated groups were ignored for calculating this geometric mean). Then, for each parameter (e.g., Asfc2),
the best-ranked variable out of 14 (central + heterogeneity statistics, see Table 2) was selected. Afterward, we selected parameters with a correlation of Pearson below 0.70: variables correlated to more than 70 % with a better-ranked variable were systematically removed (calculated independently with R). The remaining variables were used for a PCA. All analyses were done in trident, but the boxplots of the first two principal components were modified for the purposes of this article in R using the ggplot2 package (Wickham et al., 2023b).
Case study C: Comparison with extant species to infer the diet of extinct ruminants
First, the Bauges data were log-transformed (base 10), then checked for normality, homoscedasticity and their ability to discriminate species (Fig. 2C). Variables which passed the checking step were classified using (1) the number of groups discriminated by the post-hoc analysis of an ANOVA and (2) the geometric mean of Tukey’s HSD discriminant p-values (the p-value of non-discriminated groups were ignored for calculating this geometric mean). Just like case study B, for each parameter (e.g., Asfc2, Sa), the best-ranked variable out of 14 (central + heterogeneity statistics) was selected, and variables correlated to more than 70 % with a better-ranked variable were systematically removed (calculated independently with R). The remaining variables were used for a PCA. At this point, the surfaces of Gazellospira torticornis were added as supplementary individuals to the PCA. All analyses were done in trident, but the boxplots of the first two principal components were modified in R using the ggplot2 package. Afterward, the principal components were exported to R and used for an analysis of variance (ANOVA). The post-hoc analysis was performed using Tukey’s HSD test.
Results
Case study A: Diet-related differences in dental microwear between controlled-fed pigs.
The first analysis, a top-3 classification performed on crushing facets after Box-Cox transformation (Table 3), revealed that the most discriminant variables are central height skewness (Ssk), central topology variables (Sk1, Sk2, Smc1, Snb1) and heterogeneity variables for complexity (Asfc2), height (Sq, Sv, Smd) and topology parameters (Sh). In contrast, the same analysis performed on shearing facets (Table 4) revealed that the most discriminating variables are central height kurtosis (Sku), the standard deviation of central height skewness (Ssk.sd), mean and median of Smd, as well as skewness and kurtosis of spatial variables (Sal, r.sl). There are no common variables between the top 3 of crushing and shearing facets.
Table 3 - Case study A: Diet-related differences in dental microwear on crushing molars facets between controlled-fed pigs, pairwise top 3 variables for each pair of compared groups ranked by the post hoc p values. All variables were box-Cox transformed. Ba, barley; Co, control; CK, corn kernel; CS, corn silage (see Figure 2 and method section).
|
pair i |
TOP3 variables for the pair i |
rank |
F |
p value ANOVA |
Post hoc p values |
|
Ba-Co |
Snb1 |
1 |
9.02 |
<0.01 |
0.09 |
|
Asfc2.fst.25 |
2 |
5.58 |
0.02 |
0.09 |
|
|
Sh.min.05 |
3 |
3.69 |
0.06 |
0.10 |
|
|
Ba-CK |
Sv.lst.25 |
1 |
4.47 |
0.03 |
0.03 |
|
Sv.max.25 |
2 |
4.83 |
0.03 |
0.04 |
|
|
Smc1 |
3 |
6.88 |
0.01 |
0.04 |
|
|
Ba-CS |
Snb1 |
1 |
9.02 |
<0.01 |
0.02 |
|
Sk1 |
2 |
8.33 |
0.01 |
0.07 |
|
|
Asfc2.min.25 |
3 |
4.69 |
0.03 |
0.07 |
|
|
Co-CK |
Smd.kurt |
1 |
4.82 |
0.03 |
0.26 |
|
Sk2 |
2 |
4.58 |
0.04 |
0.39 |
|
|
Ssk |
3 |
5.45 |
0.02 |
0.57 |
|
|
Co-CS |
Ssk |
1 |
5.45 |
0.02 |
0.15 |
|
Sq.kurt |
2 |
5.21 |
0.03 |
0.45 |
|
|
Smd.kurt |
3 |
4.82 |
0.03 |
0.54 |
|
|
CK-CS |
Smd.kurt |
1 |
4.82 |
0.03 |
0.02 |
|
Sq.kurt |
2 |
5.21 |
0.03 |
0.07 |
|
|
Sk2 |
3 |
4.58 |
0.04 |
0.35 |
When combining the most discriminating variables from both crushing and shearing facets in a principal component analysis (Fig. 3), the first and second principal components (PCs) explain 38.2 % and 21.1 % of the variances, respectively. Along PC1 and PC2, the control category overlaps with corn kernels and corn silage categories, but other groups are distinctly separated (Fig. 3A). In fact, PC1 separates barley-fed pigs from other categories, whereas PC2 separates seed-fed pigs (barley and corn) from silage-fed pigs. Other PCs failed to separate categories and were not pictured, but are available as supplementary materials (Supplementary Materials 1).
Case study B: Meta-analysis of a large multi-species sample of cercopithecids.
The analysis, a rank by post-hoc (mean) classification performed on crushing facets after Box-Cox transformation (Table 5), revealed that the most discriminant variables were a mix of central and heterogeneity variables. After removing variables correlated with the best ranked variables, the majority of variables are heterogeneity variables related to the highest percentiles among subsampled tiles (Sh.lst.05, Asfc2.max.05, Smc2.lst.25, s.sl.lst.05, b.sl.max.05 and Sku.lst.25).
The major influence of the highest percentile variables is confirmed by the PCA (Fig. 4). Indeed, these variables contribute significantly to the first and second components, which explain 42.8 % and 22.6 % of the variance, respectively (Fig. 4B). This is also consistent with the difference in absolute surface height, which is clear on the maps: along the first component, the highest value has a height amplitude of 10.95 µm (Fig. 4C, 4D) while the lowest value has a height amplitude of 0.71 µm (Fig. 4C, 4E).

Figure 3 - Case study A: Diet-related differences in dental microwear between controlled-fed pigs, from crushing and shearing facets of upper deciduous fourth premolars. Principal component analysis from the top 3 variables for each pair of dietary categories (A & B) compared with the classical SSFA biplots. A, correlation circle, PC1 versus PC2; B, bivariate graph of individuals along PC1 versus PC2; C, bivariate graph of individuals with SSFA parameters Asfc and epLsar.
Table 4 - Case study A: Diet-related differences in dental microwear between controlled-fed pigs, pairwise top 3 variables for the shearing facets. All variables Box-Cox transformed. Ba, barley; Co, control; CK, corn kernel; CS, corn silage (see Figure 2 and method section).
|
pair i |
TOP3 variables for the pair i |
rank |
F |
p value ANOVA |
Post hoc p values |
|
Ba-Co |
Sal.kurt |
1 |
3.68 |
0.06 |
0.01 |
|
r.sl.skw |
2 |
5.49 |
0.02 |
0.28 |
|
|
Smd.mean |
3 |
5.18 |
0.03 |
0.28 |
|
|
Ba-CK |
Smd.mean |
1 |
5.18 |
0.03 |
0.05 |
|
Sal.kurt |
2 |
3.68 |
0.06 |
0.06 |
|
|
Smd.median |
3 |
5.76 |
0.02 |
0.07 |
|
|
Ba-CS |
r.sl.kurt |
1 |
5.68 |
0.02 |
0.11 |
|
Sku |
2 |
3.85 |
0.05 |
0.13 |
|
|
r.sl.skw |
3 |
5.49 |
0.02 |
0.17 |
|
|
Co-CK |
r.sl.skw |
1 |
5.49 |
0.02 |
0.12 |
|
r.sl.kurt |
2 |
5.68 |
0.02 |
0.13 |
|
|
Ssk.sd |
3 |
6.01 |
0.02 |
0.62 |
|
|
Co-CS |
Sku |
1 |
3.85 |
0.05 |
0.03 |
|
Sal.kurt |
2 |
3.68 |
0.06 |
0.24 |
|
|
Ssk.sd |
3 |
6.01 |
0.02 |
0.36 |
|
|
CK-CS |
Sku |
1 |
3.85 |
0.05 |
0.02 |
|
r.sl.kurt |
2 |
5.68 |
0.02 |
0.03 |
|
|
Ssk.sd |
3 |
6.01 |
0.02 |
0.04 |
The bivariate graph of individuals for components 1 and 2, as well as the boxplot of component 1, show that there is a large overlap between categories, both at the species and the tribe level (Fig. 4A, 4C). This is due to the broad dispersion of values. When comparing the means between species (Fig. 4C), the most folivorous species (Trachypithecus auratus, Colobus guereza and Piliocolobus badius) have the lowest PC1 values. They are followed by terrestrial graminivorous papionines Papio hamadryas and Theropithecus gelada, then Nasalis larvatus, Semnopithecus entellus and Trachypithecus cristatus. The latter three are also folivorous but present higher Asfc2 values in our sample, indicating the opportunistic consumption of seeds (Thiery et al., 2021). This is supported by the surprisingly large breadth of PC1 value dispersion for these three species, especially T. cristatus. Then, opportunistic terrestrial cercopithecines and papionines show higher PC1 values, with the highest values found in the hard seed predator Lophocebus albigena (Lambert et al., 2004) and Macaca sylvanus, one of the most granivorous macaque (Kato et al., 2014).
Case study C: Comparison with extant species to infer the diet of extinct ruminants
The first part of the analysis, a rank by post-hoc (mean) classification performed, after a base-10 log transformation, on the shearing dental facets of molars of the wild-caught ruminants from the Bauges Natural Regional Park (Table 6), revealed once again that most discriminant variables were a mix of central and heterogeneity variables. After removing variables correlated with the best-ranked variables, what remains are variables based on spatial parameters (Rmax.min.25, s.sl.mean, r.sl), the standard deviation of topology parameters (Sk1.sd, Smc1.sd) and Sm.fst.25, which is the first quartile of the lowest parts of the surface’s height.
Table 5 - Case study B; Meta-analysis of a large multi-species sample of cercopithecids, the most discriminant variables for each family, classified by the number of pair (N) that shows significant differences with the Tukey’s HSD p-value.
|
Variable |
Position |
ANOVA |
Tukey’s HSD |
|||
|
F |
p value |
mean p-value |
geometric mean p-value |
N (among 105 pairs) |
||
|
Sh.lst.05 |
1 |
11.29 |
<0.01 |
0.01 |
<0.01 |
37 |
|
Asfc2.max.05 |
5 |
7.62 |
<0.01 |
0.01 |
<0.01 |
32 |
|
Sp.max.25 |
12 |
9.48 |
<0.01 |
0.01 |
0.01 |
24 |
|
Sa |
13 |
9.39 |
<0.01 |
0.01 |
<0.01 |
23 |
|
Sq |
15 |
9.03 |
<0.01 |
0.01 |
0.01 |
23 |
|
Sv.fst.05 |
16 |
6.11 |
<0.01 |
0.01 |
0.01 |
23 |
|
Sdar.max.05 |
18 |
6.37 |
<0.01 |
0.01 |
<0.01 |
22 |
|
Smd.max.25 |
25 |
5.84 |
<0.01 |
0.01 |
<0.01 |
17 |
|
Smc2.lst.25 |
29 |
6.58 |
<0.01 |
0.01 |
<0.01 |
15 |
|
Smc1.min.25 |
30 |
5.73 |
<0.01 |
0.02 |
<0.01 |
15 |
|
Sk2.mean |
33 |
4.51 |
<0.01 |
0.02 |
0.01 |
15 |
|
Sm.min.25 |
36 |
6.41 |
<0.01 |
0.02 |
0.01 |
14 |
|
s.sl.lst.05 |
45 |
4.71 |
<0.01 |
0.02 |
0.02 |
13 |
|
b.sl.max.05 |
49 |
6.37 |
<0.01 |
0.01 |
<0.01 |
12 |
|
Snb2.mean |
60 |
3.53 |
<0.01 |
0.02 |
0.01 |
12 |
|
Sal.min.05 |
73 |
5.85 |
<0.01 |
0.01 |
<0.01 |
10 |
|
Sku.lst.25 |
83 |
3.42 |
<0.01 |
0.01 |
<0.01 |
9 |
|
Sk1.mean |
92 |
4.72 |
<0.01 |
0.03 |
0.02 |
9 |
|
r.sl |
99 |
4.88 |
<0.01 |
0.01 |
<0.01 |
7 |
|
Stri |
101 |
4.89 |
<0.01 |
0.01 |
<0.01 |
7 |
|
Ssk.fst.05 |
103 |
4.08 |
<0.01 |
0.02 |
0.01 |
7 |
|
Snb1.sd |
149 |
3.30 |
<0.01 |
0.02 |
0.01 |
4 |
All variables Box-Cox transformed. For each parameter (e.g., Sh), only the variable with the best positioning was selected (e.g., Sh.lst.05). Highlighted in grey are the best-positioned variables which are little correlated to each other (threshold: 0.7).
Table 6 - Case study C: Comparison with extant species to infer the diet of extinct ruminants, the most discriminant variables for each parameter, classified by the number of pair (N) that shows significant differences with the Tukey’s HSD p-value.
|
p value |
||||||
|
Variable |
rank |
F |
ANOVA |
HSD arithmetic mean |
HSD geometric mean |
N (among 6 pairs) |
|
Rmax.min.25 |
1 |
7.93 |
<0.01 |
0.02 |
0.01 |
4 |
|
Snb1.sd |
2 |
9.19 |
<0.01 |
0.01 |
<0.01 |
3 |
|
Sku.lst.25 |
12 |
6.38 |
<0.01 |
0.01 |
<0.01 |
2 |
|
Sk1.sd |
13 |
4.38 |
0.01 |
0.01 |
0.01 |
2 |
|
Ssk.max.05 |
14 |
5.08 |
<0.01 |
0.02 |
0.01 |
2 |
|
b.sl.min.25 |
21 |
5.10 |
<0.01 |
0.02 |
0.01 |
2 |
|
Sm.fst.25 |
27 |
3.65 |
0.02 |
0.03 |
0.02 |
2 |
|
s.sl.mean |
30 |
5.49 |
<0.01 |
0.03 |
0.03 |
2 |
|
Smd.min.05 |
32 |
3.36 |
0.03 |
0.03 |
0.03 |
2 |
|
Smc1.sd |
36 |
4.27 |
0.01 |
0.03 |
0.03 |
2 |
|
Snb2.sd |
49 |
5.22 |
<0.01 |
<0.01 |
<0.01 |
1 |
|
Sal |
55 |
4.26 |
0.01 |
0.02 |
0.02 |
1 |
|
r.sl |
63 |
3.00 |
0.04 |
0.03 |
0.03 |
1 |
|
Sa.lst.25 |
70 |
3.45 |
0.02 |
0.04 |
0.04 |
1 |
|
Stri |
72 |
2.27 |
0.09 |
0.04 |
0.04 |
1 |
All data log-transformed (base 10). For each parameter (e.g., Rmax), only the variable with the best positioning was selected (e.g., Rmax.min.25). Highlighted in grey are the best positioned variables which are little correlated to each others (threshold: 0.7).
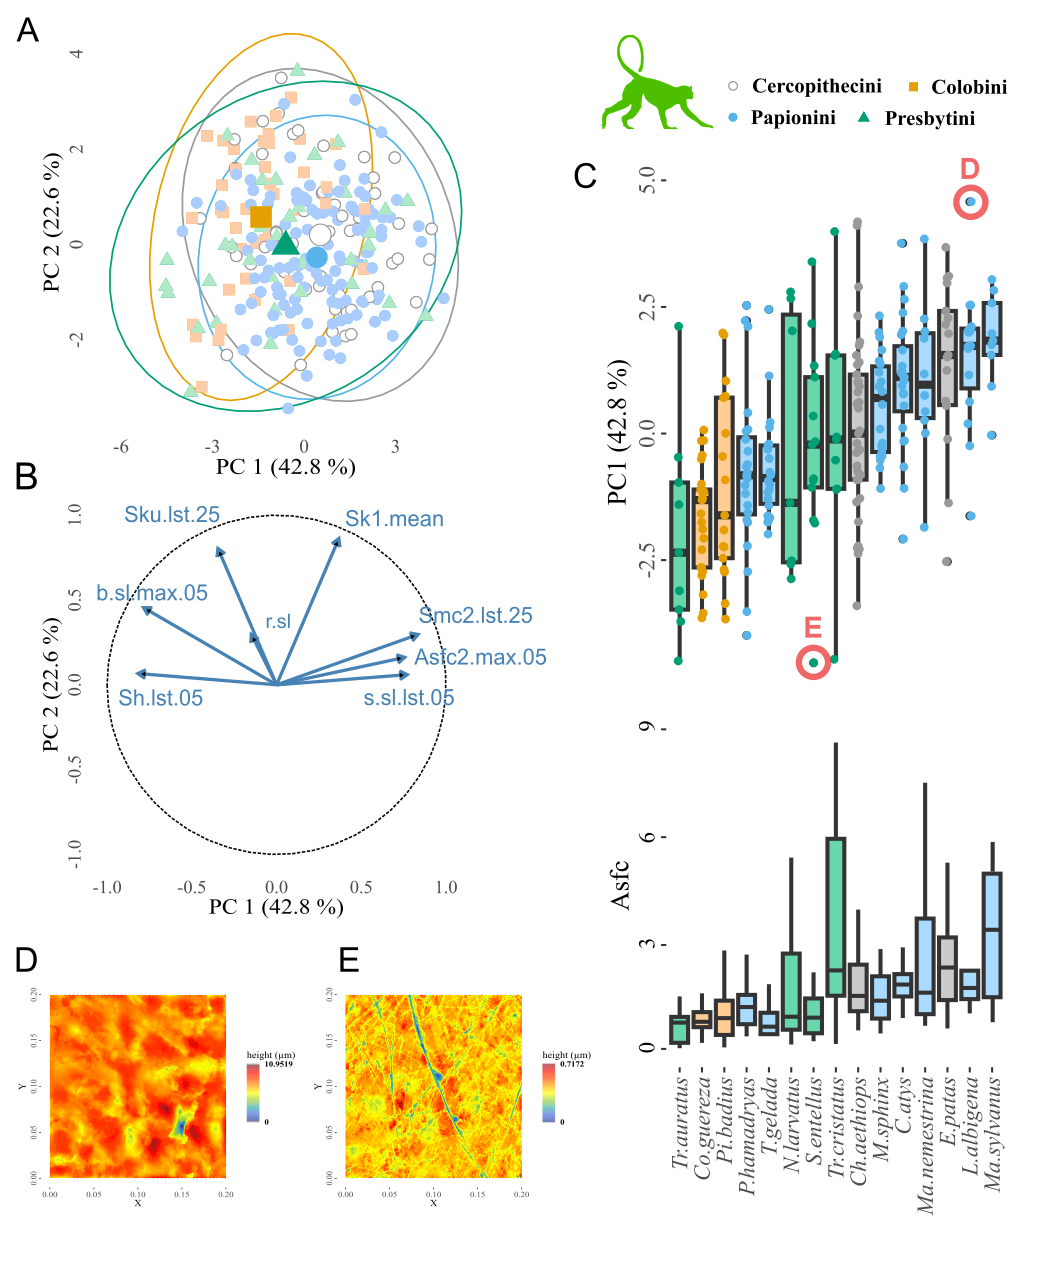
Figure 4 - Case study B: Meta-analysis of a large multi-species sample of cercopithecids. Analysis of dental microwear textures from the crushing facets of upper and lower molars of cercopithecids from Asia and Africa. Principal component analysis was performed using the best-ranked non-correlated variables. A, bivariate graph of individuals along PC1 versus PC2 with ellipses depicting the confidence interval at 95 %; B, correlation circle, PC1 versus PC2; C, Boxplot of PC1 values, ordered by ascending mean, with species as a factor compared with boxplots of Asfc values (individuals are not shown to make the figure easier to read; D, height map of the surface from the individual with the highest PC1 value (L. albigena_NHMB-LP-2908); E, height map of the surface from the individual with the lowest PC1 value (S. entellus_BM30-11-1-4).
The first two components of the PCA encompass 43.9 % and 27.6 % of the variance, respectively. On the first component, we found that G. torticornis significantly differed from both C. capreolus and C. elaphus (Table 7). In contrast, there was no significant difference between G. torticornis, R. rupicapra and O. gmelini, which is visible on the bivariate graph and on the boxplot (Fig. 5C, D).
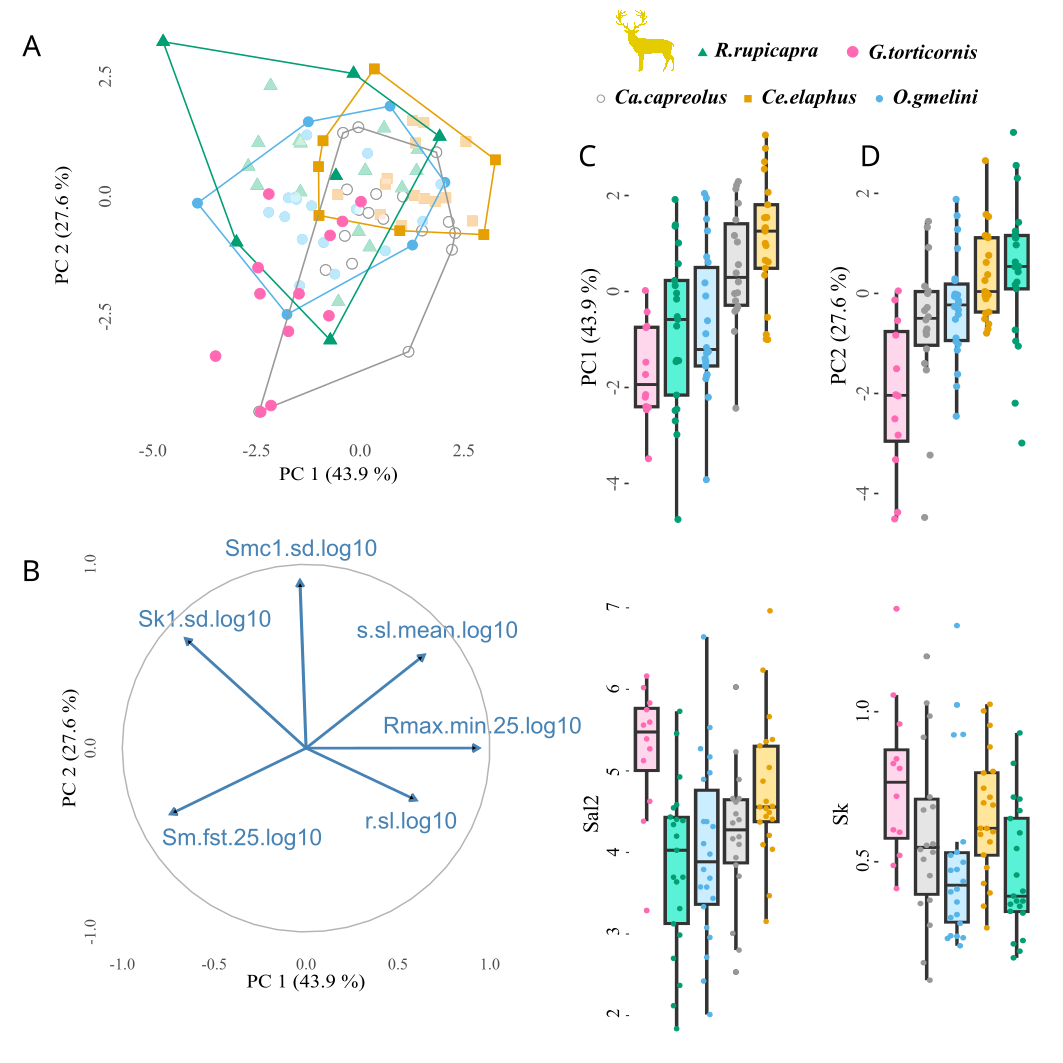
Figure 5 - Case study C: Comparison with extant species to infer the diet of extinct species of ruminants, PCA on selected variables with ruminants from the Bauges as individuals and fossil specimens of Gazellospira torticornis as supplementary individuals. A, Bivariate graph of individuals along PC1 versus PC2, with the extinct species from Dafnero Gazellospira torticornis as supplementary individuals (pink); B, Correlation circle, PC1 versus PC2; C, Boxplot of PC1 values, ordered by ascending mean, with species as a factor in comparison with texture spatial parameters (Sal2; Sal calculated with s = 0.5) ; D, Boxplot of PC2 values, ordered by ascending mean, with species as a factor in comparison with the Sk parameter related to vertical material distribution. All data log-transformed (base 10).
On the second component as well on the third and fourth components, G. torticornis was significantly different from all extant species whereas no difference could be detected between extant species. Overall, G. torticornis had on average lower values than extant species for both the first and second components (Fig. 5D, E).
Table 7 - Case study C: Comparison between extant and extinct species to infer the diet of the extinct ruminants thanks to ANOVA on the first four principal components and followed by pairwise comparison of the means using Tukey’s HSD.
|
PC1 (43.9 %) |
PC2 (27.6 %) |
PC3 (14.6 %) |
PC4 (7.9 %) |
|||||
|
Pair |
Difference |
p adjusted |
Difference |
p adjusted |
Difference |
p adjusted |
Difference |
p adjusted |
|
CE-CC |
0.61 |
0.66 |
1.02 |
0.10 |
-0.01 |
1.00 |
0.15 |
0.97 |
|
OG-CC |
-1.14 |
0.09 |
0.39 |
0.87 |
-0.40 |
0.64 |
0.06 |
1.00 |
|
RR-CC |
-1.31 |
0.04 |
1.12 |
0.06 |
0.28 |
0.87 |
0.15 |
0.96 |
|
OG-CE |
-1.75 |
<0.01 |
-0.63 |
0.50 |
-0.39 |
0.63 |
-0.09 |
0.99 |
|
RR-CE |
-1.92 |
<0.01 |
0.10 |
1.00 |
0.29 |
0.84 |
0.00 |
1.00 |
|
RR-OG |
-0.17 |
0.99 |
0.73 |
0.34 |
0.68 |
0.11 |
0.09 |
0.99 |
|
GT-CC |
-2.17 |
<0.01 |
-1.39 |
0.03 |
-1.54 |
<0.01 |
-1.97 |
<0.01 |
|
GT-CE |
-2.78 |
<0.01 |
-2.41 |
<0.01 |
-1.53 |
<0.01 |
-2.12 |
<0.01 |
|
GT-OG |
1.03 |
0.25 |
1.79 |
<0.01 |
1.14 |
0.01 |
2.03 |
<0.01 |
|
GT-RR |
0.86 |
0.44 |
2.52 |
<0.01 |
1.82 |
<0.01 |
2.12 |
<0.01 |
Highlighted in grey are the differences supported by a significant adjusted p value. CE, Cervus elaphus; CC, Capreolus capreolus; GT, Gazellospira torticornis; OG, Ovis gmelini; RR, Rupicapra rupicapra.
Discussion
Case study A: Diet-related differences in dental microwear between controlled-fed pigs
The broad spectrum of analytic tools and exploratory methods offered by trident maximizes the potential for detecting diet-related differences in dental microwear. In case study A, the four groups could be separated, which is consistent with Louail et al. (2021), but the difference between categories was enhanced. Dental microwear sometimes shows large within-species differences, including in wild animals (Calandra & Merceron, 2016, Percher et al., 2018) and extinct species (Scott et al., 2005; Thiery et al., 2021). In our case study however, even the subtlest variations in diet, for instance between the corn silage and the control groups, could be detected. These results are promising for paleontological and archaeological studies interested in diet variation across time and space.
In addition, trident is also compatible with other workflows, as it can easily combine multiple datasets, for instance microwear measured using different methods (SSFA, light microscopy…), from different teeth, or different parts of a tooth – as in case study A. In this case study, we found that shearing and crushing facets not only differ in microwear textures but also in the best-ranked variables diet-wise. Crushing different kinds of food influenced the skewness and heterogeneity of microwear height, whereas shearing different kinds of foods had a more visible influence on height kurtosis, on standard deviation of height skewness, on median height, as well as skewness and kurtosis of spatial parameters. For crushing, the presence of large and deep pits resulting from the processing of hard, seed-like foods is indeed expected to affect height and its heterogeneity. For shearing on the other hand, spatial parameters, and especially anisotropy, are expected to be more affected by the long shearing motions of tough, high-energy release rate foods such as leaves, grass etc. This is consistent with our results, and demonstrates that trident can not only integrate multiple methods, but also leverage their input.
Case study B: Meta-analysis of a large multi-species sample of cercopithecids
Sometimes the objective is not to separate groups of individuals but to identify patterns of variation imputable to dietary trends. This is exactly what trident enabled in case study B: despite PC1 values overlapping between cercopithecid species, we can distinguish a continuum from strict leaf consumption to staple seed predation (Fig. 4). The most folivorous species (Trachypithecus auratus, Colobus guereza and Piliocolobus badius) have the lowest PC1 values, whereas opportunistic terrestrial cercopithecines and papionines show higher PC1 values, with the highest values found in Lophocebus albigena and Macaca sylvanus, two notable seed eaters (Lambert et al., 2004; Kato et al., 2014). Detecting this pattern required trident for ranking variables by mean p-value of Tukey’s HSD and for performing multivariate analysis on the best non-correlated variables, but also the R environment for ordering species-related boxplots by ascending mean (Fig. 4C). It shows the interest of nesting trident within the R environment: accessing a broad range of libraries for complementing and leveraging functions from the R package trident.
The trident package in R (but not the graphic interface) also allows to inspect surfaces using 2D and 3D maps – although these functions are not implemented into the interface, they can be launched from R (see Supplementary Materials 2). Here, the highest PC1 values are characterized by high maximal complexity, but also deeply worn surfaces (Fig. 4D). In contrast, the lowest PC1 values are characterized by a low complexity and shallow wear marks (Fig. 4E). Both a higher complexity (Ramdarshan et al., 2016) and larger, deeper pits (Teaford, 1985, 1988) have been associated to the ingestion of large amounts of seed kernels, which is consistent with the pattern observed on Fig. 4C. It is also consistent with Asfc2 successfully separating seed-eating cercopithecids in previous studies (e.g., Thiery et al., 2021). In short, trident helps detect patterns in dental microwear textures, but it also and foremost helps interpret them in biomechanical or ecological terms.
Case study C: Comparison with extant species to infer the diet of extinct ruminants
The last key use of trident is the inference of diet, either in extant or in extinct species. In case study C, we could infer the diet of Gazellospira torticornis, an extinct antelope from the Early Pleistocene of Greece (Hermier et al., 2020). To do so, we used trident to perform a PCA on the best ranked, non-correlated variables regarding their ability to separate four ruminants from the Bauges Natural Regional Park with known differences in diet, ranging from selective browsing to grass-dominated mixed feeding habits. We then added G. torticornis specimens as supplementary individuals to the PCA. This analysis showed that G. torticornis had low values of anisotropy, especially the 1st quartile (Rmax.min.25, Fig. 5), which is similar to Ovis gmelini and Rupicapra rupicapra. Both are mixed-feeding species: O. gmelini musimon eats grasses in complement with dicots foliages, shrubs and herbaceous dicots (Redjadj et al. 2014; see also Marchand et al., 2013), while R. rupicapra alternates between grass and foliage depending on seasons (Redjadj et al. 2014; see also Peréz-Barberia et al., 1997). G. torticornis likely was a mixed feeding species, incorporating both grasses and lignified tissues in its diet.
Once again, nesting trident in the R environment gives access to a broad range of methods for complementary analysis. To better understand the dietary behavior of G. torticornis, we performed an ANOVA on principal components to search for differences between extinct and extant taxa. For PC1, G. torticornis significantly differed from Cervus elaphus and Capreolus capreolus. C. elaphus is also a mixed-feeding species (Gebert & Verheyden-Tixier, 2001), but in the Bauges Natural Regional Park, its diet comprises a large proportion of grasses (Merceron et al., 2021a). This likely increased its dental microwear anisotropy, which explains why it differs from other mixed-feeders that include more lignified tissues than the red deer. C. capreolus on the other hand is a selective browser (Redjadj et al., 2014).
Lastly, variables that contribute to PC2 (Smc1.sd and to some extent, Sk1.sd and s.sl.mean) were significantly lower in G. torticornis compared to all four extant species. This point illustrates how dental microwear textures can present original patterns in the fossil record, sometimes completely different to what is known for extant species – perhaps reflecting how different the environmental conditions were at the time.
Conclusion
trident, an R package for performing dental microwear texture analysis is proposed here and illustrated with three case studies, showing how trident helps answer questions concerning trophic ecology commonly investigated by paleontologists and archaeologists. In the first case study, we separate four groups of domestic pigs based on their dietary composition. In the second case study, we identify microwear texture patterns in a large database of 15 primate species and relate these patterns to biomechanical and ecological factors. The third case study investigates the dental microwear textures of four extant ruminants to infer the diet of an extinct antelope from the Pleistocene of Greece. These case studies show how trident can leverage dental microwear texture analysis results.
Acknowledgments
We thank all the people, and especially Antoine Souron and Franck Guy, who improved trident during its development. Our gratitude also goes towards the colleagues who allowed or participated in data collection for the three case studies, notably Jérôme Surault (Laboratoire Palevoprim). Finally, we thank the reviewers and the recommander for their constructive comments and suggestions. Preprint version 4 has been peer reviewed and recommended by PCI Paleontology (http://doi.org/10.24072/pci.paleo.100256; Jarochowska, 2024).
Funding
This study was funded by the French National Agency for Research (ANR-13-JSV7-0008-01 Trident, PI: Gildas Merceron; ANR-17-CE27-0002-02 DIET-Scratches, PIs: Gildas Merceron, Stéphane Ferchaud) and the Région Nouvelle Aquitaine (ALIHOM #210389; PI: Gildas Merceron).
Authors’ contributions
AF, NB, and GM conceived the ideas and designed the methodology; GM, EB, CB, ML, and AW collected the data; AF, GM, ML, and GT developed the software; AF and GT coded the software; ML, GM and GT analyzed the data; GM acquired funding and managed the project administration. All authors contributed critically to the drafts and gave final approval for publication.
Data, script, code and supplementary information availability
Supplementary informations are accessible here : https://hal.science/hal-04222508 (Thiery et al., 2024).
The source package is available on Github at https://github.com/nialsiG/trident and on Zenodo (https://doi.org/10.5281/zenodo.8402605; Thiery et al., 2023).
Dental Microwear Textures are available in the repository InDores. All raw scans of surfaces (plu ou plux files), the template used to pre-treat raw data (mnt files), as well as the surfaces (.sur files) used with trident are provided here:
Case A: Pig experiment:
Case B: Extant species of Cercopithecids
Case C: Extant species of ruminants from the Bauges, Alps, France
Case C: Fossil specimens of Gazellospira torticornis
Conflict of interest disclosure
The authors of this article declare that they have no financial conflict of interest with the content of this article.