
 CC-BY 4.0
Introduction
Climate change and global population growth are leading agriculture to evolve and adapt towards more sustainable systems while ensuring health and welfare, and global food security. Europe is promoting agroecology as a key concept to transform our agricultural and food system. Despite the high interest of this transition, the animal will be faced with more environmental variations, and animal welfare could potentially be impacted. Accordingly, there is a growing societal demand to ensure the welfare of livestock animals. A further issue is that as farms grow in terms of number of animals and production, it is more difficult for farmers to care for each individual. Moreover, in these intensification conditions, welfare assessment represents a complex challenge given the focus of current welfare evaluation protocols on the herd or on the farming system rather than individual assessment (Winckler, 2019). Animal behaviour measures are key to assessing animal welfare (Berckmans, 2014; Buller et al., 2020). For example, González et al. (2008) showed that feeding behaviour can be used as an early sign in the detection of sick cows. Feeding behaviour in calves has been used to detect gastrointestinal infections before the appearance of clinical signs (Svensson and Jensen, 2007). Similarly, a change in the pattern of drinking in pigs can be associated with a diarrhoea outbreak (Madsen and Kristensen, 2005). Thereby, behavioural information can provide a valuable indication of the physiological state of animals (Frost et al., 1997, Hansen, 2015) and can be used as an early sign of variation in animal welfare. Indeed, behavioural assessment plays a crucial role for farmers in evaluating the health and well-being of their livestock but it is not feasible for all the animals and over extended periods (Müller & Schrader, 2003).
Advancements in technology, particularly Precision Livestock Farming (PLF) technologies, have paved the way for transformative changes in how we approach animal behaviour assessment (Berckmans, 2014; Vogt, 2019). Real-time and near-time tracking technologies have unlocked the potential for collecting a diverse range of data over extended periods, encompassing not only production metrics and physiological states but also behavioural insights (Bailey et al., 2021). These advancements significantly empower livestock productivity and welfare enhancement, according to Bailey et al. (2021).
Multiple sensors have been developed to monitor animal behaviour and the 3-axis accelerometer has quickly become popular to assess behavioural states in various animal species. These sensors measure changes in an object’s acceleration on the three axes (x-, y- and z-axis). As a result, combined with Artificial Intelligence (AI), commercial devices are developed to quantify livestock behaviour, especially for species with economic interest (Borchers et al., 2016; Pereira et al., 2018) such as cattle, with CowManager (Agis, Harmelen, the Netherlands) detecting eating behaviour and rumination, the HOBO Data Logger (HOBO Pendant G Acceleration Data Logger, Onset Computer Corporation, Pocasset, MA), the AfiAct Pedometer Plus (Afimilk, Kibbutz Afikim, Israel) and the Track A Cow (ENGS, Rosh Pina, Israel) to monitor lying time, the CowAlert IceQube (IceRobotics Ltd., Edinburgh, Scotland) to quantify lying time and detect lameness (Thorup et al., 2015), and the Smartbow (Smartbow GmbH, Jutogasse, Austria) to monitor rumination time and to detect oestrus (Schweinzer et al., 2019). Most of these systems are used in the context of health alteration, for example detection of disease, or of behaviours that could impact animal health and performance. Since the reliability of these systems is not always reported, it is not possible to adapt them to other species such as small ruminants. Those limitations suggest that further research is needed to adapt existing algorithms to a wide range of behaviours on small ruminants based on accelerometer data.
Riaboff et al. (2022) described the three-step methodology commonly used in the literature for predicting ruminant behaviour from accelerometer data. These are data collection, data pre-processing that prepares the data for input in the behavioural classification model, and the development of the behavioural classification model. Numerous studies have compared various processing techniques and model development strategies, such as the best features to use (Smith et al. 2016; Kamminga et al., 2018; Riaboff et al., 2019), the Machine Learning (ML) algorithms (López et al., 2013; Smith et al. 2016; Kamminga et al., 2018; Sakai et al., 2019), the signal filtering techniques (Riaboff et al., 2019) and the time-windows size (Smith et al. 2016; Riaboff et al., 2019). To date, no established methodology systematically searches for the best features and processing techniques to predict each targeted behaviour accurately from raw accelerometer data. The main objective of this study was to use a pipeline, called ACT4Behav (Accelerometer-based Classification Tool for identifying Behaviours), that integrates a comprehensive exploration of each data processing step to determine the best-fitted model for each behaviour, applied here to raw accelerometer data to characterise certain goat behaviours. To do so, a “sensitivity analysis” was used to evaluate the impact of variations of key factors at the data pre-processing step. These factors were filtering techniques, time windows sizes, inclusion of additional time series data, data transformation methods, and variations in feature selection. The performance score, which assesses the quality of behaviour predictions, served as an indicator of the model’s reliability within the same experimental context. In this work, the main performance score was the AUC (Area Under the Curve) score. Accuracy, balanced accuracy, F1-score, sensitivity and specificity were also calculated. Moreover, in this study, detection of behaviours in goats that were not part of model’s training dataset was also tested to reflect the ability of the model to generalise detection of behaviours on data from new goats. The model was trained with a dataset of six goats and its performance was tested on the two remaining goats.
Methods
Animals
Data collection was carried out in the experimental goat unit of INRAE in Thiverval-Grignon, France in March 2022. Eight indoor-housed dairy Alpine goats were equipped with MSR145 3D-accelerometer (TH Industrie) sensors that can measure accelerations in the positive and negative directions, with a maximum magnitude of 15 g. The animals were 14-month-old lactating primiparous goats. Body weight (BW), milk yield and body condition score (BCS) data at the start of the experiment are presented in Table 1. The goats were normally group-housed in a straw bedded area but for the purpose of having reference measures of feeding behaviour, they were group-housed in the same slatted-floor pen of 8 animals for 24 days with continuous access to feed and water. Each goat had its own feed trough that was released via the electronic ear-tag when the goat allocated to the trough placed its head next to the antenna. This work was carried out under licence (Apafis number #24314-2019120915403741 v5).
Table 1 - Body weight, milk yield and body condition score data of the eight goats at the start of the experiment.
|
Goat ID1 |
BW (kg) |
Milk yield (kg/day) |
BCS2 |
|---|---|---|---|
|
21038 |
38.8 |
2.66 |
2.63 |
|
21055 |
48.9 |
3.84 |
3.00 |
|
21066 |
60.7 |
3.73 |
3.38 |
|
21083 |
47.5 |
3.64 |
2.63 |
|
21091 |
44.4 |
3.54 |
2.63 |
|
21101 |
45.5 |
3.06 |
2.88 |
|
21118 |
46.0 |
3.89 |
2.63 |
|
21119 |
46.8 |
2.68 |
2.63 |
1 Goat IDs correspond to those reported in the related data paper (Mauny et al., 2025a).
2 Calculated as the average of the sternal and lumbar BCS.
Acceleration data collection
Goats were equipped with accelerometers attached to the RFID ear tag of the animal (Figure 1). The accelerometers were 27 × 16 × 53 mm in size and weighed approximately 20 g. The accelerometers were powered with a 230 mAh lithium-polymer battery and were programmed to record the acceleration on the x-y-z-axis at a frequency of 5 Hz. Data from eight animals was collected for 24 consecutive hours.
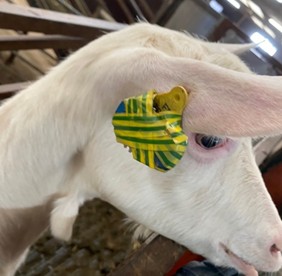
Figure 1 - A goat with an accelerometer fixed with tape to the right RFID ear tag in lateral view.
Behavioural observation
Video recordings were made using cameras, one placed above every pen to provide visual information on the goat behaviour (Figure 2). The time of the video recording system was synchronised to the same time as the accelerometers by manually and vigorously agitating the accelerometers in front of the cameras. The shake pattern was set as a reference time to match the video recordings to the accelerometer data. During the observation process, each animal was uniquely marked with a number on its back using animal spray paint. This numbering system allowed the observer to track and differentiate the goats throughout the observation. The videos were labelled by a single trained observer using The Observer® XT software version 16.0 (Noldus Information Technology, 2022), using a pre-established ethogram. The ethogram of all the annotated activities is available in Appendix 1.
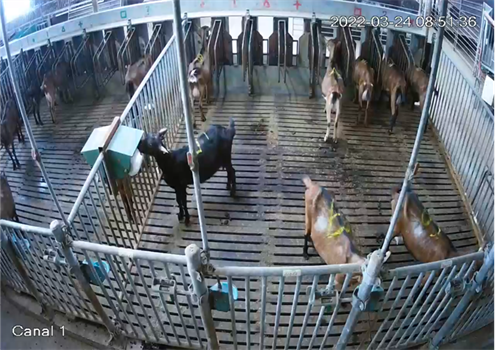
Figure 2 - Screenshot of the video system above the goat pens. Each goat has a number painted on its back with yellow animal spray paint.
The ethogram was designed to describe the goats’ activities within this experimental system. The behaviours were categorised into five distinct groups, ensuring an exhaustive description of all the activities. These categories included (i) feeding behaviour, (ii) social behaviour covering interactions between goats, such as grooming and fighting, (iii) position and movement behaviour describing activities related to the goats’ posture and movement, such as standing, walking, and lying down and (iv) the “other behaviour” category accounted for actions that did not fit into the previous groups. Lastly, the “disturbance” category captured any unexpected or disruptive events that could affect the goats’ behaviour. It is worth to mention that at any given time during the observation period, each goat was expected to exhibit a behaviour from each category. The behaviours « ruminating », « lying », « standing » and « head in the feeder » were selected to develop the classification model because of their large representation in the observation period to maximise available data for model development, and for their relevance regarding welfare and health status of the animals. In this context, it has been shown that general activity levels and time spent feeding are reduced under bad health conditions such as lameness (Thorup et al., 2016), while time spent lying can increase. The recordings were analysed only during the presence of daylight, which was approximatively 11 hours per day for each of the eight goats. Figure 3 shows the cumulative time spent in each behaviour by all the eight goats during 11 hours each.
Raw data, i.e. accelerometer data and corresponding behaviours, is available online (https://doi.org/10.57745/LGZBM1, Mauny et al., 2024a) and described in the related data paper (https://doi.org/10.1016/j.anopes.2025.100095, Mauny et al., 2025a).
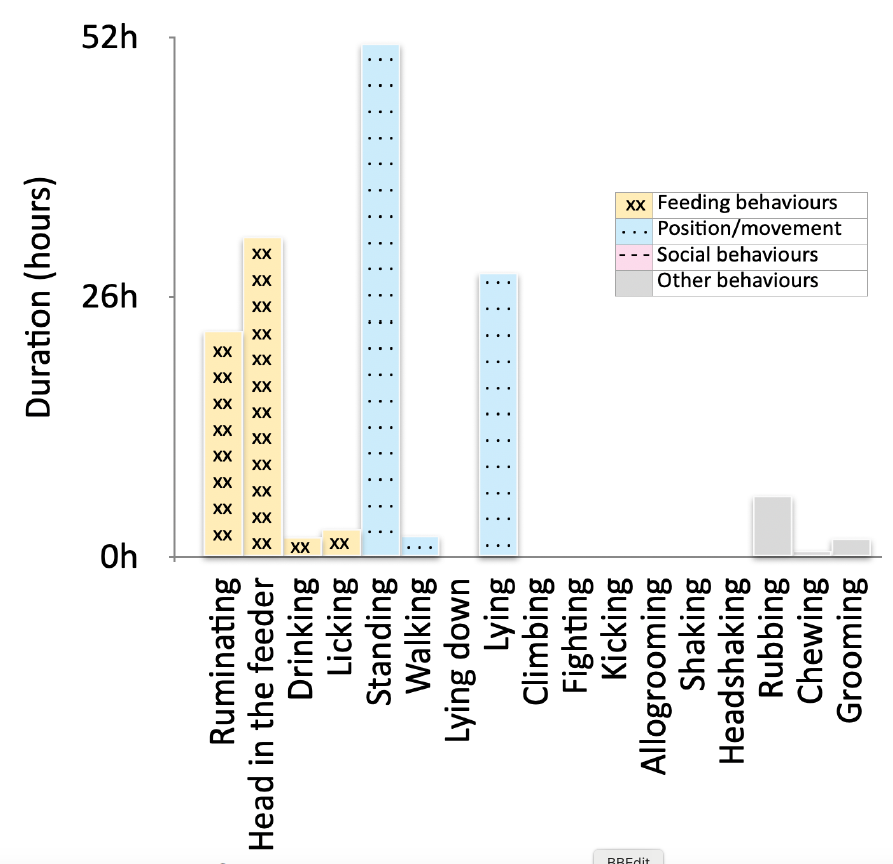
Figure 3 - Total duration of the behaviours on video recordings in eight goats during 11 hours each. The bars of the histogram are colour-coded according to behaviour categories. On the x-axis are the various observed behaviours. On the y-axis, the total cumulative time spent by the eight animals on each behaviour.
Data pre-processing
In this section, the different steps of the pipeline that prepare data for use in the ML algorithm are detailed. The data was pre-processed separately for each behaviour, resulting in four binary classification models, one for each behaviour.
Additional time-series
Additional time-series calculation involved generating supplementary time-series derived from the original accelerometer data (acceleration on the x-axis, on the y-axis and on the z-axis). These additional time series served to enhance the depth of information available by calculating time-series independently from the sensor orientation or time-series related to the two main components of the acceleration. Additional time-series were calculated from the raw or filtered acceleration data.
Norm. The ear placement of the sensors on the identification tag of the animals was made without considering the orientation of the sensors. The ear is quite mobile on the goat, making the sensor highly responsive to any movement of the animal. Consequently, it was proposed to compute the Euclidean norm, referred to as the magnitude of the acceleration, which is an additional time series that is not affected by the orientation of the sensor, e.g. Fida et al., 2015.
\(a_{mag} = \sqrt{{acc}_{x}^{2} + {acc}_{y}^{2} + {acc}_{z}^{2}}\) with \(\ {acc}_{i}\) the acceleration on the \(i\)-axis.
The magnitude of the signal was calculated to account for the variety of sensor orientations.
High-passed Filtered data. To focus on the behaviour of an animal, the dynamic acceleration of the signal can be extracted by subtracting the static acceleration from the raw acceleration (Lush et al., 2018). In the recorded signal, we expect static acceleration to vary slowly and therefore to correspond to low frequencies, which can be eliminated using a high-pass filter, as proposed by Smith et al. (2016). The performance of the model was evaluated and compared with raw accelerometer data and with filtered acceleration data.
Pitch and roll angles. According to Riaboff et al. (2022), pitch and roll angles are useful to predict behaviours that involve different postures and head tilt like putting the head in the feeder, standing or lying.
Rotated acceleration data. To ensure accurate and comparable analysis, a strategy was developed to standardise the orientation of the accelerometer. If we consider that the typical posture of a goat is head straight and upright, then the goal is to align the data so that the vertical axis (0, 0, 1) corresponds to a uniform reference direction. The multivariate median or mean is used as an estimator of the central tendency of the data, considering all three acceleration axes, assuming that most of the time, the goat is in this typical posture, i.e., head straight and upright. Subsequently, a rotation matrix was computed based on the difference between the calculated multivariate median and the desired reference direction (0, 0, 1).
These additional time-series were calculated from the formulas indicated in Table 2. Pitch and roll angles, along with a transformation of the acceleration data, were calculated from each acceleration value and added as new variables to the dataset. The influence on the performance scores of the predictive model for each behaviour when adding these additional time-series was compared to the performance of the model without adding additional time-series (Figure 4). Combining the time-series was also tested.
Table 2 - Additional time-series calculated from the raw or filtered acceleration
|
Time-series |
Formula |
Description |
|---|---|---|
|
Pitch angle |
\(pitch = \arctan(\frac{- {acc}_{x}}{\sqrt{{{acc}_{y}}^{2} + {{acc}_{z}}^{2}}})\) |
Characterises the rotation around the z-axis |
|
Roll angle |
\(roll = \arctan(\frac{{acc}_{y}}{{acc}_{z}})\) |
Characterises the rotation around the x-axis |
|
Rotated acceleration data (mean) |
\(R = rotation_{mean} = \lbrack mean\left( {acc}_{x} \right),\ mean\left( {acc}_{y} \right),\ mean\left( {acc}_{z} \right)\rbrack\) \(R = rotation_{median} = \lbrack median({acc}_{x}),\ median({acc}_{y}),\ median({acc}_{z})\)] \(\lbrack{acc}_{x},{acc}_{y},\ {acc}_{z}\rbrack*R = \lbrack 0,0,1\rbrack\) \({acc}_{rotated} = {acc}_{i}*R^{- 1}\) |
Transformation of the data to standardise the sensor orientation |
|
Rotated acceleration data (median) |
Note:\(\ {acc}_{i}\) is the acceleration on the \(i\)-axis, R is the rotation matrix which is computed based on the mean or the median.
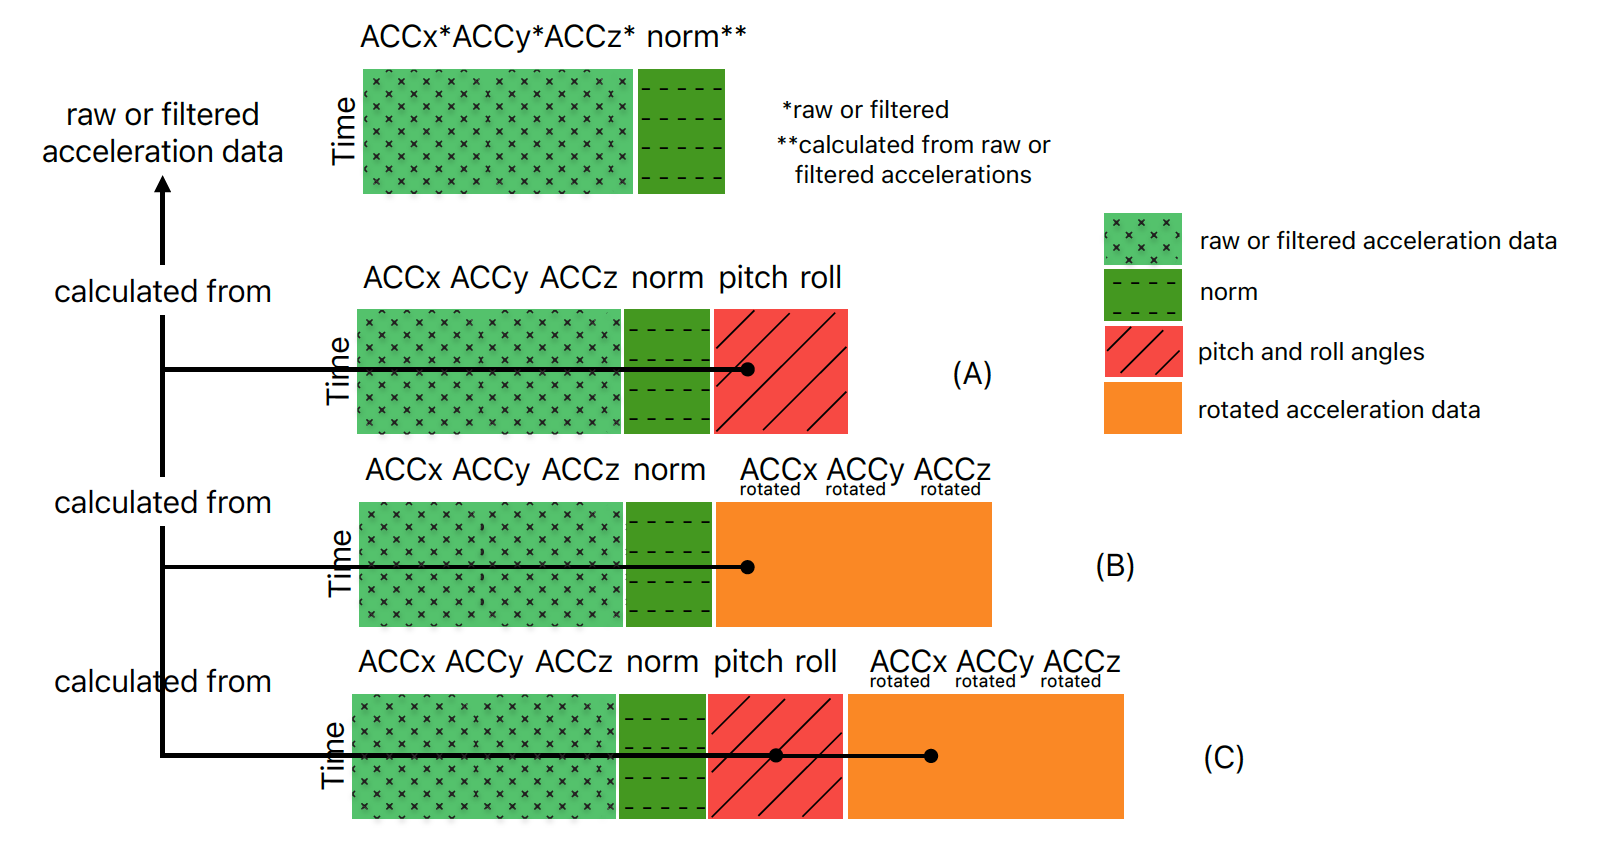
Figure 4 - Overview of the dataset with raw or filtered acceleration data (light green) and the norm (dark green) without additional time-series and overview of the dataset when adding pitch and roll angles (red) as additional time-series (A) or when adding rotated acceleration data (orange) as additional time-series (B) from raw or filtered acceleration data (light green) or combining them (C).
Features extraction and segmentation into time-windows
Predictions were not made on the raw acceleration data: an important pre-processing step is the transformation of the raw accelerometer data into ‘features’, which can be various descriptive quantities and which are statistical variables for the ML models. The calculated features constitute the input of each ML model. To do so and for each animal, the accelerometer time-series data were segmented into time-windows. Each window was the statistical unit of the dataset thereafter and the features were calculated on each time-window. The literature on recognizing human activities via accelerometer data highlights a diversity of possible time-window segmentations (Bersch et al., 2014) such as fixed-size overlapping, or not, sliding window (Pietka, 1988) or variable-size sliding window (Laguna et al., 2011). However, in the context of classifying ruminant behaviours, fixed-size windows are predominantly used, mostly without overlap (Riaboff et al., 2022). In this study, in order to find which size of time-window gives the best performance score for each behaviour, several sizes of time-windows were tested for each behaviour, ranging from 10 seconds to 120 seconds. The prediction of a given behaviour was approached as one binary classification model, where label 1 corresponded to the behaviour happening during more than 50% of the time-window.
In the field of ruminant behaviour prediction, previous studies have relied on a predefined set of features in both the time and frequency domains. In this study, an extensive feature extraction on each time-series of the dataset was chosen to explore features that were never considered in previous studies. This was followed by a feature selection based on the importance of each feature during the model development rather than limiting the number of features before the prediction.
A wide range of 777 different features was automatically calculated (Python (version 3.10) package tsfresh (Christ et al., 2018)) on each time-window and on each extracted time-series (Figure 5). The calculated features are descriptive statistics features (mean, median, standard deviation, etc.), temporal characteristics (number of crossings, count above/below thresholds, etc.), value distribution features (percentiles, quantiles, histograms, etc.), spectral domain features (features derived from the frequency domain using Fast Fourier Transform), pattern measures (pattern counting, entropy-based calculations, etc.), signal characteristics (energy-related characteristics), anomaly detection and regression features (autoregressive models coefficients, polynomial fitting coefficients, etc.).
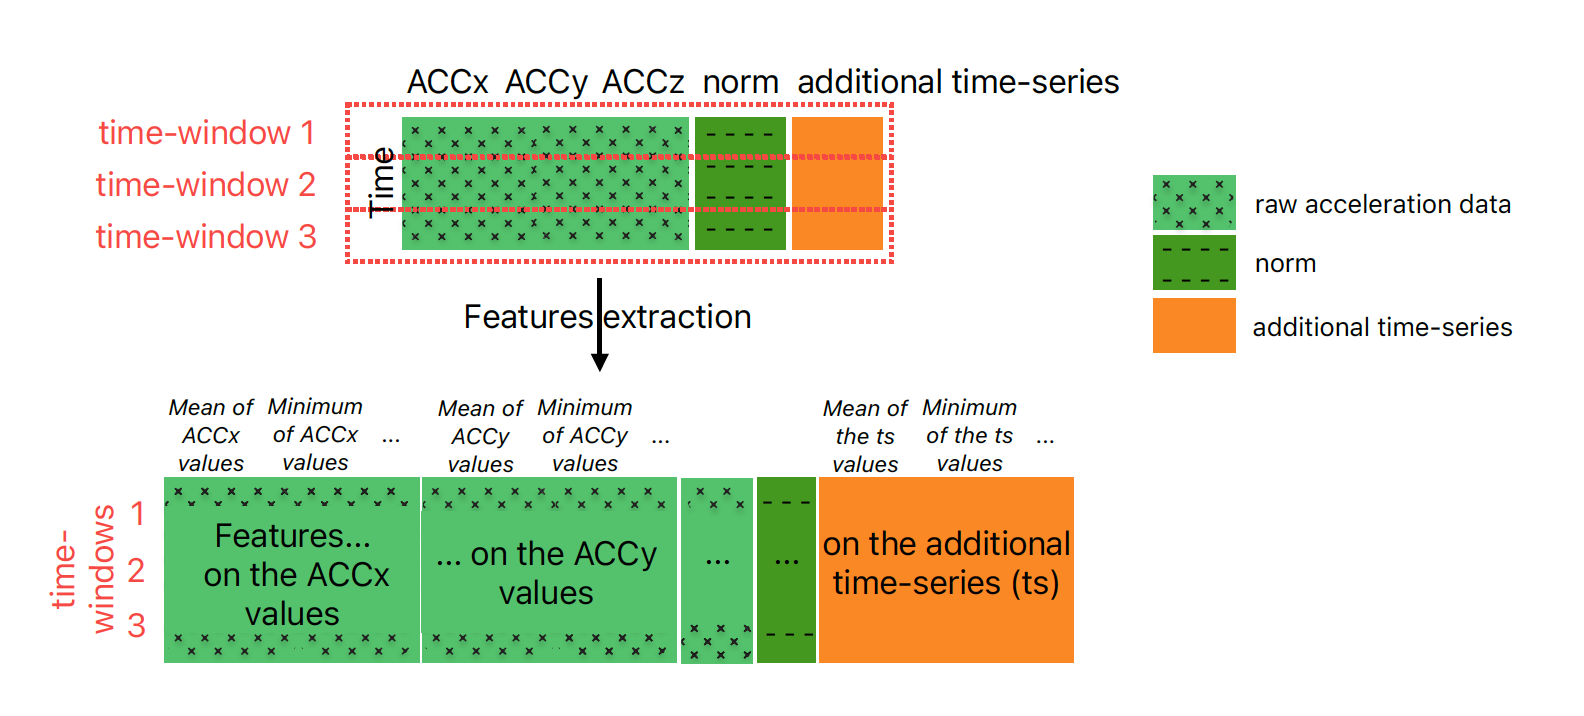
Figure 5 - Overview of the features extraction process of every time-series (ts), i.e. raw acceleration data (light green), norm (dark green) and additional ts (orange), and on each time-window (represented in red dashed lines) of the dataset.
Behaviour classification model
In supervised learning, the ML model is developed by training the algorithm on a labelled dataset called the training set, where each input data point is associated with a corresponding label, i.e. a behaviour. The pre-processed dataset is therefore split into a training set, a validation set, and a test set.
For training, the Catboost algorithm (Prokhorenkova et al., 2019) was used, which is an implementation of the Gradient Boosting algorithm for classification and regression. It is based on the principle of aggregating a large number of decision trees (a flowchart structure where each node represents a decision, each branch the outcome of the decision and each leaf a class in classification tasks) that best predict the training set with constraints to limit overfitting. Those constraints are given by hyperparameters, e.g. the number of leaves, the maximum depth of each decision tree and the minimum number of samples required to be at a leaf node. A thorough hyperparameter tuning was performed using the validation set (“validation set” in Figure 6; “val” set in Figure 7) and based on the highest AUC score obtained.
After training, a model was generated and the validation set (“val”) was used to calculate preliminary performance scores of the model to tune the hyperparameters. Once the model was trained and tuned, the test set (“test set” in Figure 6; “X_test”, “y_test” in Figure 7) was used to evaluate the final performance of the model with unseen data: the model predicts the behaviour from the test set data without having the corresponding labels. Then, the predicted behaviours are compared to the corresponding observed labels to calculate the final performance score.
In this work, two different types of models were developed based on two data split approaches (Figure 6):
-
The dataset was divided based on the time-windows of all goats for sensitivity analysis, meaning that data from all goats was used during the training of the model and predictions were done for the same goats on different periods of time.
After the data pre-processing, time-windows for each goat were computed and 20% of those time-windows were excluded to create the test set, the 80% left was split into a training set (75%) and a validation set (25%).
-
Performance scores were also computed using a goat-based split. In this case, the training was done on data from a group of goats and predictions were made on another group in the same context. Two goats were selected for testing, and the data of the six other goats was used to split the time-windows into training (75%) and validation (25%) sets. A cross-validation technique was employed using four distinct pairs of goats for testing, meaning rotating the pair of goats which was going to be used for the test set. For each pair of goats used for the test set, the performance score of the model was calculated using the AUC score. The mean of the four AUC scores was the final AUC score of the model.
The final performance of the models was evaluated using usual evaluation metrics: AUC score, accuracy, balanced accuracy, sensitivity, specificity and F1-score, calculated on the test set with the formulas presented in Appendix 2.
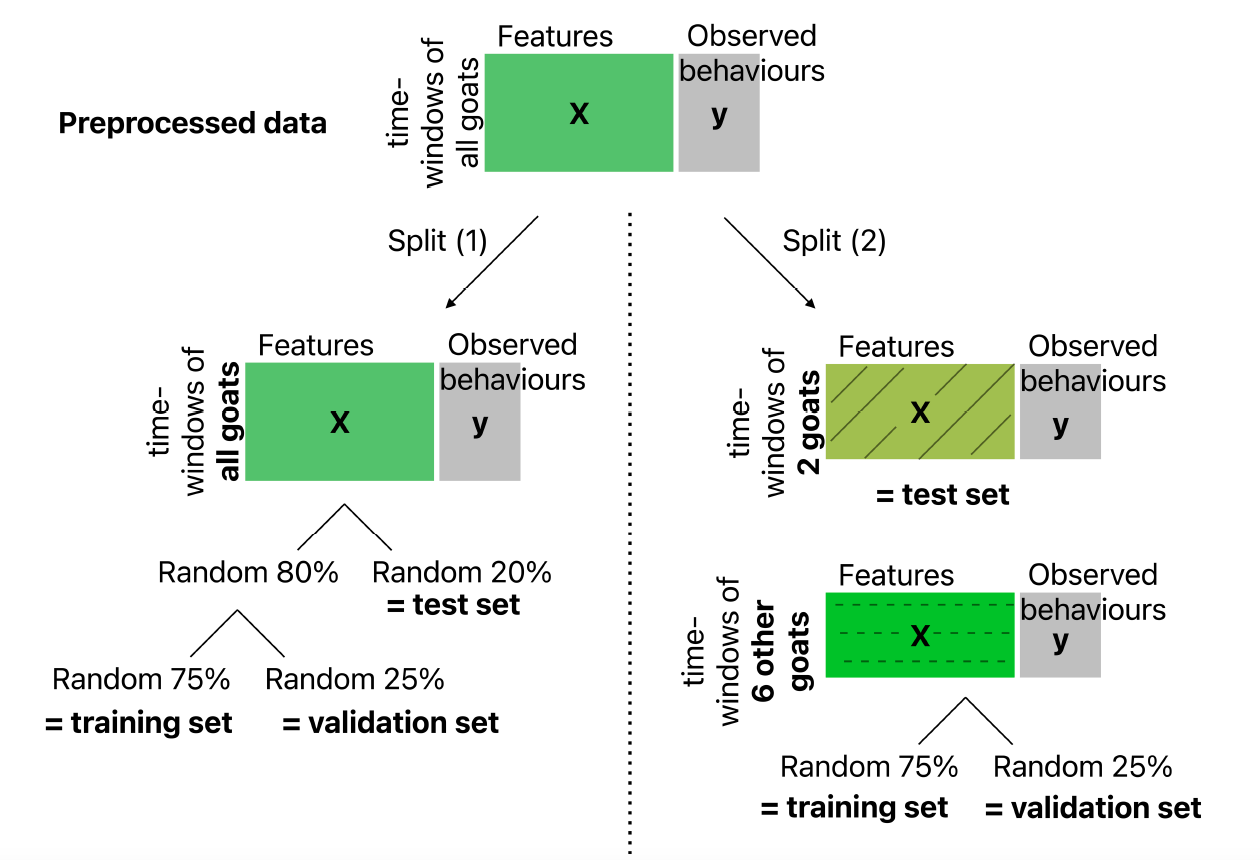
Figure 6 - Dataset splits into training, validation and test sets with a time-windows split approach (1) and a goat-based split approach (2).
Features selection
The features_importances_ function from the scikit-learn package (Pedregosa et al., 2011) was used to evaluate the importance of each feature. It looks at all the decisions made by each tree in the model. It then figures out which features were most helpful on average for making those decisions and calculates a weight, which indicates the impact of that feature on the prediction. The features are then ranked by their weight, allowing us to keep only a limited number of the features with the highest importance. After the features selection, the performance of the models was recalculated with 2000, 1000, 500, 100, 80, 50, 20 and 10 most important features selected with the AUC score.
Without features selection, the models were trained with 777 features multiplied by n (the number of time-series in the dataset). Note that the high dimensionality of the data was not addressed in this work, as Gradient Boosting can handle high-dimensional datasets and train models with thousands of features. But by selecting the most important features, it is possible to improve the performance score of the models by focusing on the most relevant ones, and reduce the preprocessing workload, resulting in smaller data volumes and faster processing times.
Sensitivity analysis
Variations in the choices of each pre-processing step and features selection were tested on the performance score of the models. To do so, the influence of the value of the cutoff frequency of the high pass filter, presence or absence or additional time series, size of the time-windows and the number of the best selected features were studied:
-
Raw acceleration data filtering: cutoff frequencies of 0.05 Hz, 0.01 Hz, 0.1 Hz, 0.2 Hz, 0.3 Hz, 0.4 Hz
-
Additional time-series calculation (combined or not): pitch, roll, rotated acceleration data (mean/median)
-
Size of the time-window: 10, 20, 30, 40, 50, 60, 80, 120 seconds
-
Features selection: no selection, 2000, 1000, 500, 100, 80, 50, 20, 10 best features selected
We used the AUC score as a key performance metric to assess the effectiveness of each pre-processing option. We tested how variations in the pre-processing steps affected the AUC score. It is important to note that while commonly used metrics such as accuracy, sensitivity, specificity and F1 score provide valuable insights into model performance, they are threshold-dependent. When working with binary classification problems, the predicting models gives prediction probabilities in output. To calculate the accuracy for example, a fixed threshold set at 0.5 classifies the prediction probabilities into 0 when lower than 0.5 and 1 when higher than 0.5. Then, it compares the true labels of the samples with the predicted labels and calculates the accuracy. The AUC score measures the area under the Receiver Operating Characteristic (ROC) curve, which plots the True Positive (TP) rate (sensitivity) against the False Positive (FP) rate across various threshold values. Accordingly, the AUC score provides a single measure to evaluate model performances that can be used to determine which model is better on average. A value above 0.70 is considered to be a “strong model”, while a value below 0.60 is considered to be a “weak model” (Kelleher et al., 2020). A value of 1 would mean a perfect classification.
The different steps of model development are represented in Figure 7.

Figure 7 - Flowchart representing the pipeline of the process of raw acceleration data and associated behaviours processing to automatic predictions and sensitivity analysis of the pre-processing steps. The data pre-processing (2.), development of the model (3.) and sensitivity analysis (4.) are described in the corresponding sub-sections of the Methods section.
Results
Sensitivity analysis
The behaviour “ruminating” is used as an illustrative example to present the results in detail. The results of “head in the feeder”, “lying” and “standing” behaviours are presented in Appendices 3, 4 and 5.
For rumination, the best AUC score (0.800) was obtained with a 10 and 20 seconds time window (Table 3), no filtering (Table 4), three additional time-series (median rotated data, pitch and roll series) (Table 5) and a selection of the 100 first-best features (Table 6).
Table 3 - Classification performance for the behaviour “ruminating” using the algorithm with different selected time-window sizes.
|
Time-window sizes (s) |
AUC |
|---|---|
|
10 |
0.800 |
|
20 |
0.800 |
|
30 |
0.792 |
|
40 |
0.790 |
|
50 |
0.773 |
|
60 |
0.746 |
|
80 |
0.795 |
|
120 |
0.782 |
Table 4 - Classification performance for the behaviour “ruminating” using the algorithm with different cut-off frequencies.
|
Cut-off frequencies (Hz) |
AUC |
|---|---|
|
No filtering |
0.800 |
|
0,01 |
0.749 |
|
0,05 |
0.741 |
|
0,1 |
0.734 |
|
0,2 |
0.731 |
|
0,3 |
0.747 |
|
0,4 |
0.762 |
Table 5 - Classification performance for the behaviour “ruminating” using the algorithm with and without additional time-series.
|
Additional time-series |
AUC |
|---|---|
|
None |
0.769 |
|
Euler angles |
0.774 |
|
Rotated acceleration data (mean) |
0.797 |
|
Rotated acceleration data (median) |
0.798 |
|
Rotated acceleration data (mean) + Euler angles |
0.781 |
|
Rotated acceleration data (median) + Euler angles |
0.800 |
Table 6 - Classification performance for the behaviour “ruminating” using the algorithm with features selection.
|
Number of the best features selected |
AUC |
|---|---|
|
6993 (no features selection) |
0.791 |
|
2000 |
0.792 |
|
1000 |
0.796 |
|
500 |
0.799 |
|
100 |
0.800 |
|
80 |
0.799 |
|
50 |
0.792 |
|
20 |
0.797 |
|
10 |
0.764 |
The optimal pre-processing steps and features selection for each behaviour and their scores are presented in Table 7. The pre-processing treatments listed in Table 7 are those who give the best AUC score for each behaviour. Accuracy, balanced accuracy, F1-score, sensitivity, and specificity of each model are also mentioned.
Table 7 - Optimal processing steps for the four chosen behaviours with performance scores.
|
Ruminating |
Head in the feeder |
Lying |
Standing |
|
|---|---|---|---|---|
|
Time-windows size (s) |
20 |
60 |
50 |
60 |
|
Raw acceleration filtering (Hz) |
/ |
/ |
/ |
/ |
|
Additional time-series |
Median + Euler angles |
Mean + Euler angles |
Mean + Euler angles |
Euler angles |
|
Features selection |
100 best features |
80 best features |
80 best features |
80 best features |
|
AUC score |
0.800 |
0.819 |
0.829 |
0.823 |
|
Accuracy (%) |
78.7 |
73.7 |
78.1 |
74.6 |
|
Balanced accuracy (%) |
70.6 |
73.8 |
76.5 |
70.3 |
|
F1-score (%) |
56.3 |
67.7 |
70.6 |
81.5 |
|
Sensitivity (%) |
54.2 |
74.3 |
69.8 |
95.4 |
|
Specificity (%) |
58.6 |
62.2 |
71.3 |
71.2 |
The highest AUC score was obtained with 20 seconds time-windows for “ruminating”, 60 seconds for “head in the feeder” and for “standing”, and 50 seconds for “lying”. The acceleration data filtering did not improve the AUC score of the four behaviours. The Euler angles improved the AUC scores of the four behaviours. The rotated acceleration data improved the AUC scores of “ruminating”, “head in the feeder” and “lying” behaviours. For “head in the feeder”, “lying” and “standing” behaviours, the 80 best features were sufficient to achieve the best predictive AUC score while the 100 best features were necessary for “ruminating”.
Feature importance
The most important feature of each model for the prediction of the behaviour is the sum of reoccurring values calculated on the rotated ACCx (acceleration on the x-axis) for “rumination”. The sum of reoccurring values identifies values that recur within the dataset, like a pattern.
The permutation entropy calculated on the rotated ACCz (acceleration on the z-axis) is the most important feature for “head in the feeder” and the permutation entropy calculated on the norm is the most important feature for “lying”. Permutation entropy is a measure of the complexity or unpredictability of a time series. This feature belongs to the pattern measures category as it quantifies the amount of randomness in the sequence of observations.
The complexity estimate based on the Lempel-Ziv compression algorithm calculated on ACCz is the most important feature for “standing”. It converts the acceleration values of each time-window into binary values and measures the repetitiveness of binary sequences to detect a repetitive pattern.
Behaviour prediction with goat-based split approach
A decrease in the AUC scores for the four behaviours was observed when training each model with a goat-based split approach (Table 8). The most important decrease was obtained for “rumination” (-19.5%), dropping from 0.800 to 0.644. “Head in the feeder” and “lying” decreased by 10.5% and 10.6% respectively and standing by -9.0%.
Table 8 - Performance score of the four behaviours with a goat-based split approach and cross-validation.
|
Rumination |
Head in the feeder |
Lying |
Standing |
|
|---|---|---|---|---|
|
AUC score with a goat-split approach |
0.644 |
0.733 |
0.741 |
0.749 |
|
AUC score with a time-window-split approach |
0.800 |
0.819 |
0.829 |
0.823 |
|
Percentage change |
-19.5% |
-10.5% |
-10.6% |
-9.0% |
Discussion
This paper describes a supervised classification algorithm for automatically characterising four goat behaviours using accelerometer data. These behaviours were well represented in the dataset and are often well predicted in the literature in small ruminants like sheep with accuracies above 90% and/or f1-scores above 75% for standing and lying (Mansbridge et al., 2018; Walton et al., 2018; Hu et al., 2020) and ruminating (Hu et al., 2020; Decandia et al., 2021). Transitional behaviours or rare behaviours were observed but their short duration and low frequencies of occurrence made them impossible for supervised learning models to predict in the present dataset. Moreover, applying the presented pipeline in similar contexts during different periods or in different farms could be useful to detect similarities in the key factors for predicting certain behaviours. For instance, the present experiment was carried out on slatted-floor (commonly used in feeding trials) but other housing environments exist such as straw-bedded floor. The four behaviours could be expressed with a different acceleration pattern on straw and other behaviours might have been restrained on slatted-floor. This highlights the importance of the farm context that can influence animal behaviour.
The use of a goat-based split approach allows for evaluating the robustness of the model (Rahman et al., 2018). When training was done using different animals, a decrease in the AUC score was observed, particularly for rumination; AUC decreased from 0.800 to 0.644. This indicates a limited generalizability in predicting those behaviours on goats that did not participate in the training, which is the biggest challenge for developing long-term behavioural monitoring systems because the goal is to avoid using behavioural observation. The difficulty lies in the high individual variability of the expressed behaviours, the available training data was not sufficient to train a strong model that can be used on goats that did not participate in the training in this farm context; training and testing and on a small dataset gathered in the same context is not enough to develop strong models. However, our work establishes a practical pipeline to pre-process data and generate models with data collected in several contexts. Using the pipeline to pre-process new datasets could allow to train afterwards stronger models from larger training datasets. The developed models show the potential of accelerometer data to reliably predict certain goat behaviours.
The analysis of the impact of using different selected values at each pre-processing step helps to identify the optimal parameters for each model. In the literature, the effect of the window size varies greatly from one study to another, from a few seconds (Robert et al., 2009) to several minutes (Vázquez-Diosdado et al., 2019). In our work, the best AUC scores were obtained with different time-window sizes depending on the considered behaviour (10 or 20 seconds for “ruminating”; 60 seconds for “head in the feeder” and ”standing”; 50 seconds for “lying”). The 20 seconds time-window was selected for “ruminating” for faster computation. The size of the time-window can be explained as a trade-off between the greater amount of information that can be encompassed by a large time-window and the risk that a too large time-window would contain more than one behaviour being expressed (Banos et al., 2014). The challenge is to find the ideal window size, which the average duration of the predicted behaviour could also explain. The shorter the duration of the bout of behaviour, the smaller the window should be, and this relationship is influenced by the data acquisition frequency. A higher data acquisition frequency should allow to capture more details in acceleration patterns, which may result in better performance scores. Especially that the experimental context can interfere on the apparition and duration of a behaviour and have repercussions on the ideal size of the time-windows. Results show that a large time window is better for “head in the feeder” while a small time window seems to lead to the best score for “rumination”. This could partly be explained by the fact that animals spend a longer time at the feeder after the feed delivery, while rumination corresponds to shorter events, often interrupted.
Filtering the data seems to decrease the model performance. Although it can appear that ear-mounted accelerometer signals are likely to be noisy (Chapa et al., 2020), filtering the signal does not seem to improve the performance of the prediction model in the case of animal behaviour prediction (Riaboff et al., 2019). In our study, and for the four behaviours, data filtering systematically decreased the AUC scores. High-pass filter excluding the low frequencies of the signal removes information from the signal that seems useful to predict the four behaviours. We conclude that the orientation of the static acceleration provided by raw acceleration data is useful to predict rumination, and lying and standing positions. Moreover, for each tested cut-off frequency, very low frequencies are filtered and thus, there are no major effects of the tested filters on the AUC scores. In several papers, calculating additional time-series like pitch and roll improved the performance prediction as it represents the rotation around two axes due to changes in position (Lush et al., 2018 during urination events in sheep; Vázquez-Diosdado et al., 2019 for walking, lying and standing behaviours in sheep). It approximates the head/body inclination during the expressed behaviour and thus is useful for predicting behaviours involving different postures and body/head tilt (Zobel et al., 2015, Lush et al., 2018). Pitch and roll enhanced the AUC score of the four behaviours in the present study, which often induce a unique head position. During rumination and standing, goats keep their head still and upright. When they have their head in the feeder, the head is mostly down, while they eat the food. During lying behaviour, goats can keep their head upright when ruminating or just observing their environment. They can also put their head down on another goat to rest or under their own body, inducing a few head movements. Moreover, additional time series enriches the features set, as tsfresh calculates several features on each time-series of the data. These features effectively decompose the original time-series into components that are not simply linear transformations but which capture more complex facets like non-linear entropic measures to quantify the complexity, unpredictability, or irregularity of a time series for example. The most important features for “head in the feeder” and “lying” were features that calculate the permutation entropy on the z-axis rotated acceleration and on the norm respectively. This feature captures the complexity of a dynamic system by characterising the order relations between values of a time series (Henry & Judge, 2019). For instance, when comparing the means of the permutation entropy calculated on the norm when the goat was lying or not, the mean value for lying events (4.3±0.3) was lower than the one for non-lying events (4.5±0.1) (Appendix 6). This suggests that during lying events, the pattern in the time series data tends to be more predictable, it has higher order relations compared to periods without lying events, and it fits with the common intuition that lying is a mostly static behaviour. Generating a large set of features shows the potential for reliable predictors of these behaviours.
In this study, the AUC score was selected as the primary evaluation metric over accuracy, balanced accuracy, F1-score, specificity, and sensitivity. According to López et al. (2013), the AUC score is a comprehensive measure of classifier performance, encompassing the other metrics cited and providing a reliable measure to identify which model is better on average. AUC score is recommended when dealing with imbalanced data and when aiming to achieve good quality results for both classes, i.e., the presence of the behaviour or not (López et al., 2013), without being threshold-dependent. Therefore, the search for the best pre-processing steps focuses on improving the AUC score. Few studies use AUC score as the referential performance metric. Strong results have been obtained in cows, for example Cabezas et al. (2022) for rumination (AUC=0.967) and lying (AUC=0.894); Shen et al. (2020) obtained a score of 0.959 for feeding and rumination. In sows, Escalante et al. (2013) obtained an AUC score of 0.872 for feeding behaviour and 0.787 for lying. No studies on small ruminants used this metric to evaluate the performance of the model. The AUC scores of the models developed with a split based on the time-windows of all goats when predicting “ruminating”, “head in the feeder”, “standing” and “lying” were 0.800, 0.819, 0.829 and 0.823 respectively.
Conclusion
This study aimed to develop a supervised classification algorithm to characterise goat behaviour automatically using accelerometer data. It involved a comprehensive analysis of various pre-processing techniques, parameter values, and feature sets to identify optimal configurations for behaviour prediction. Segmenting data into time windows and the computation of features based on the time series enriched the dataset, contributing to better describing the signal and improving the predictive capabilities of the model. While the model showed good performance in predicting “ruminating”, “head in the feeder” and posture behaviours, challenges were found in achieving acceptable scores when training involved different animals than the animals used for prediction. Collecting data on a small number of animals limits the prediction capacity of the model. The developed pipeline in this paper is freely available online (Mauny et al., 2024b) and lays a foundation to gather supplementary data for automated behaviour recognition using accelerometer data with automatic features calculation and selection.
Acknowledgements
We sincerely thank the staff at the experimental goat unit of INRAE in Thiverval-Grignon and the ADAPT-HERD project for allowing us to collect acceleration and behavioural data on the goats during the experiment. Preprint version of this article has been peer-reviewed and recommended by Peer Community In Animal Science (https://doi.org/10.24072/pci.animsci.10034; Rafat, 2025).
Funding
This work benefited from state aid managed by the National Research Agency under France2030 under the reference ANR-22-PEAE-0008.
Conflict of interest disclosure
The authors declare that they comply with the PCI rule of having no financial conflicts of interest in relation to the content of the article. The authors declare the following non-financial conflict of interest: Masoomeh Taghipoor and Nicolas Friggens are recommenders of PCI Animal Science.
Data, scripts, code, and supplementary information availability
Data is available online (https://doi.org/10.57745/LGZBM1; Mauny et al., 2024a) and is described in the related data paper (https://doi.org/10.1016/j.anopes.2025.100095; Mauny et al., 2025a). Scripts and code are available online (https://doi.org/10.5281/zenodo.12624785; Mauny et al., 2024b). Supplementary information is available online (https://doi.org/10.5281/zenodo.15148454; Mauny et al., 2025b).