
 CC-BY 4.0
1. Introduction: The challenge of presenting lithic artifacts
Prehistoric lithic industries are typically composed of thousands, or even tens of thousands, of artifacts of all sizes, making it impossible to visually represent all pieces in publications. While count tables help describe these large populations of objects, the typological and technological definitions of the categories used to produce these counts are not universally shared. Consequently, the visual representation of artifacts plays a significant role in supporting the description and interpretation of stone tool assemblages. This illustrated subset often depicts only a very small numerical portion of the entire collection and is carefully selected to support a specific argument; it is therefore unrepresentative of the assemblage as a whole.
Moreover, the number of artifacts represented depends on the publication medium, as well as budgetary and time constraints associated with producing the illustrations. While the ideal scenario would be to represent all the artifacts in a collection, giving readers the best opportunity to assess the coherency between the descriptions provided, the interpretations proposed, and the physical reality of each object, this is rarely ever fully achieved. Nevertheless, making the largest possible number of artifacts accessible, appreciable, and manipulable for the scientific community enhances the robustness of the data through greater transparency of the criteria underlying interpretations. Striving toward this objective is not limited to research alone; it also extends to higher education and broader public dissemination.
In addition to drawings, the traditional form of representing prehistoric lithic industries, new visual techniques, such as photography, three-dimensional scanning, and photogrammetry, represent significant technological advances in presenting artifacts in publications.
After briefly reviewing the advantages and limitations of these various approaches, we argue that a photographic method, rarely applied to lithic industries, Reflectance Transformation Imaging (RTI), presents a means of producing high-fidelity reproductions of objects while being easy to implement for a large number of artifacts
2. Traditional representation: drawing stone tools
From the moment ancient stone tools were first recognized, their graphic representation emerged as the preferred visualization tool, serving alongside written descriptions as proof of the intentional nature of their manufacture or their association with a particular civilization or epoch. Early drawings of stone tools (Figure 1) played a crucial role in the history of Prehistory, particularly demonstrating the deep antiquity of human-made tools. The effort to codify and standardize the graphic representation of stone tools began to emerge as early as the beginning of the 19th century. “Enhancing hatching” was used to illustrate removals and the relief of each piece, although these early hatching techniques differed from those used today. Their placement and extent were then more freely applied in the absence of strict standards (Figure 2).
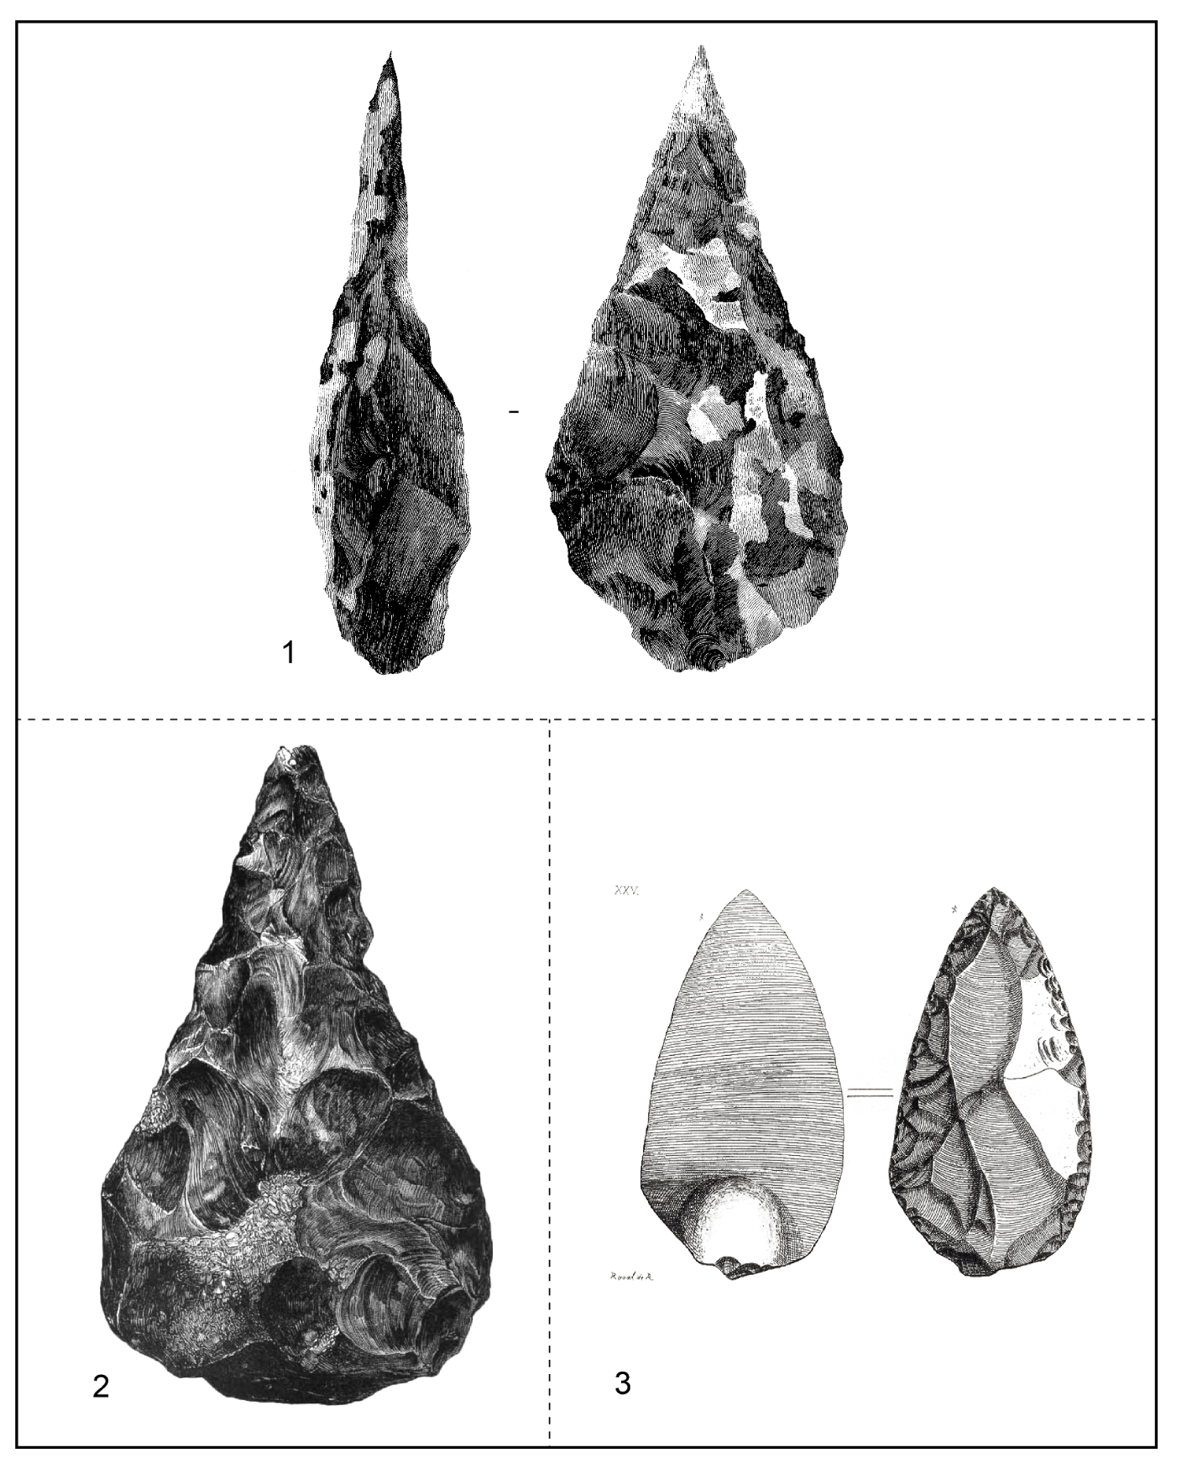
Figure 1 – Historical illustrations of paleolithic lithic artifacts. 1. Drawing of a handaxe from Hoxne (Suffolk, England), published by John Frere in 1800 in Archaeologia (Frere, 1800, pl.15). In this letter, J. Frere concluded that these artifacts were “weapons of war, fabricated by a people who had not the use of metals” and that “the situation in which these weapons were found may tempt us to refer them to a very remote period indeed: even beyond that of the present world”—one of the earliest hypotheses advocating for the antiquity of humanity, foreshadowing the later recognition of what would be called Prehistory. It would take more than 50 years for John Evans to reconsider J. Frere’s observations. 2. Representation of a handaxe discovered at Gray’s Inn Lane (London, England), extracted from The Ancient Stone Implements, Weapons and Ornaments of Great Britain by John Evans (Evans, 1872, pl. 451, p. 522). 3. Illustration of a convergent double scraper from the Grotte des Cottés (Vienne, France), drawn by Raoul de Rochebrune (Rochebrune, 1881).
The desire to standardize the descriptive characteristics for classifying these assemblages of artifacts quickly led to the adoption of technical drawing conventions (Figure 2). These conventions, adapted to the specificities of hard stones, remain widely used in scientific publications today (Dauvois, 1976; Laurent, 1985; Addington, 1986; Martingell & Saville, 1988; Assié, 1995; Inizan et al., 1995; Cauche, 2020; Cerasoni, 2021; Timbrell, 2023). Within the international community of lithic specialists are generally familiar with “enhancement hatching” and how to interpret it to better reconstruct the stages of an object’s manufacture, with some countries adopting specific standards, such as Japan (Figure 2, no.4).
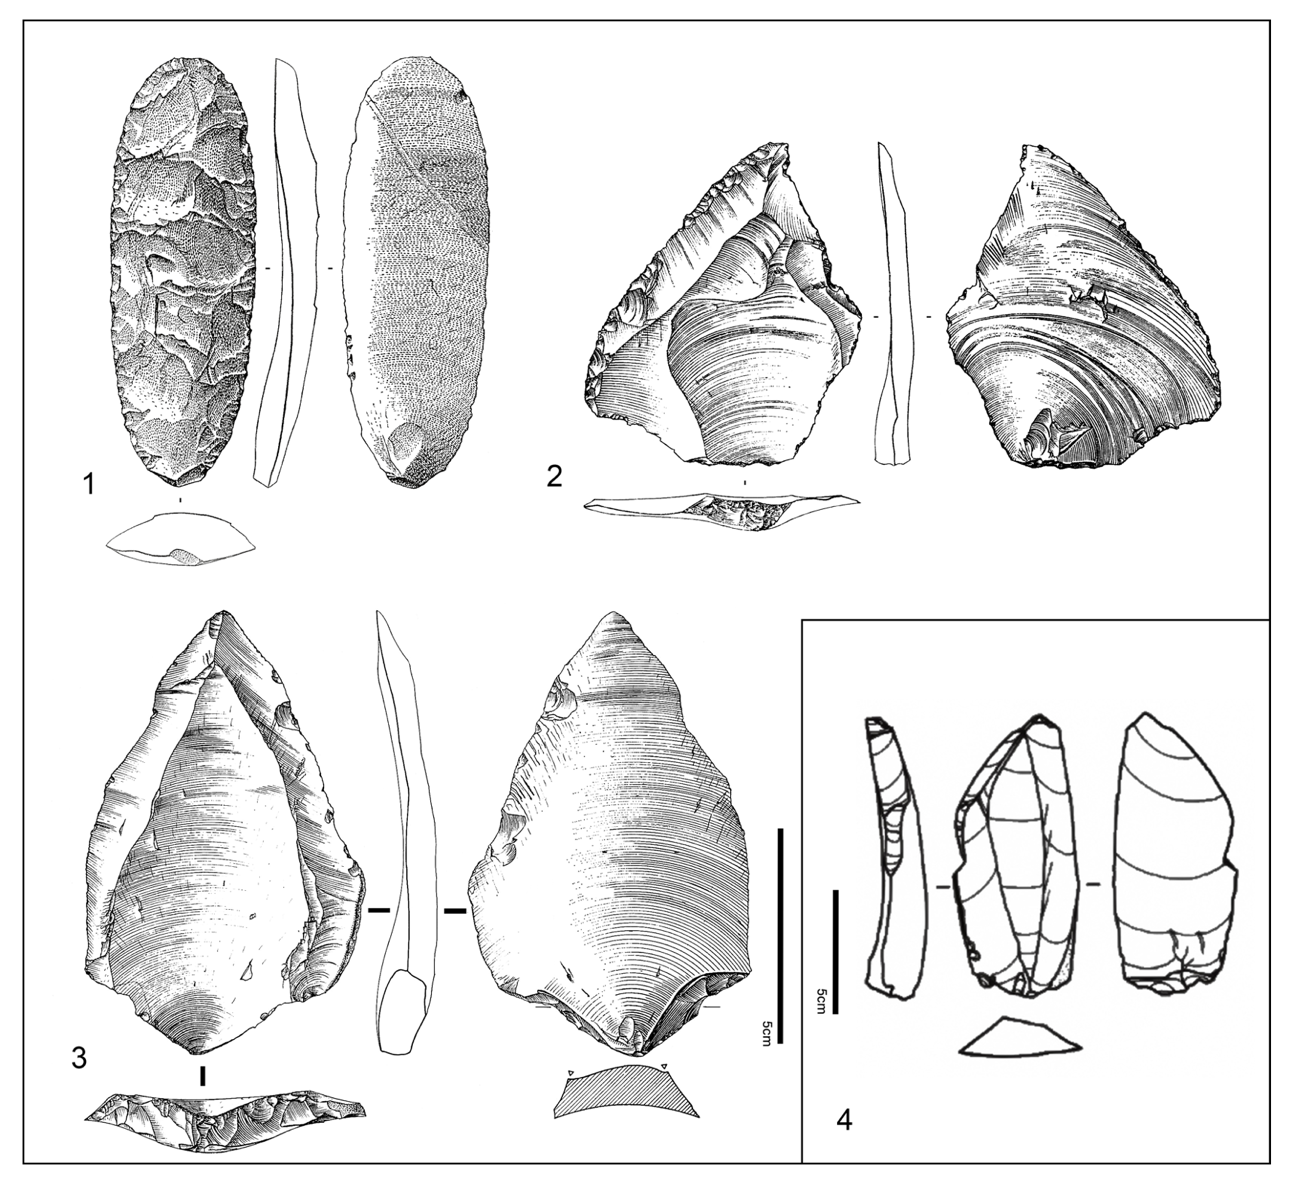
Figure 2 – 1 to 3. Traditional drawings (Dauvois, 1976, modified). A. Gossolorum, Ténéré (Niger), quartzite scraper. B. Abou-Sif (Jordan), Levallois flake scraper in flint. C. Carrière Bervialle I, Les Hautes-Bruyères (Hauts-de-Seine, France), Levallois point in flint. 4. Specific drawing standards, the example of Japan - Hirosato-type microblade cores (Hokkaido, Northern Japan; Takakura, 2020).
The evolution of drawing practices has mirrored advancements in investigative methods for lithic industries. Initially artistic and qualitative—where an industry was often characterized by a few “diagnostic fossils”—it became increasingly technical and precise with the advent of statistical typology (Bordes, 1953). This shift led to the creation of an ever-growing number of drawing plates, extending beyond the main shaped or retouched pieces to equally reflect their relative proportions (e.g., Sonneville-Bordes, 1960). More recently, the widespread adoption of the techno-economic approach has resulted in the inclusion of a broader range of artifact categories deemed significant. Thus, cores, knapping accidents, and unmodified products have become increasingly common in drawing plates. These have been supplanted by diacritical sketches, focusing on object manufacturing methods, which are often less demanding to execute than traditional drawings (Figure 3).
Traditional lithic drawing, characterized by hatching, presents several drawbacks:
The production of lithic artifact drawings requires not only significant time but also varies greatly between artifact types. A survey of four experienced illustrators (Jacques Jaubert, Gauthier Devilder, Nelson Ahmed-Delacroix, and Celia Fatcheung) revealed that the average time required to draw a lithic artifact ranges from 25 minutes to 8 hours. This wide range can be explained by factors such as the number of views and removals, as well as the type of raw material. One of the surveyed illustrators highlighted this variability with two extreme examples. In the first case, drawing an unretouched flint blade — featuring a top view, a schematic profile view, and a view of the butt — can be completed in 20 minutes, including the measurement of the piece and digital grayscale processing before publication. In contrast, drawing a phonolite biface requiring six detailed views can take between 2 to 4 hours per view, amounting to over 12 hours of work for the final publication-ready illustration.
It requires the meticulous mastery of drawing techniques, leading to highly variable quality depending on the illustrator.
It is prone to errors due to misinterpretations of technological features by the illustrator and remains incomplete, as it is particularly difficult to graphically represent very small removals or surface alterations. Drawing is inherently interpretative: Michel Dauvois said that “the tool is a raw fact, its drawing a scientific fact, because the object precedes its understanding; between the two lies the interpretation of observation. The drawing thus represents the observer’s position relative to the tool” (Dauvois, 1976, p. 14). In other words, the drawing does not seek to reproduce every detail of an object but rather tacitly illustrates a specific argument. This interpretative element may lead to the intentional (or unconscious) omission of certain elements or, conversely, an emphasis on others. Thus, while drawings help guide the reader in understanding a given hypothesis or interpretation, it is crucial that the reader has a means of forming their own opinions about the material.
Despite these shortcomings, drawing remains the foundation for defining numerous categories of retouched or shaped pieces (Bordes, 1961, Demars & Laurent, 1989), technical pieces, or knapping accidents (Inizan et al., 1995), and even techno-complexes. These “types” serve as a more or less conscious reference for describing stone tool industries (Bordes, 1984). Drawings remain the predominant mode of representation in current publications, although they are increasingly supplemented or even replaced by photographic and digital imaging methods.
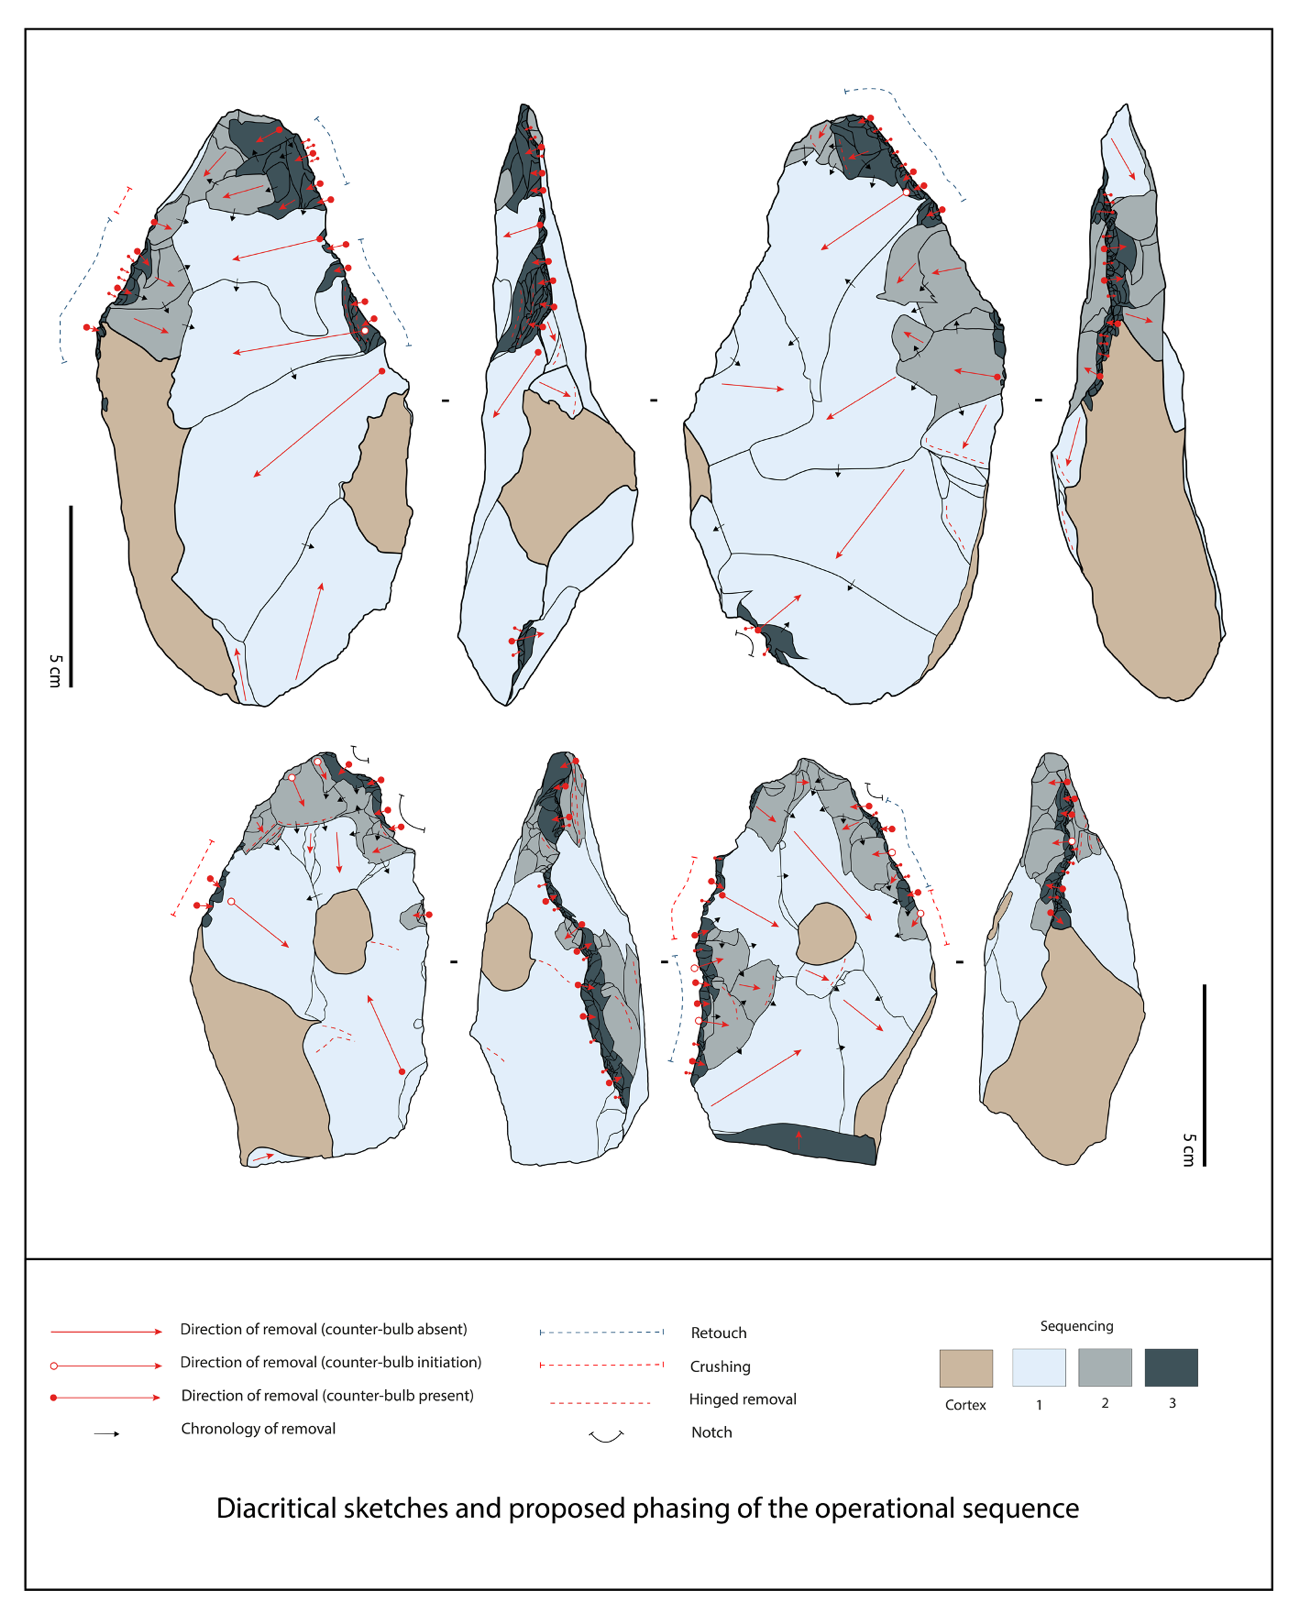
Figure 3 – Diacritical sketches of two bifacial pieces from the site of Cagny l’Épinette (Somme, France). Sketches produced as part of an ongoing doctoral thesis by J. Looten, under the supervision of A. Lamotte (HALMA – UMR 8164) and co-supervised by J. Jaubert (PACEA – UMR 5199).
3. Modern practices in the digital era
Over the past two decades, digital imaging has become a key tool in reducing interpretative biases by enabling a more objective characterization of artifacts. In this section below, we present the main imaging approaches for presenting stone tools that contribute to improving our understanding of the studied remains: traditional photography, 3D modeling, and RTI (Reflectance Transformation Imaging). These techniques are now widely used, and a comprehensive overview of these methods was published by Brecko & Mathys in 2020 as part of a handbook for best practices and standardization for the mass digitization of natural history science collections (Brecko & Mathys, 2020)
3.1. Photography
With the advent of digital photography, photographs now often, but not always, accompany drawings of stone tool industries. Easy to implement, artifact photos give the impression of a faithful and objective reproduction of a material reality. The rise of online publications and supplementary information has further contributed to the widespread adoption of photography, as printed media offer fewer opportunities for extensive color plates. This trend has accelerated with digital technology, facilitating the rapid capture of high-quality, publishable images. Photography can yield valuable results, particularly in rendering relief, which, under specific lighting conditions, can convey surface alterations and material properties (Laurent, 1985). High-quality photographs can even reveal the grain and, in some cases, the petrographic nature of knapped stones.
However, in practice, photographs often fail to meet expectations because they are not produced under optimal conditions or with appropriate equipment. Poor lighting frequently renders photos less “interpretable” compared to drawings (Figure 4), as no single view can effectively highlight all aspects of an artifact without sophisticated lighting setups and sometimes hours of adjustment (Figure 5). Unlike 3D models, 2D photography often presents optical distortions that can affect the accuracy of the representation of an archaeological object. These deformations are caused by several factors, mainly optical and geometrical misalignment or deformation of the sensor.
In this context, several methods are employed to enhance artifact representation, with lighting being the key parameter. Instead of relying on a single light source (artificial or natural) positioned to the upper left of the object, as convention dictates, it is possible to manually determine the optimal lighting for each object using at least two or three adjustable light sources (e.g., LED lights). Results vary depending on the shape (particularly the thickness), but, most importantly, on the material from which the object is made (e.g., translucent obsidian or highly reflective white patinas). This approach nevertheless helps capture the shadows of the numerous facets of the artifacts. The flexibility of movable light sources facilitates optimal positioning for low-angle lighting while also allowing adjustments to the intensity of lights and shadows according to the different forms and textures of artifacts.
When photographing objects with a thickness that is too high relative to their surface area, the operator quickly encounters a shallow depth of field, which directly impacts image quality. To address this, focus stacking is commonly used. This method involves combining multiple images in which the focal plane position varies along the optical axis, generating a final image with an extended depth of field. The first step in focus stacking consists of capturing a series of images, each with a slightly different focal plane. This can be achieved either by adjusting the focus directly or by physically shifting the camera while maintaining a fixed focus setting. The second step involves digitally “stacking” the obtained images, prioritizing the sharpest areas. The selection and compilation of these zones can be performed manually or automatically using image-processing software. Several commercial software solutions (Zerene Stacker®, CombineZP®, Helicon Focus®, and Auto-Montage®), as well as open-source alternatives (such as the Focus-Stack® solution available on GitHub, Forster-Heinlein et al., 2004), enable the automatic processing of these image stacks. These methods are continuously evolving, with an overview provided by Brecko et al. (2014).
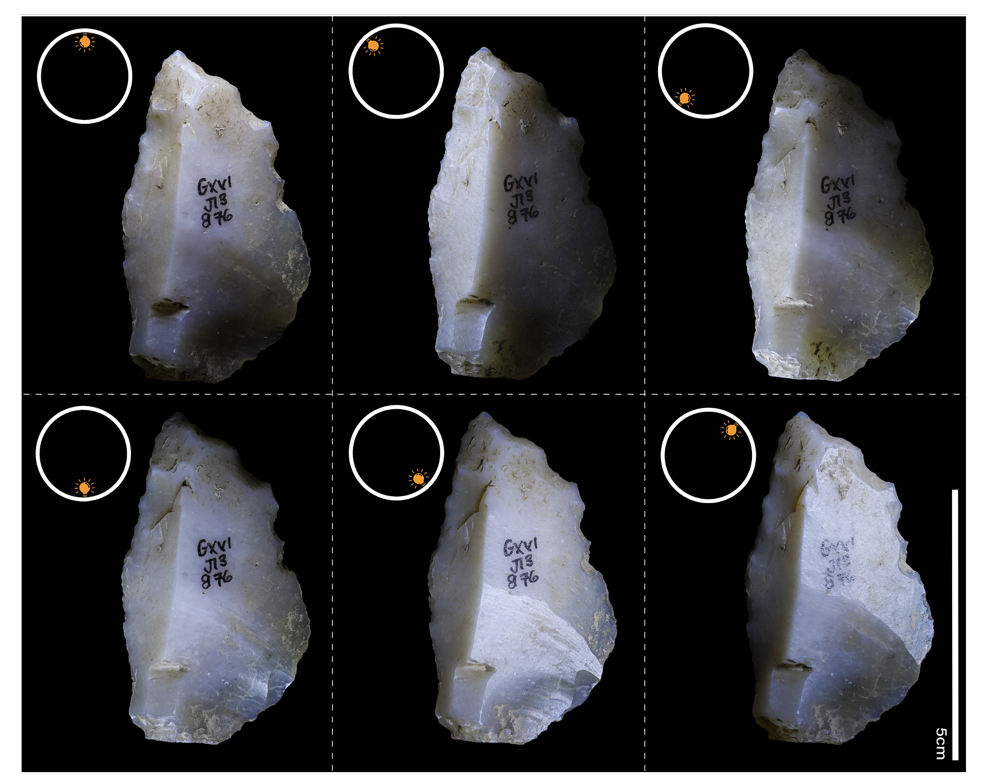
Figure 4 – Differing perceptions of the same object depending on the angle of incidence of the lighting. Settings: Canon 6D Mark II camera – Canon 50mm f/1.8 lens – f/10 – 1/20 sec – ISO 100.
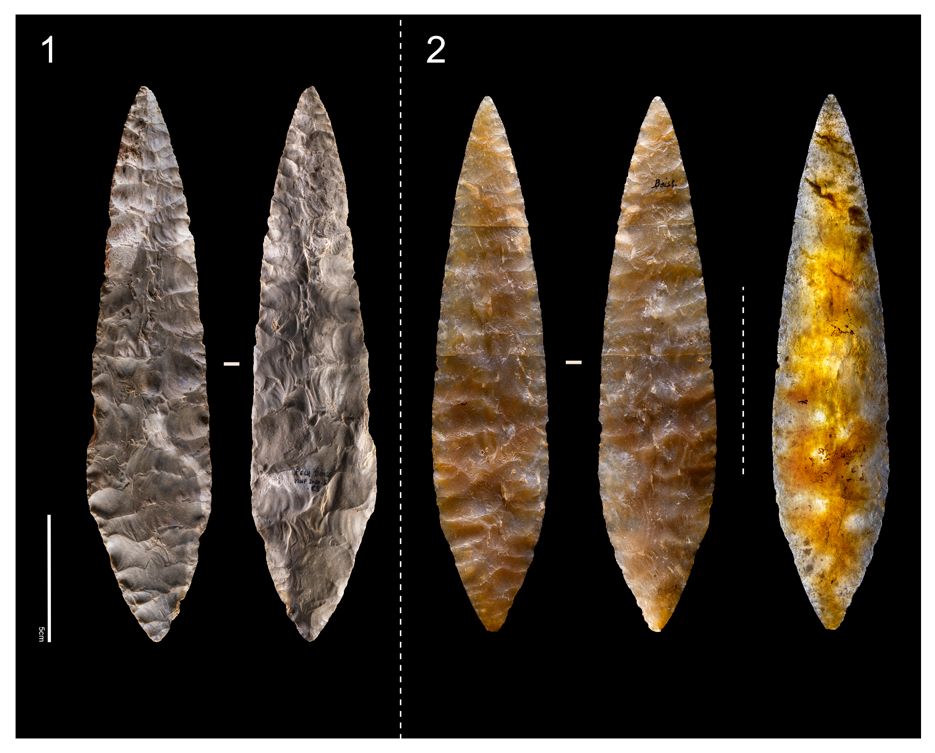
Figure 5 – Photographs of two laurel leaf points from the Solutrean site of Pech de la Boissière (Dordogne, France). 1. Image with multidirectional lighting – Captured with a Nikon D850 and a Sigma ART 50mm f/1.4 lens, settings: ISO 100, 0.5s, f/10. 2. left: Photograph taken with multidirectional lighting – Nikon D850 and Sigma ART 50mm f/1.4, settings: ISO 100, 1.3s, f/10. Right: Photograph taken with backlighting, enhancing the transparency of the artifact – Nikon D850 and Sigma ART 50mm f/1.4, settings: ISO 100, 1/160s, f/10.
3.2. Specific treatments
Before the advent of 3D and RTI approaches, photographs were generally unsatisfactory from a technical standpoint, particularly in terms of the order and organization of removals, except in rare cases. As a result, alternative treatments were attempted to enhance visualization. For example, to improve the quality of his photographs, Jean Airvaux (Airvaux, 2005) applied multiple layers of a white crack detector spray to the surface of artifacts, while Pelegrin (2000) used magnesium powder. These methods proved effective in highlighting the relief of knapping scars, although they obscured details related to the raw material. However, the direct application of substances on lithic surfaces has raised concerns among museum curators and archaeologists.
3.3. 3D Acquisition methods
Widely used for over at least a decade, 3D modeling has become a common solution for illustrating and analyzing lithic objects, regardless of the acquisition method chosen. In some cases, publishable representations derived from 3D models, highlighting surface features such as scars and ridges, can be generated automatically (e.g., Pulla et al., 2001; Richardson et al., 2014; Magnani, 2014; Barone et al., 2018; Bullenkamp et al., 2022).
Beyond their role as simple visualization tools, 3D models provide crucial data, particularly metric data that cannot be directly obtained from 2D images. These advancements have revitalized morphometric studies of lithic artifacts, offering methodological advantages, especially in terms of reproducibility and precision compared to traditional manual measurements using calipers (e.g., Lycett et al., 2010; Lamotte & Masson, 2016; Herzlinger et al., 2017; Herzlinger & Grosman, 2018; Delpiano et al., 2019; García-Medrano et al., 2020; Bustos-Pérez et al., 2024; Di Maida et al., 2023; Smith et al., 2024). These developments minimize inter-observer biases and eliminate optical distortions and aberrations common in purely 2D-based analyses. Measurements derived from 3D models include linear, angular, and volumetric dimensions, enabling more comprehensive analyses of lithic artifacts, including convexity, concavity, symmetry, and asymmetry.
Among the various 3D digitization methods currently available, here we focus exclusively on photogrammetry. This approach currently offers the best balance between budget constraints and image quality (resolution, accuracy, and texture extracted directly from the images used for 3D reconstruction; Mathys et al., 2013; Porter et al., 2016; Medina et al., 2020). This method is accessible for under €2,000, unlike 3D laser scanners or structured light scanners (not to mention CT scans, which allow internal analysis of objects — a feature with limited relevance for lithic artifacts). These devices can become very expensive while providing results comparable to those obtained through photogrammetry. Moreover, open-source software solutions, such as Colmap® (Schönberger & Frahm, 2016) and Meshroom® (Griwodz et al., 2021), facilitate the post-processing steps required for photogrammetric digitization.
Widely documented in the literature, particularly in Luhmann’s reference book on close-range photogrammetry (Luhmann et al., 2019), this reconstruction technique has evolved over the last 180 years. With the advent of digital technologies in the late 2000s and the implementation of SIFT-type algorithms (Lowe, 2004), these techniques have been modernized and are now highly effective. They enable the automated execution of a well-established processing workflow: image phototriangulation, depth map generation, and textured triangular mesh generation.
Here, the photogrammetric method was implemented using a Nikon D850 DSLR camera combined with a fixed focal length 60mm Nikon macro lens and a GODOX AR400 ring flash. Two linearly polarized filters, positioned perpendicularly to each other on the flash and the lens, significantly reduced specular reflections often produced by siliceous materials. Additionally, a colorimetric calibration target (ColorChecker®) and a geometric calibration target (a machined aluminum plate with markers precisely positioned to within a few hundredths of a millimeter) were included as part of the image series.
Furthermore, to best adapt the shooting geometry to the shape of the objects, no turntable or automated system was used. Instead, images were manually positioned to ensure complete coverage of the object’s surface while maintaining a nearly constant distance from the digitized surface. In order to get the best resolution of the native images (and thus the resulting 3D model), the distance to the object is fixed by the minimal focus distance enabled by the macro lens (in our case with the Nikon 60mm macro we have roughly 32 cm). This method was applied to a Mousterian scraper from the cave site of Pech-de-l’Azé I (Dordogne, France; Figure 6). In this configuration, the native image resolution of the object is approximately 0.01 mm, and the expected reconstruction resolution is better than 0.05 mm. The accuracy of scaling is roughly the same order of magnitude as the native resolution on the object. Depending on the object complexity, between 200 and 500 images are required to get a complete coverage with the highest resolution possible with the macro lens 60mm. The number of pictures could be reduced, fixing a higher distance to the object, but the level of details of the 3D model finally obtained will be deprecated.
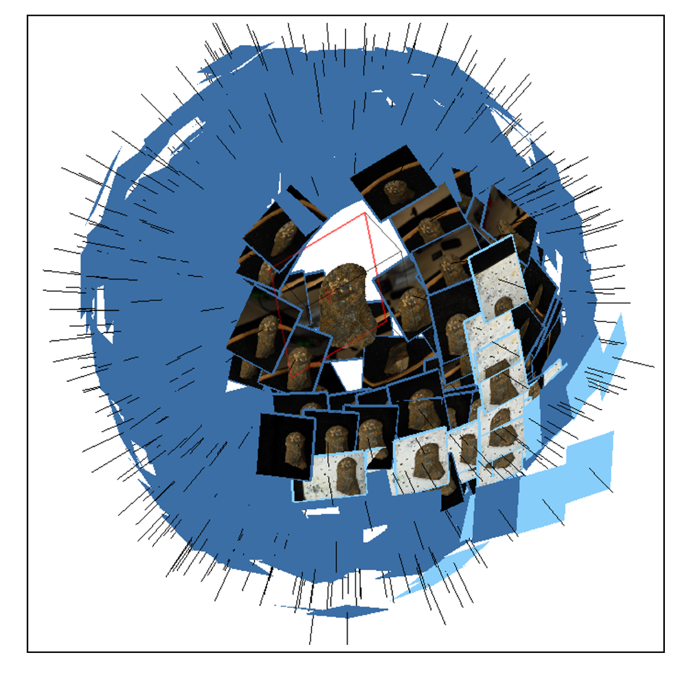
Figure 6 – Example of acquisition geometry for a lithic artifact, generated using Metashape software. Scraper from Pech-de-l’Azé I (Dordogne, France). The poses (positions and orientations) of the pictures relative to the object are presented by the blue rectangles (dark blue rectangles present the poses of the images used for the 3D reconstruction and the light blue ones the poses of the images used for the scale calibration). However, the black axis is a redundant way to also show the poses of the pictures.
The second part of the processing focuses on rendering methods that generate 2D representations from the produced 3D model. Multiple approaches can be considered, which can be categorized into two main types (Figure 7):
Using a 3D visualization tool (e.g., Meshlab) or a 3D rendering engine (e.g., Blender). This option relies on rendering solutions from the fields of visualization and 3D animation. One example is the use of the open-source software Blender to set up the desired scene (choosing the material type for realistic or artificial BRDF adjustments, selecting the type and orientation of lighting). This approach offers limitless possibilities. Figure 7 presents two examples (Figure 7, no. 1 & 2) that can be produced using Blender.
Using a 2.5D raster or depth map. A 2.5D digital elevation model is extracted from the 3D model from a chosen viewpoint (either orthometric or central projection). Various tools commonly used in Geographic Information Systems (GIS) can be utilized to generate different types of shaded models. Figure 7 presents several types and parameter settings (non-exhaustive) for shading the scraper. View No. 3 shows the rendering using ambient occlusion (Tarini et al., 2006) while views No. 5 and 6 illustrate derivatives of the 2.5D raster, specifically the calculation of indices characterizing local convexity or maximum local curvature (computed using SAGA GIS software following Conrad et al., 2015).
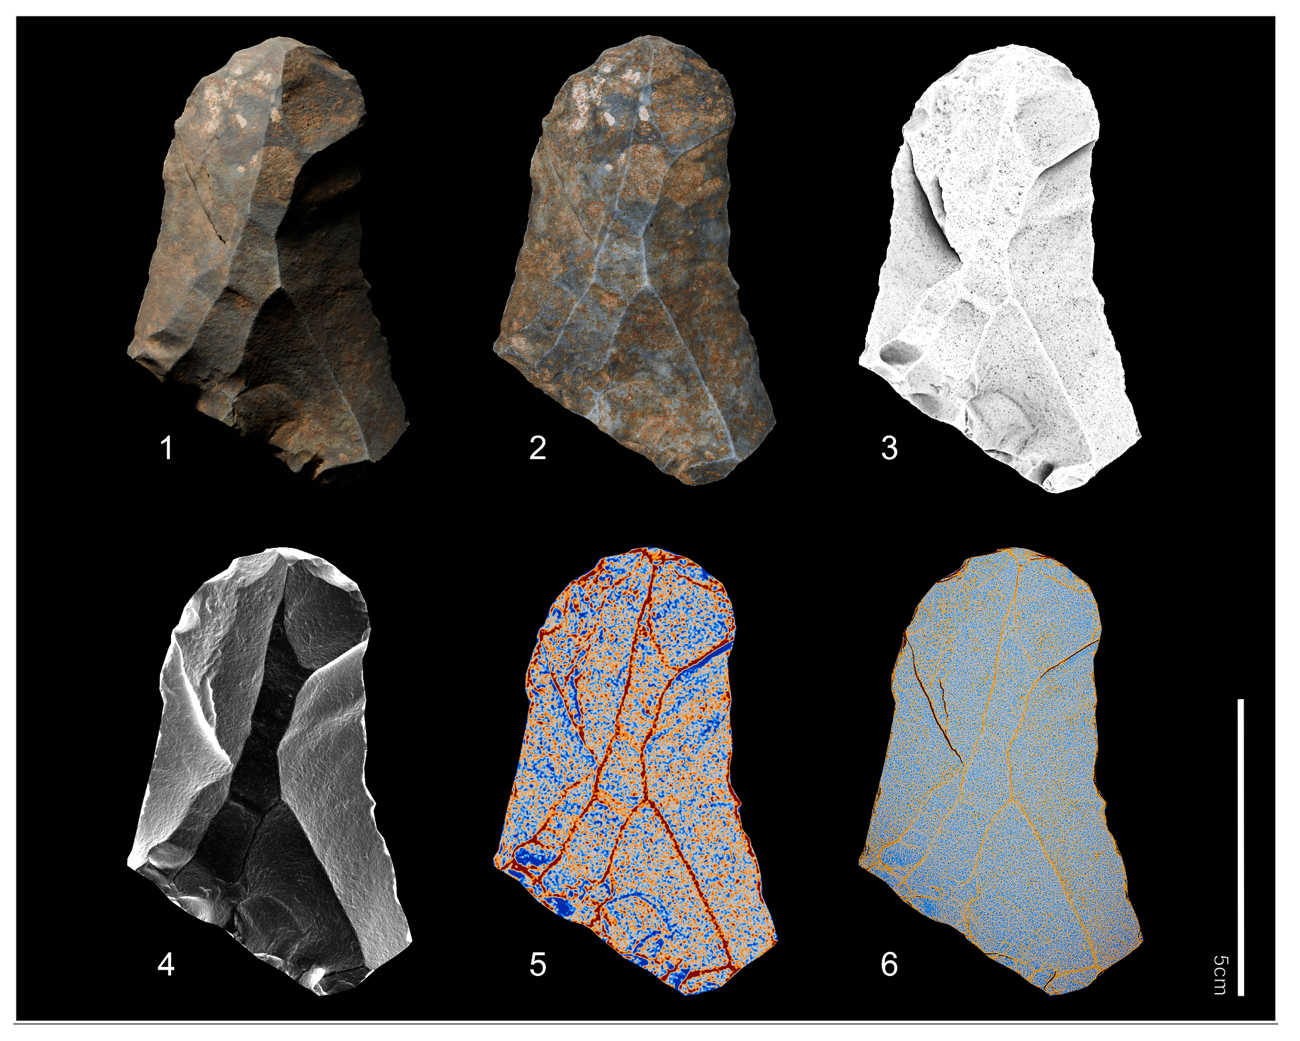
Figure 7 – Representations derived from the 3D model (photogrammetry). 1) Textured rendering with directional lighting produced using Blender. 2) Textured rendering with diffuse lighting produced using Blender. 3) Shaded rendering with ambient occlusion, directly extracted in 3D from Agisoft Metashape. 4) Shaded rendering based on the Skyview Factor, generated using SAGA GIS. 5) Convexity index map, generated using SAGA GIS. 6) Maximum curvature map, generated using SAGA GIS.
Far more than simple visual representation systems, various 3D acquisition methods enable in-depth morphometric analyses. They also provide a contact-free means of handling, presenting, and sharing rare and fragile artifacts. However, to achieve accurate results, these methods require lengthy and complex data processing, demanding advanced expertise in 3D modeling as well as high (and costly) computational power. In most current publications, 3D digitization is not justified, and the perception of lithic industries remains confined to traditional representation systems (drawings, photographs), supplemented by counts, targeted measurements, and statistical treatments of the data.
3.4. Reflectance Transformation Imaging (RTI) of lithic artifacts
Reflectance Transformation Imaging (RTI) combines the advantages of both drawing and photography. Based on the Polynomial Texture Mapping (PTM) approach, RTI was developed by a research team at Hewlett-Packard led by Tom Malzbender (Malzbender et al., 2001) and was quickly applied to the fields of natural sciences and cultural heritage (Mudge et al., 2008; Earl et al., 2010a, 2010b, 2011; Cultural Heritage Imaging, 2018). RTI relies on two key algorithms: Polynomial Texture Mapping (PTM) and Hemispherical Harmonics (HSH). We will use the HSH in this work. The main difference between PTM (the original algorithm) and HSH (the more recent algorithm) is that the latter offers enhanced capabilities for handling high-frequency surface details by approximating the reflectance behavior across the surface using spherical harmonics. This method is particularly useful for capturing fine textures and subtle variations (Robitaille, 2025).
This method, which requires minimal time, is also low-cost, requires non-specialized equipment, and allows for the visualization of an object’s interactions with artificial lighting. By utilizing the object’s reflectance properties and adjusting the angle of light incidence, it becomes possible to enhance the perception of its microtopography (Masson Mourey, 2019).
RTI enhances our ability to observe and analyze details, providing a means of bringing to light what is often difficult to see with the naked eye, such as use-wear traces, surface irregularities and alterations, or polishes. It has been applied to a wide range of objects of different sizes (Cosentino, 2013; refer to the detailed guide on RTI applied to macrophotography), shapes, and environmental contexts, including numismatics, epigraphy (e.g. Chapman et al., 2017), architecture, and painting (Mudge et al., 2006; Kotoula & Earl, 2015). While this method has long attracted interest for the study of rock art or portable art objects (e.g., Mudge et al., 2006; Diaz-Guardamino & Wheatley, 2013; Lymer, 2015; Horn et al., 2018; Masson Mourey, 2019; Kosciuk et al., 2020; Robitaille et al., 2024), as well as on bone and fossil surfaces (Hammer et al., 2002; Newman, 2015; Purdy et al., 2011; Morrone et al., 2019 ; Desmond et al., 2021), or isolated stone tools (Pawlowicz, 2015; Fiorini, 2018), it has never been used in the analysis or presentation of a lithic assemblage or lithic industry—only for isolated artifacts. RTI has recently been adapted at the microscopic scale for the functional analysis of lithic artifacts, with the goal of providing detailed documentation of use-wear traces, which were previously difficult to access using conventional imaging methods (Robitaille, 2025).
3.4.1 Principle, equipment, and method
3.4.1.1. Principle
RTI creates an interactive image by capturing a series of photographs from a fixed position while illuminating the subject’s surface from different light angles. When light interacts with a surface, four main phenomena can occur: absorption, transmission, diffusion, and reflection. Absorption occurs when the light flux is taken in by the material. Transmission happens when the light passes through the medium without being absorbed. Diffusion takes place when light is scattered in all directions within the medium. Finally, reflection occurs when the incident flux is redirected into the same hemisphere from which it contacted the surface (Vila, 2017, p.18). RTI is based on the principle of reflection. Processing software utilizes surface normal information (the normal vector at a point on a surface is perpendicular to the tangent plane at that point) to compute the deviation of light rays across the surface (Cultural Heritage Imaging, 2018). To perform these calculations, it is essential to know the precise position of the incident light source for each captured image. The phenomenon of reflection itself can be divided into two distinct sub-phenomena: specular reflection and diffuse reflection (Vila, 2017). On smooth surfaces, reflection follows the law of specular reflection: the angle between the incident light ray and the surface normal is equal to the angle between the normal and the reflected ray. In contrast, on rough or textured surfaces, light scatters in multiple directions, producing diffuse reflection.
One of RTI’s main advantages is its ability to deduce the surface normal for each pixel from the computed model. In a Cartesian coordinate system, this normal is defined by three components: x, y, and z. By combining this information with variations in the intensity of the red, green, and blue (RGB) bands depending on the direction of a light source, RTI generates a normal map. The result reveals fine surface details and textures that may not be visible in a static photograph. Although the output is a 2D image, it is often described as “2.5D” because it contains enhanced visual information that allows for a more three-dimensional perception of the object.
There are several RTI capture methods, including fixed domes or motorized rotating arcs (e.g., Earl et al., 2011; Malzbender et al., 2001; Mudge et al., 2005; Porter et al., 2016). Here, we present the Highlight-RTI (H-RTI) method, developed through the combined efforts of Cultural Heritage Imaging (CHI), Hewlett-Packard Labs (HP Labs), and the University of Minho, Portugal (Mudge et al., 2006). This method determines the position of the artificial light source (incident angle) by analyzing reflections on a reflective sphere captured in each photograph. It then uses interpolation to calculate how light interacts with the object from all directions (Cultural Heritage Imaging, 2018; Mudge et al., 2006). Although H-RTI may be less precise in determining light position compared to dome RTI or motorized arcs, it offers the advantage of requiring no specialized equipment, is easily transportable (e.g., in a backpack), and is easy to use, requiring only minimal training.
3.4.1.2. Equipment
The equipment required and the method used for H-RTI have been extensively detailed (Cultural Heritage Imaging, 2018); here, we adapt them for lithic industries (Figure 8). A DSLR camera is mounted on a stand to maintain a stable and zenithal position relative to the lithic artifact. The subject is placed on a matte black background to avoid unwanted reflections. Scaling the artifact remains a challenge, as it is not possible to create an orthophotograph, as can be done with photogrammetry, which may lead to distortions. To minimize this issue, it is recommended to use medium focal length lenses (between 28 mm and 100 mm) to prevent optical distortions caused by wide-angle or telephoto lenses (ibid, 2018, p.8-9). The camera and lens focus are set to manual mode. For artifacts smaller than 2 cm, imaging is performed using a binocular microscope (Leica S8 APO, x10) along with the same camera.
Two or three black, reflective spheres are placed near the subject. The size of these reference spheres depends on the size of the artifact as well as the distance from the camera sensor, and they should correspond to 250 pixels (ibid, 2018). The spheres should be positioned at the same height as the subject’s surface, ensuring they are fully within the depth of field, thereby guaranteeing proper focus. It is important to ensure that they are not placed too high, to avoid casting shadows on this surface, nor too low, to prevent them from being constantly in the subject’s shadow. If one of the spheres becomes invisible due to grazing light, the use of another sphere will help identify the position of the light source. The size of the spheres used ranges from approximately 1 mm to 30 mm. If photography is conducted under natural light (outdoors during the day), which is not recommended, it is preferable to use high-powered flashes to counteract ambient light. A neutral density (polarizing) filter can also be used if necessary.
Photographs should be taken without touching the camera to avoid any vibrations or movements that could introduce calculation errors. The shutter should be triggered remotely, using either a wired or wireless remote control, the camera’s Bluetooth smartphone app, or a computer. Make sure that the object remains perfectly still, even at the micron scale, in order to avoid any errors in the calculations and the generation of a blurry model. For RTI acquisition of artifact profiles and striking platforms, the artifact can be stabilized using adhesive putty or placed in a tray of sand. A 5 cm scale marker is positioned near the subject.
A ColorChecker® color chart can also be used to properly calibrate white balance during post-processing. If the subject is difficult to access—which is rarely the case for a lithic artifact—it is recommended to perform an initial data processing step to ensure the RTI quality is sufficient and that no issues are present.
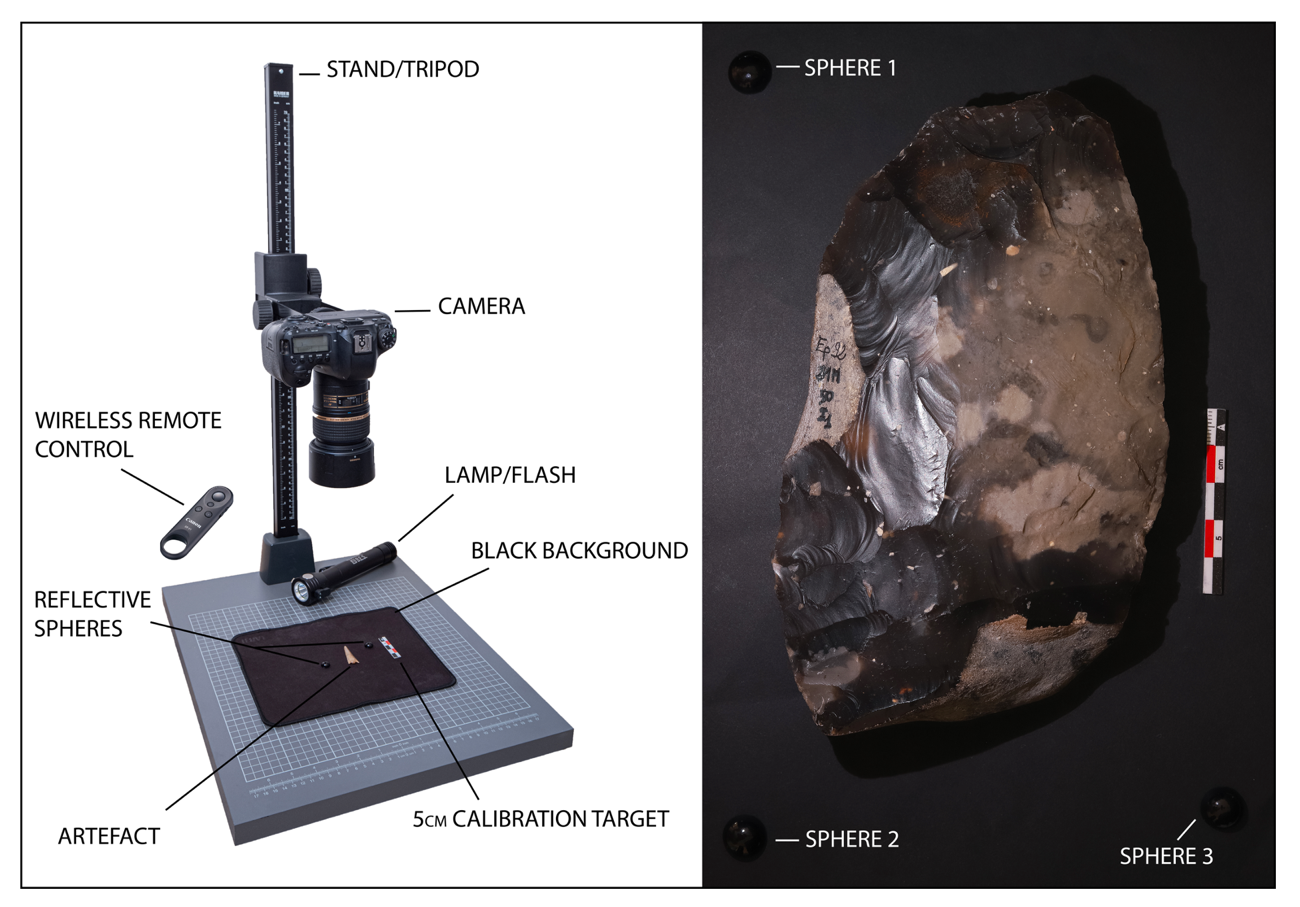
Figure 8 – Left: installation and equipment required for RTI acquisition. Right: One of the fifty raw photographs from an RTI image sequence (3 visible spheres) - Biface from Cagny l’Épinette (Somme, France).
3.4.1.3. Method
Camera settings: Each photograph in the series must have identical settings. Therefore, the camera is set to manual mode. Images should be captured in JPEG format (or RAW+JPEG). The ISO value should be kept between 100 and 400 (low ISO). The aperture setting depends on the morphology of the object but generally ranges between f/5.6 (for very flat objects) and f/13 to maximize the sharpness of the photograph. In some cases, for example, side views of an artifact or an irregular core, a smaller aperture (higher f-stop) is necessary to extend the depth of field. The exposure time varies based on the ISO and aperture settings, and the image should be slightly underexposed to prevent overexposure. For these settings, it is important to take into account the raw material and the surface condition of the lithic artifact. A polished or worn surface is more likely to create overexposed areas. Since settings must remain consistent from the first to the last image, this factor must be accounted for before starting the acquisition process. Additionally, the “Auto Image Rotation” function is disabled, and white balance is set manually. The lens focus is also adjusted manually (you can use the camera’s digital zoom to fine-tune the focus with precision)
Image acquisition method: All photographs are taken in complete darkness (or with a very slight diffuse light), ensuring that neither the subject nor the camera is moved. In order to create a virtual dome above the subject, photographs are taken at different lighting angles: 5° - 15° - 40° - 65°, while rotating around the object in 12 equal steps (30° between each step, similar to the positions on a clock). Additionally, a single photograph is taken with a lighting angle close to 90°.This image, not included in the RTI process, provides a simple lighting setup that will facilitate the automatic selection of the subject during post-processing (in Photoshop). Indeed, it is not possible to make this selection automatically with the RTI images in normal mode, nor with the photographs taken with grazing light. The light source remains at a constant distance from the subject throughout the process, ideally four times the subject’s diameter (or between two and four times its diameter, as recommended by Cultural Heritage Imaging, 2010). The reflective sphere should be placed next to the subject, but not too close to avoid casting shadows that could distort calculations (Vila, 2017). To mitigate potential errors caused by grazing light, it is advisable to use two spheres placed on opposite sides of the subject. If one sphere is obscured by the object’s shadow, the other will remain well-lit. The same method is applicable for RTI acquisitions using a binocular microscope (Hughes-Hallett et al., 2021; Goldman et al., 2018). A documentation sheet is created for each RTI session, recording the author’s name, date and location, number of photographs and corresponding file numbers, equipment used, and any issues encountered.
3.4.1.4. Data Processing: RTI Processing with Relight® - Quick Guide
The RTI file is generated using the Relight® software (version 2023.02; Ponchio et al., 2019). A detailed description of the processing workflow is available at the following link: https://github.com/ExeterDigitalHumanities/rti/blob/main/RTI%20processing%20with%20RelightLab%20v2.pdf. Below is a summary of the main steps involved in the process:
Go to the “File” menu and select the “New” tool to import the photos into the software.
Use the “New Sphere” tool to indicate the position of the reflective sphere, then you select three points on the periphery of your sphere to form a circle.
In the “Edit” menu, use the “Find Highlights” tool. The software automatically detects light reflected in the sphere and calculates the lighting angle.
Check the light position on each photo. Adjust if necessary by dragging the green or red point (if no reflection was detected in the image) with a long mouse click.
Go to the “Export” menu and choose the “Export RTI” tool.
In the “Basis” tab, select “HSH 27 - Hemispherical harmonics.”
Choose the “RTI” format and click “Build” to finalize the process.
RTI Visualization with RTIViewer®. The RTI file is opened in a visualization software, RTIViewer® (version 1.1; Cultural Heritage Imaging, 2013). In this software, photographs taken from different lighting angles can be viewed in various modes. The first mode, “Static RTI image”, removes specular reflections and highlights, allowing interactive changes in the lighting direction. This mode accurately conveys color and patina details of lithic pieces. The second mode, “Specular Enhancement”, is similar to the first but reduces color information while enhancing reflectance values. The third mode, “Normals mode”, derives the unit normal vector for each pixel based on the reflectance model. This visualization mode represents the x, y, and z components using false colors: red, green, and blue, respectively, in a 2D image. From the RTIViewer® interface, a JPEG file can be created using the “Snapshot” tool, which is readable in any image processing application. From this software, you will also have the ability to create bookmarks, pre-define close-up views, a specific lighting angle, or frame a particular area, which is a useful tool for sharing with colleagues.
Post-Processing in Photoshop®. In Photoshop® (or Photopea for a free software available online: https://www.photopea.com), the lithic artifact is automatically cropped and then manually refined before being placed on a uniform black or white background. To enhance visual aesthetics, the RTI Normal mode is converted to black and white using Photoshop®. This transformation is performed via “Adjustments” → “Black & White”, allowing for individual adjustments to each color channel (red, yellow, green, cyan, blue, and magenta). Some minor edits and corrections (e.g., texture, clarity, and sharpness adjustments in Camera Raw) may be applied. However, it is crucial to note that this stage results in a loss of methodological reproducibility. Therefore, all modifications are limited to global adjustments, avoiding targeted alterations to specific artifact areas. To preserve color information, a Static RTI or a standard photograph is always placed next to the black-and-white Normal mode.
To accurately document an artifact, it must be represented from several predefined angles, including the main view, profile views, butt view, and sometimes the reverse side view. These views are aligned with the reference image, with object rotations set at 90° increments. The “American method” is used, displaying the profile view from the object’s side (e.g., Der Aprahamian & Et Abbes, 2015). Intermediate 45° rotations may also be used to highlight retouching, with the angle value indicated. Although technological analysis can often be performed more effectively using RTI results than with the naked eye, additional graphic elements (such as arrows) may be added to facilitate diacritical reading. In such cases, standard lithic drawing conventions (Dauvois, 1976, p. 129) are followed. These annotations are the only interpretive elements introduced and remain easily distinguishable from the RTI-generated data (Figure 9).
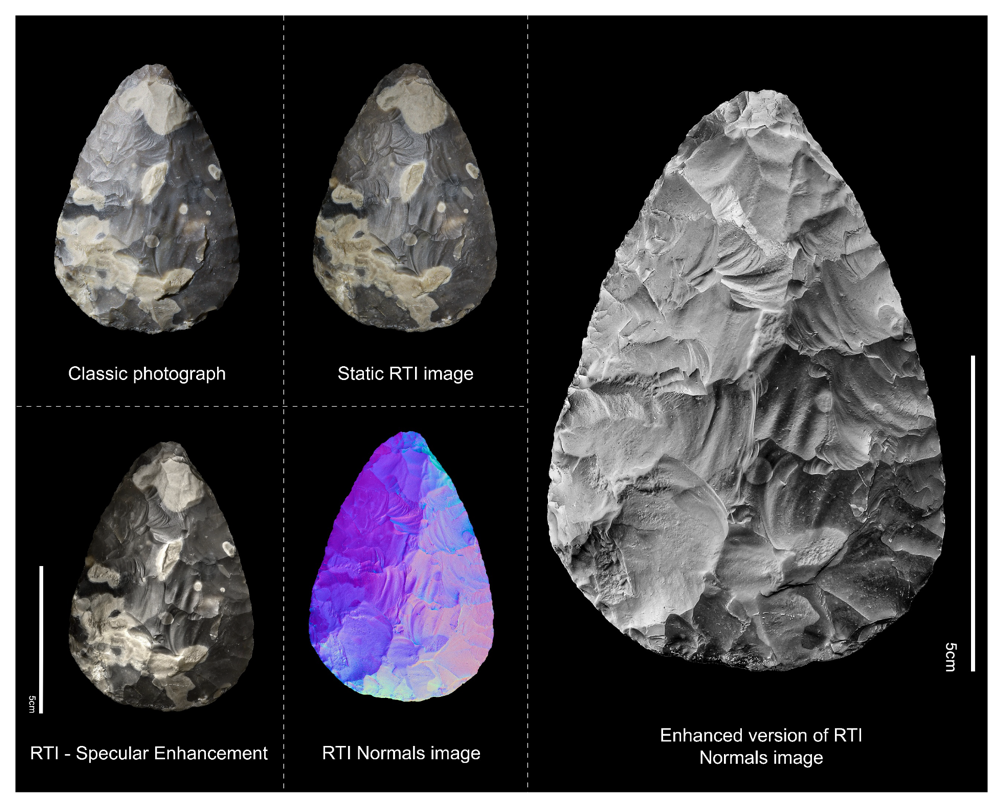
Figure 9 – Different RTI visualization modes and comparison with standard photography. Experimental handaxe - captured using a Canon 6D Mark II DSLR with a Canon 50mm f/1.8 lens - settings: f/14, 1/10 sec, ISO 100.
Supplementary data are provided to facilitate the testing of the proposed method. These data concern two handaxes: the first is an experimental handaxe shown in Figure 9; the second is an Acheulean handaxe discovered at the Cagny l’Épinette site (Somme, France), shown in close-up in Figure 10. For the first, you have access to the raw results from ReLight and RTIViewer. For the second, the same types of files are available, along with unmodified photographs allowing you to perform the manipulations yourself. These data are available at the following link: https://zenodo.org/records/15411558.
Additionally, to address the limitations caused by image compression in the published version, we also provide a second link containing all the figures featured in the article in high definition: https://doi.org/10.5281/zenodo.15463620.
3.4.2. Results
3.4.2.1. Production time and storage
The estimated average time required to create an RTI view of a lithic artifact is as follows:
Setup phase: approximately 5 minutes. Once completed, this step does not need to be repeated for subsequent views.
Photographic acquisition: also around 5 minutes.
RTI file creation in Relight® and JPEG export from RTIViewer®: less than 5 minutes, though this step is highly dependent on computer performance.
Photoshop® processing and plate creation: between 5 and 10 minutes. (This step is common to all methods discussed in this study, whether photography or drawing, as they all require post-processing and digital graphic work.)
The total time required to generate an RTI view is around 20 minutes, meaning that for three views, the complete processing of an artifact takes approximately one hour. Naturally, this process takes longer when producing the first RTIs, but with experience, the workflow becomes more efficient.
Each view is made up of approximately 50 to 100 photos, each taking up about 5 megabytes of storage, totaling 250 megabytes per view. The RTI file itself is around 700 megabytes (but this size can easily be reduced by cropping the model before export), resulting in 1 gigabyte of data per view. While this may appear heavy, however it is important to note that storing the RTI files is unnecessary if the original photos are preserved, significantly reducing storage requirements.
3.4.2.2. Visualization of knapping marks
By its very principle, RTI reveals surface relief and micro-relief with greater precision than traditional photography, including knapping scars, such as ripples, hackles, negatives of micro-flakes resulting from fine retouching or use, and an easy distinction between concavities and convexities (Figure 10). The final image quality depends solely on the specifications of the camera and lens used. This allows for macro views capturing fine details on edges, as well as producing images of very small objects, such as bladelets (Figure 11). Most importantly, multi-directional lighting makes it easy to identify knapping scars regardless of their location on the artifact, rather than being limited to the raised areas highlighted by conventional digital photography lighting. While some knapping scars can be discerned through direct examination in natural light, RTI images can confirm observations and reveal previously unnoticed details. Additionally, it is difficult—if not impossible—to capture all the key details of an artifact in a single photograph, whereas RTI Normals mode achieves this comprehensively.
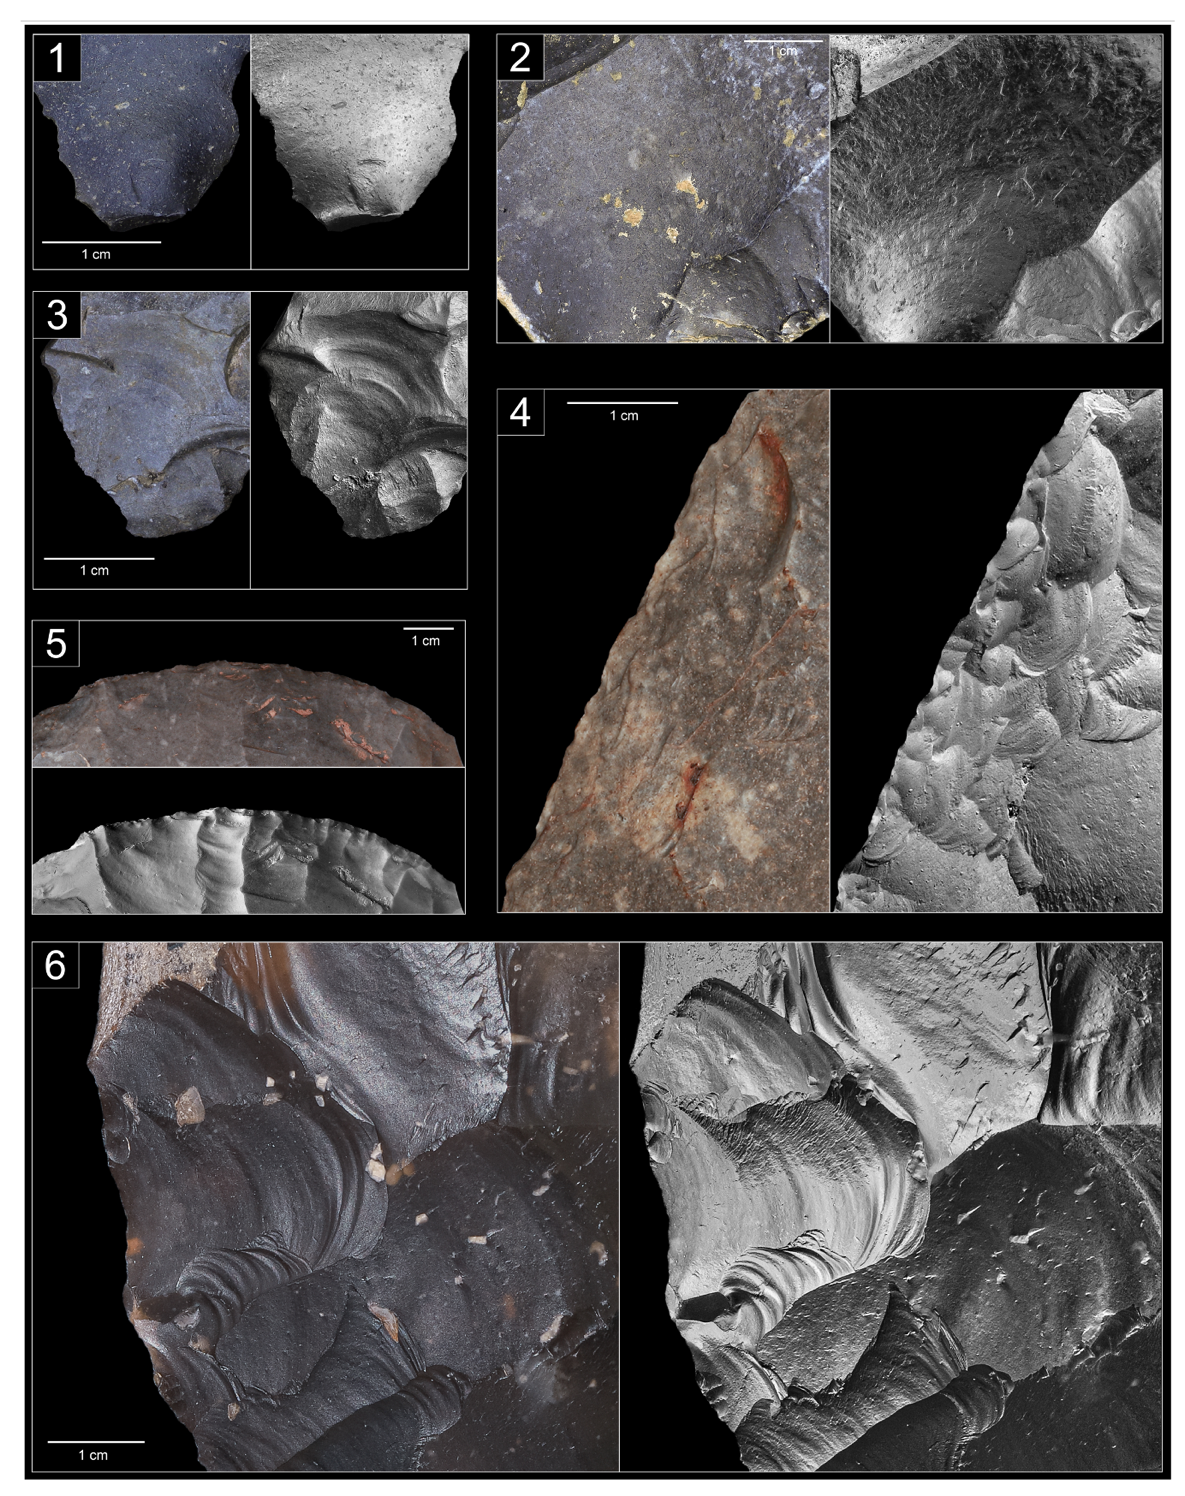
Figure 10 – Comparison of the representation of knapping marks between a standard photograph with diffuse lighting and an optimized version using the normal map from RTI. 1) Detail of the proximal part of a blade (Grotte XVI, Dordogne, France). The bulb and its bulb scars, as well as the fine lip, are clearly visible. 2) Detail of a removal on a Quina scraper (Grotte XVI, Dordogne, France). The hackles resulting from the hackle of the material stand out with great precision near the ridges, allowing the chronology of the removals to be determined. 3) Close-up view of a removal on a flake (Grotte XVI, Dordogne, France). Beyond the hackles, the ripples from the propagation of the shockwave are distinctly visible. 4 & 5) Detail of the edges of two handaxes (Durcet-Saint-Opportune, Normandy, France). RTI highlights the micro-removals linked to retouches on the edge of the tool. 6) Close-up view of an edge and multiple removals on a handaxe (Cagny-L’Épinette, Somme, France), illustrating all the mentioned features: ridges, hackles, negative bulb, ripples, cortex, retouch, etc
3.4.2.3. Visualization of artifacts based on material and patina
While RTI Normals mode enhances the grain of the material, it removes color, which can make it harder to immediately recognize a specific raw material. However, this limitation is relative, as attempting to identify raw materials from a single overview image is already difficult.
In some cases, RTI can even overcome challenges faced by conventional photography. Certain types of alterations can make an artifact difficult to analyze visually, especially when vermiculations create sinuous veins and patterns on the surface. For example, on a heavily patinated (vermiculated) transverse scraper, a conventional photograph may fail to distinguish technological details, which could be confused with the vermiculated patina. In contrast, RTI Normals mode eliminates color variations from the surface and patina, providing a homogeneous representation of relief and micro-relief present on the piece (Figure 12, no.1).
Translucent materials are generally challenging to capture using photography or scanning. Light passes through the piece, reflecting very little, which prevents surface relief from being clearly visible. Our results with relatively translucent chalcedony artifacts show that RTI effectively corrects this issue (Figure 12, no.2). Similarly, highly patinated flints, which appear completely white due to surface alteration (Caux et al., 2018), are difficult to photograph because they quickly lead to overexposure. RTI removes these reflections, producing an image with even lighting across the entire artifact (Figure 12, no.3).
The extremely high precision provided by RTI imaging allows the reader to visually assess the surface condition of artifacts. For example, RTI reveals that the ridges of a minimally altered piece exhibit fine linearity. In contrast, on pieces altered by friction, the ridges appear less well-defined and more diffuse. Furthermore, RTI eliminates reflections and highlights created by highly lustrous surfaces, making it possible to distinguish between lustre and blunting.
3.4.2.4. RTI vs. Photogrammetry
To objectively assess the differences in rendering between the two methods, a pixel-by-pixel comparison was performed between the normal maps obtained using RTI and photogrammetry. First, the RTI reference image was aligned via phototriangulation within the photogrammetric dataset. This step ensures that the normal map generated from the photogrammetric model has a central projection that is strictly comparable to that of the RTI reference image. Then, the angle formed by the two normal vectors for each pixel was calculated using the dot product, producing a map of angular differences (Figure 13).
From a practical and technical perspective, the normal map generated from the 3D model provides a satisfactory global visualization, where each removal of material can be isolated and identified. However, technological analysis is limited due to the lack of surface detail. In contrast, RTI-generated normal maps offer a more detailed representation, capturing not only the removals but also the marks left by the detachment of material (hackles), as well as undulations and subtle hinge fractures. This allows the reader to reconstruct the chronology of removals without requiring physical manipulation of the artifact. This contrast is clearly visible in the angular difference map (Figure 13). The average angular difference between the normal vectors is approximately 10 to 20° on flat surfaces, reaching up to 50° along ridges and micro-relief. It is precisely the recognition of these micro-reliefs that is crucial for a comprehensive understanding of an artifact.
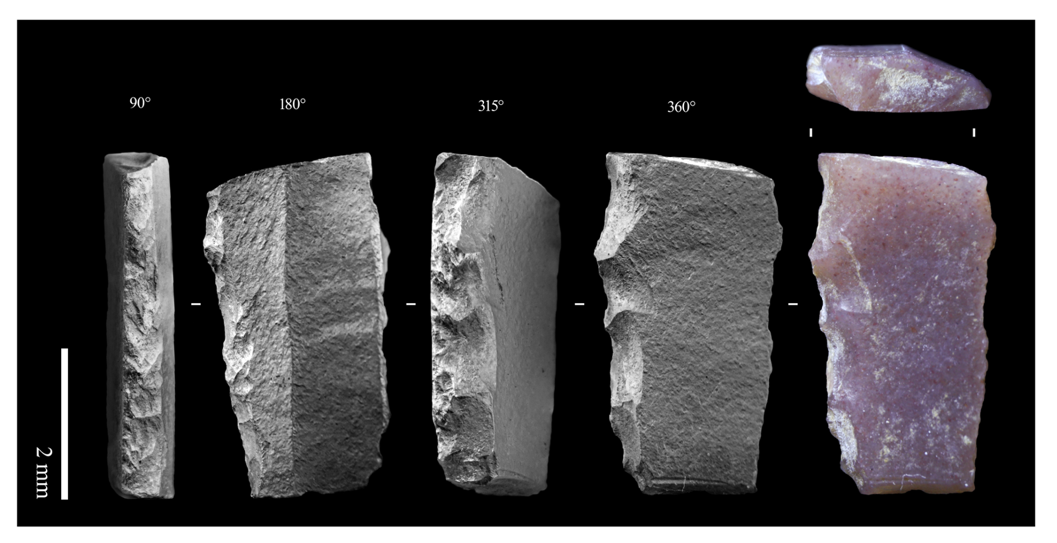
Figure 11 – Macro-RTI visualization of a small lithic artifact: Retouched bladelet, Upper Paleolithic, Grotte XVI (Dordogne, France). Binocular magnifier Leica S8 APO - x10 - Reflex camera Canon 6D Mark II - 1/20 seconds - 100 ISO.
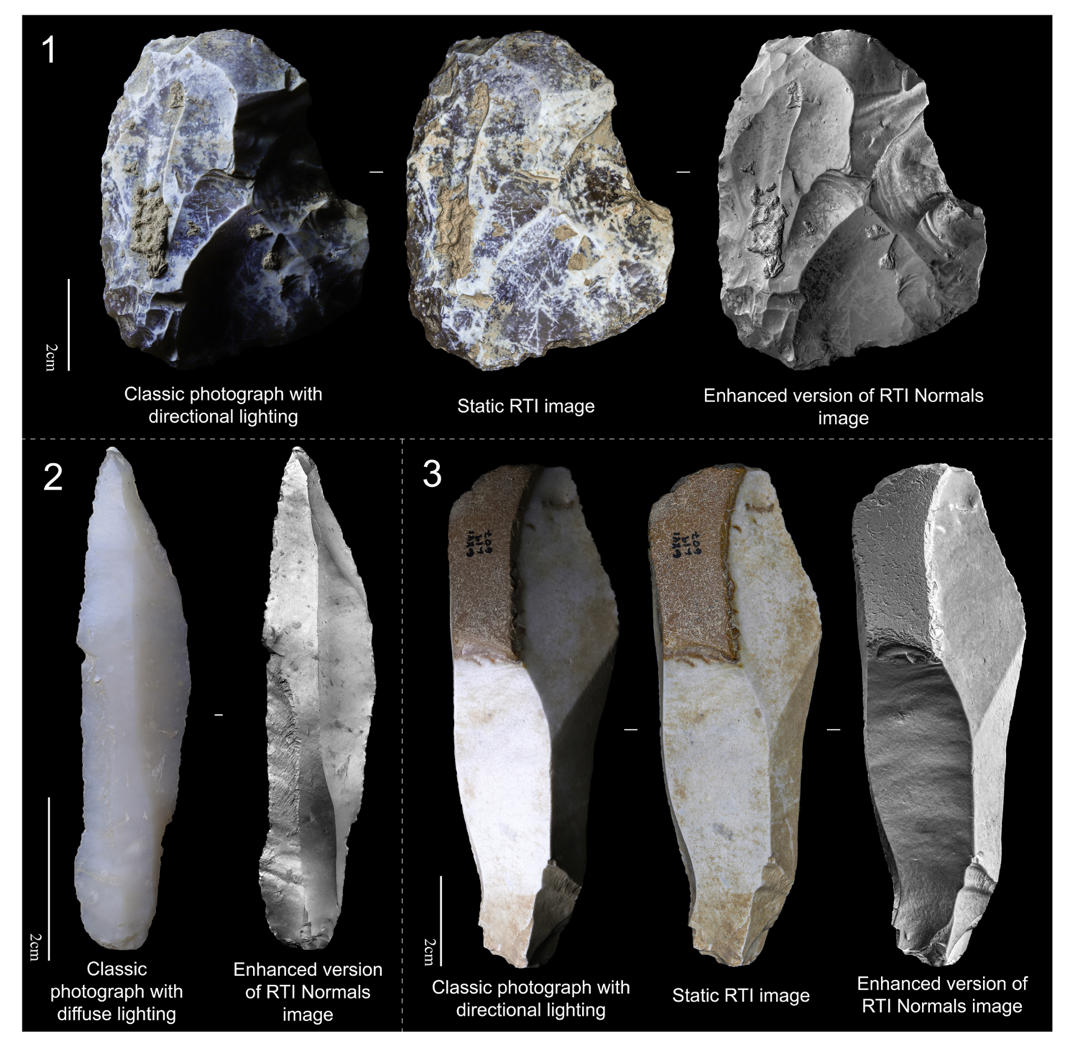
Figure 12 – Visualization of different raw materials and patinas on three pieces from Grotte XVI (Dordogne, France). 1. Scraper with vermiculated patina (Middle Paleolithic). 2. Blade in translucent chalcedony (Upper Paleolithic). 3. End-scraper on a blade with white patina (Upper Paleolithic). Settings: Reflex camera Canon 6D Mark II – Lens Canon 50mm f/1.8 – f/10 – 1/20 seconds – 100 ISO.
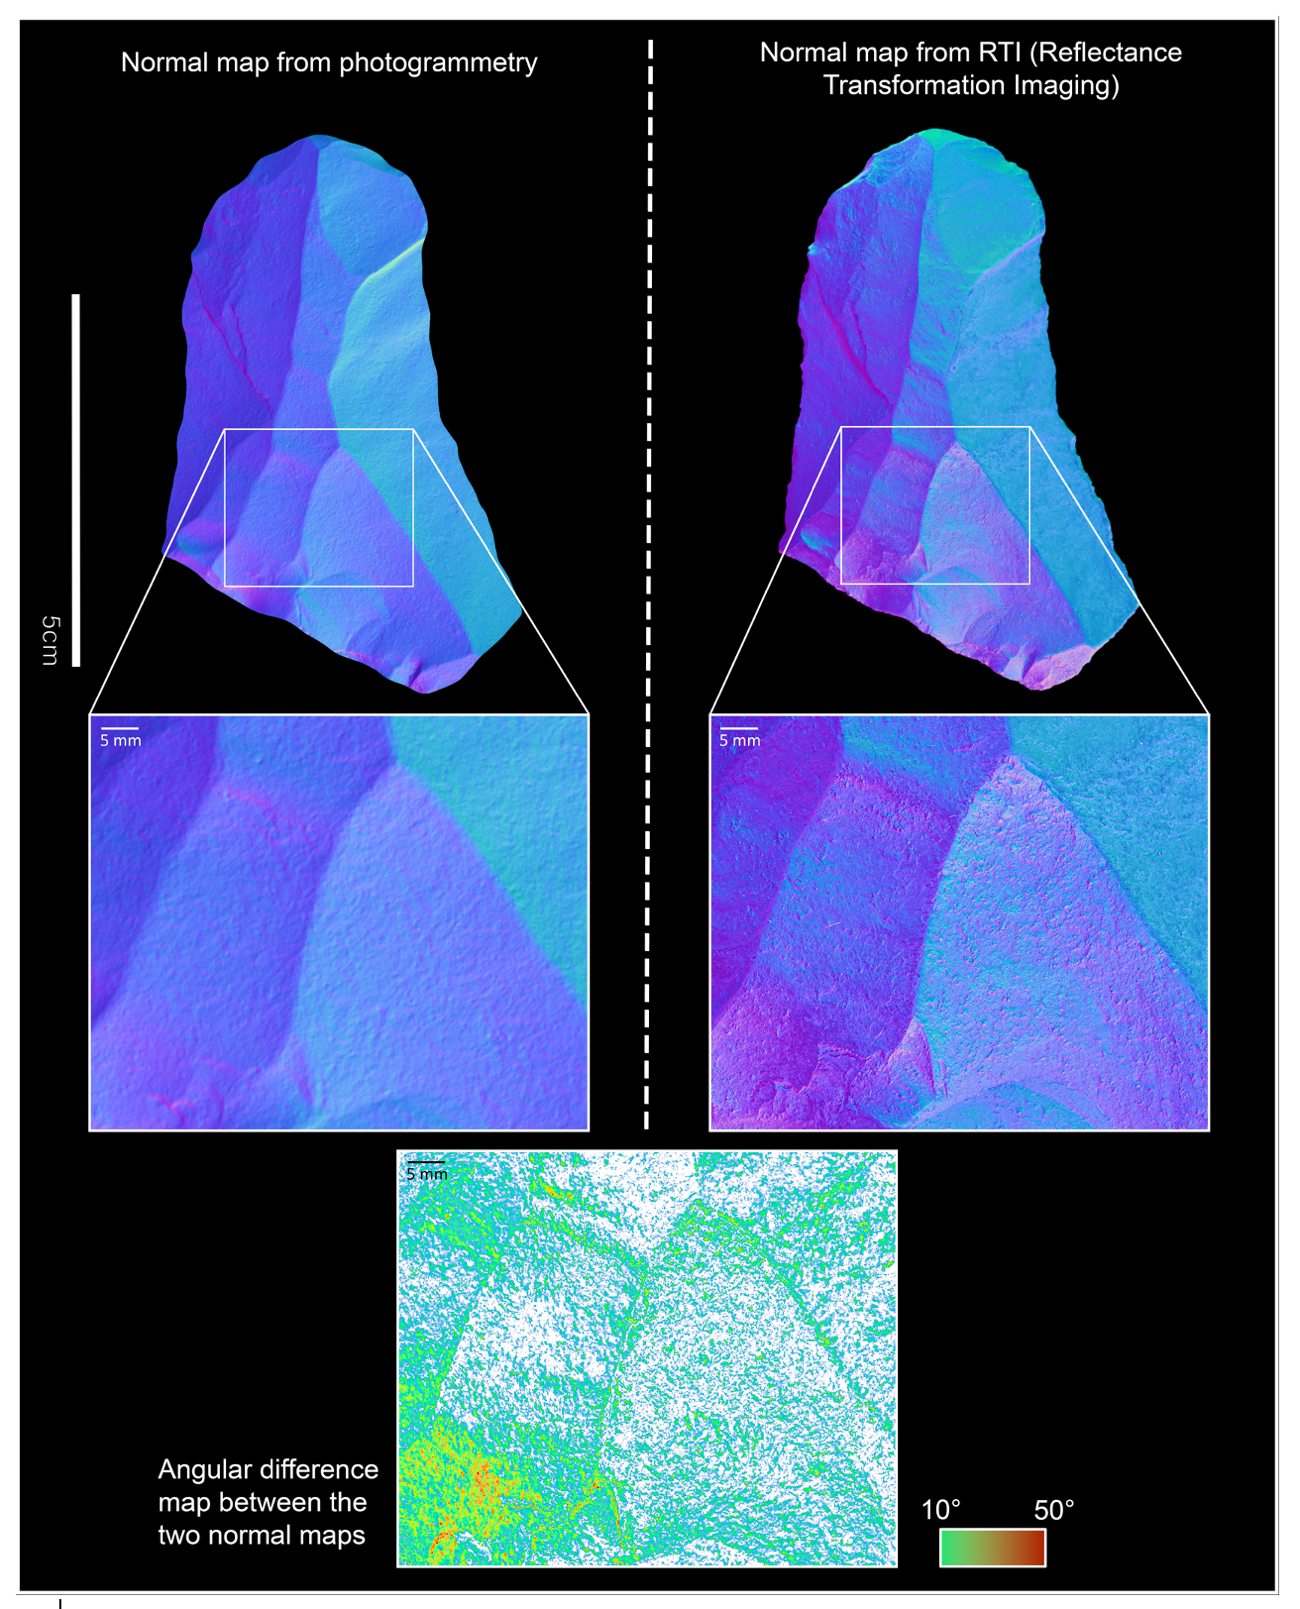
Figure 13 – Comparison of normal maps created by photogrammetry and RTI.
4. Discussion and conclusion
Evaluating the application of different methods for representing lithic industries—such as drawing, photography, 3D modeling (photogrammetry or other methods), and RTI—relies on several key criteria. These include cost, time required, ease of implementation, and quality of the final result (Table 1). However, quantifying and objectively assessing these criteria is challenging due to the numerous dependent variables.
Artifact drawings stand out due to their extremely low cost in terms of materials required. In contrast, techniques such as 3D scanning/microtomography require substantial investment, ranging from several tens of thousands to several hundred thousand euros, limiting their purchase to companies or laboratories. Photographic methods, namely RTI and photogrammetry, offer a more economical alternative as they require only a good-quality setup to produce publishable results. An equipment set up costing between €1500 and €2000 could be more than sufficient, as for us, a camera body costing around €1000, an appropriate lens (e.g., macro) at €500, along with a flash and various accessories (cables, etc.) at around €100-200, make up a functional setup. We must not forget the cost the software either, whether it is for 3D creation software or image processing software such as Photoshop/Illustrator.
Time constraints and ease of implementation are also crucial factors, especially when dealing with multiple artifacts or an entire lithic assemblage. Traditional drawings, while widely used, require significant training, even for experienced illustrators, to master the precise conventions needed for accuracy. Moreover, the time required for drawing varies significantly depending on expertise and the complexity of the object. On average, producing and digitally processing a single lithic drawing takes over an hour. Standard photography is much more accessible, requires minimal training, and enables the rapid acquisition of images (approximately 5 minutes per object), though post-processing can be time-consuming (ranging from 5 to 15 minutes).
Photogrammetry can generate accurate 3D models using more accessible and portable equipment compared to 3D scanners. Like RTI, it requires between 30 minutes and 1 hour for a complete artifact acquisition. However, while RTI processing is relatively fast (around 5 minutes), photogrammetry, despite being largely automated, requires significantly more time—typically 2 to 3 hours per model. This extended processing time limits its scalability when modeling a large number of objects. The RTI methodology outlined in this study should be sufficient to successfully create a high-quality RTI visualization.
Each method for illustrating lithic artifacts has its own advantages and limitations. Drawings, while traditional and cost-effective, are subject to interpretation and can vary in quality depending on the illustrator’s skill. Photography, while fast and accessible, can produce incomplete or interpretative results that can hinder technological analysis. Moreover, photography does not provide quantitative information about the object’s topography. 3D scanning offers highly accurate modeling but is constrained by high equipment costs, limited mobility, and expensive maintenance. Additionally, 3D scans generate very large files (ranging from 5 to 30 GB), posing questions of storage and transferability. Photogrammetry provides detailed 3D modeling at a lower cost than scanning but lacks the precision needed for analyzing fine details, making technological interpretations more challenging.
RTI, despite producing relatively large files (which can be easily compressed), appears to be the most effective method for representing individual artifacts. It offers a balanced combination of moderate acquisition time, affordable and portable equipment, and highly detailed visualizations of microrelief, significantly enhancing technological analysis (see Figures 14 and 15). Ultimately, the choice between these methods depends on the specific needs of a given project.
In many cases where 3D modeling of artifacts is not necessary for research objectives, RTI far surpasses traditional representation approaches (such as drawings and photography) while remaining relatively simple to implement. Here, we have provided the necessary information to make this method accessible to everyone. By ensuring that discussions of lithic industries are based on a large number of illustrated items, interpretations can be critically evaluated more easily based on robust visual representations of artifacts.
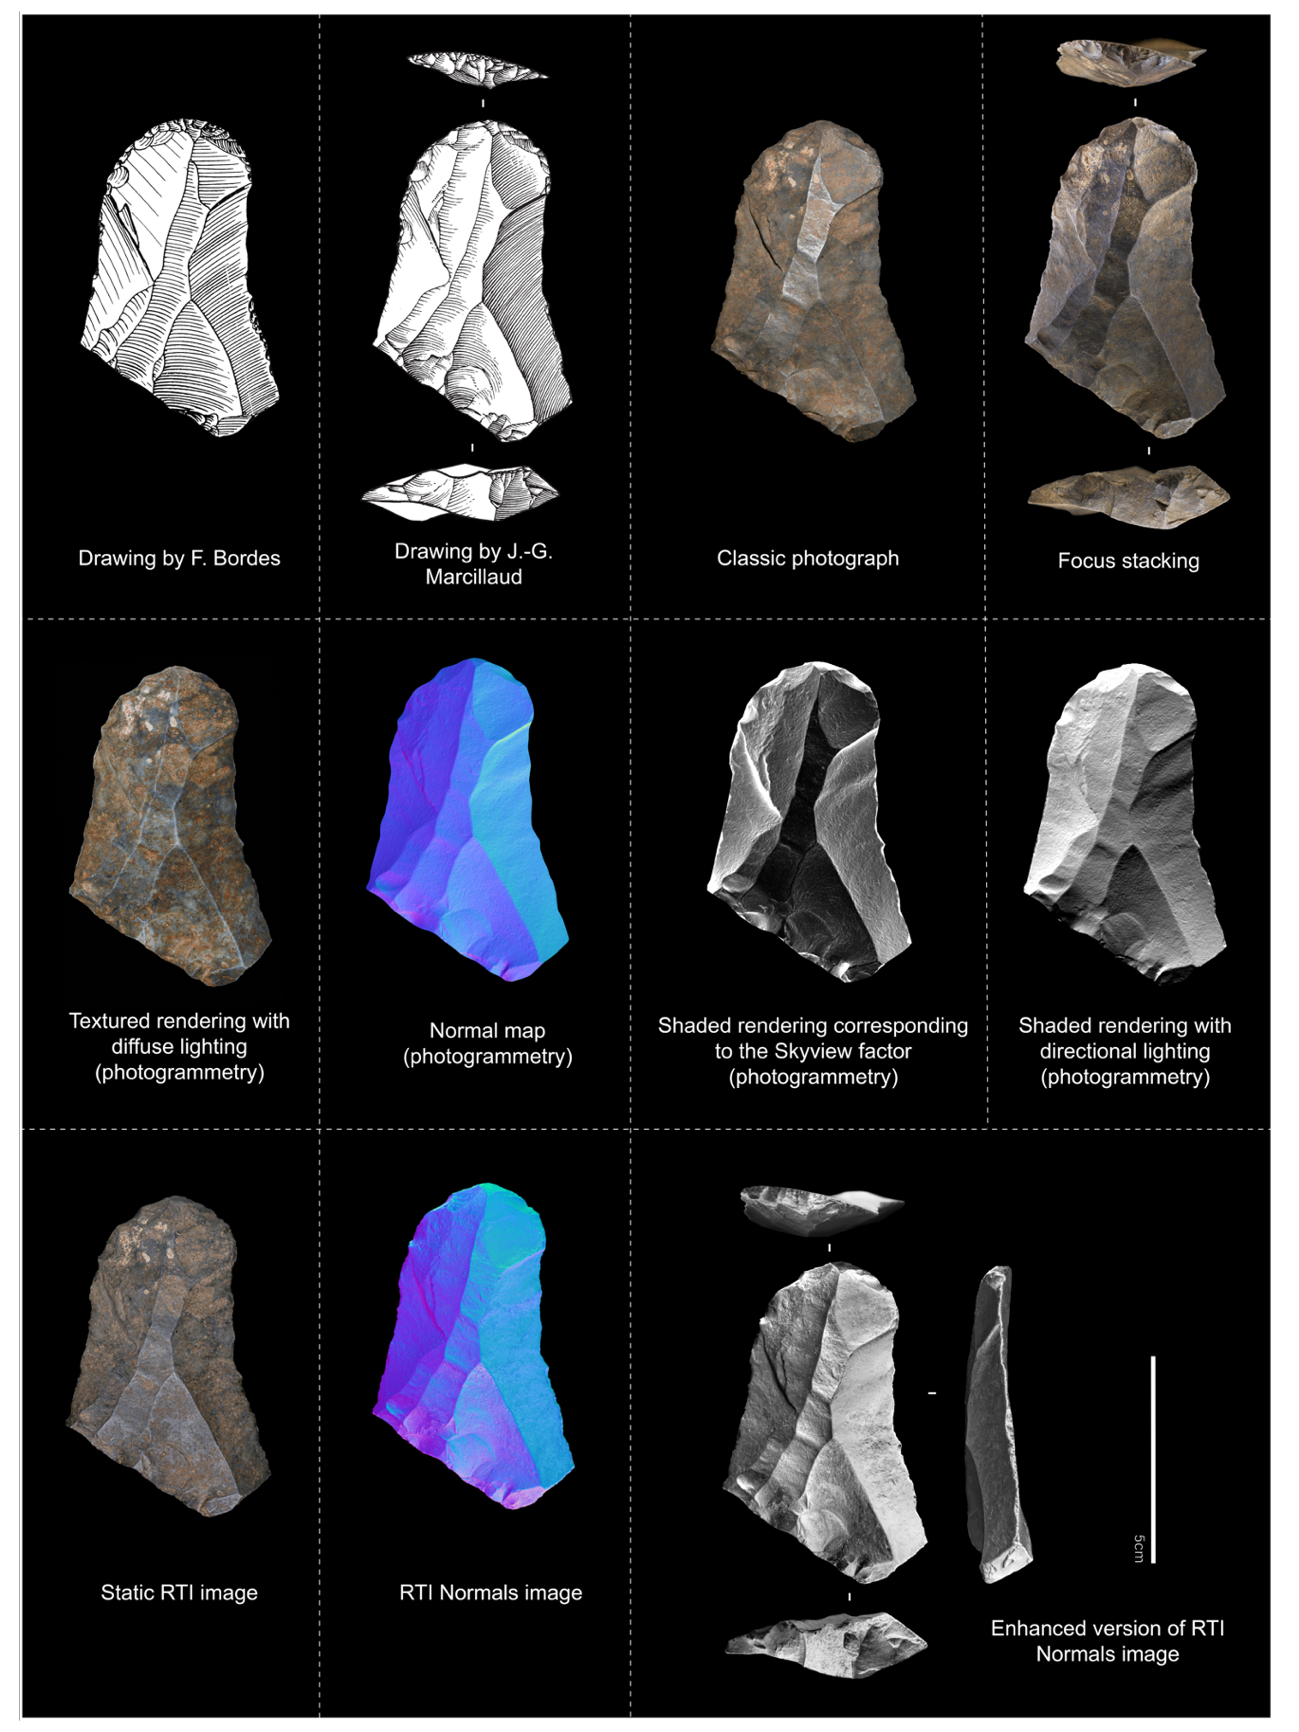
Figure 14 - Comparison of different illustration methods for the same lithic artifact – Scraper from Pech-de-l’Azé I (Paleolithic, Dordogne, France). Photography and focus stacking exif: Nikon D850 - Sigma ART 50mm f/1.4 DG HSM - f/13, 1/8s, ISO 80; 3D exif: Nikon D850 - Macro 60mm - f/14, 1/320s, ISO 10; RTI exif: Nikon D850 - Sigma ART 50mm f/1.4 DG HSM - f/11, 0.8s, ISO 80.
Table 1 - Summary table of the different criteria to consider when choosing a type of lithic illustration (non-exhaustive).
Type of approaches and associated processing | Average completion time | Ease of implementation | Cost | Advantages | Disadvantages | ||
| Acquisition | Processing | ||||||
| 2D | Drawing + Layout | Highly variable - Moderate | Difficult - Requires training | Low | Very low cost - No specialized equipment required | Time-consuming and challenging - Subject to interpretation but can be precise if well executed - Quality varies depending on the illustrator | |
| Traditional Photography + Photoshop | Fast | Fast | Accessible | Moderate | Mobile equipment - Speed - Visualization of color/texture | Often incomplete and interpretative - Difficult for technological analysis - Does not provide surface topography information - No quantitative data Optical distortion | |
| Focus Stacking Photography | Fast to moderate | Moderate (precise) | Accessible | Moderate | Mobile equipment - Increases depth of field and sharpness - Enables high-resolution fine detail - Useful for macrophotography | Sensitive to subject or camera movement (can easily generate artifacts) - Does not provide surface topography information - No quantitative data Optical distortion | |
| 2.5D | RTI + Relight, RTI Viewer, and Photoshop | Fast to moderate | Accessible | Moderate | Fast and simple acquisition and processing - Mobile equipment - Objective and precise visualization of micro-reliefs (often invisible to the naked eye) - Facilitates technological analysis | Large final file size Optical distortion | |
| 3D | 3D Scan - MicroCT Scan | Fast to moderate | Moderate to difficult - Requires training | High | 3D model - Batch acquisition of pieces | High cost - Equipment is difficult if not impossible to move - Large final file size | |
| Photogrammetry | Fast to moderate | Long | Moderate - Requires training | Moderate | 3D model - Lower cost compared to scanning - Mobile equipment | Long processing time - Large final file size - Lacks precision in fine details - Difficult technological analysis | |
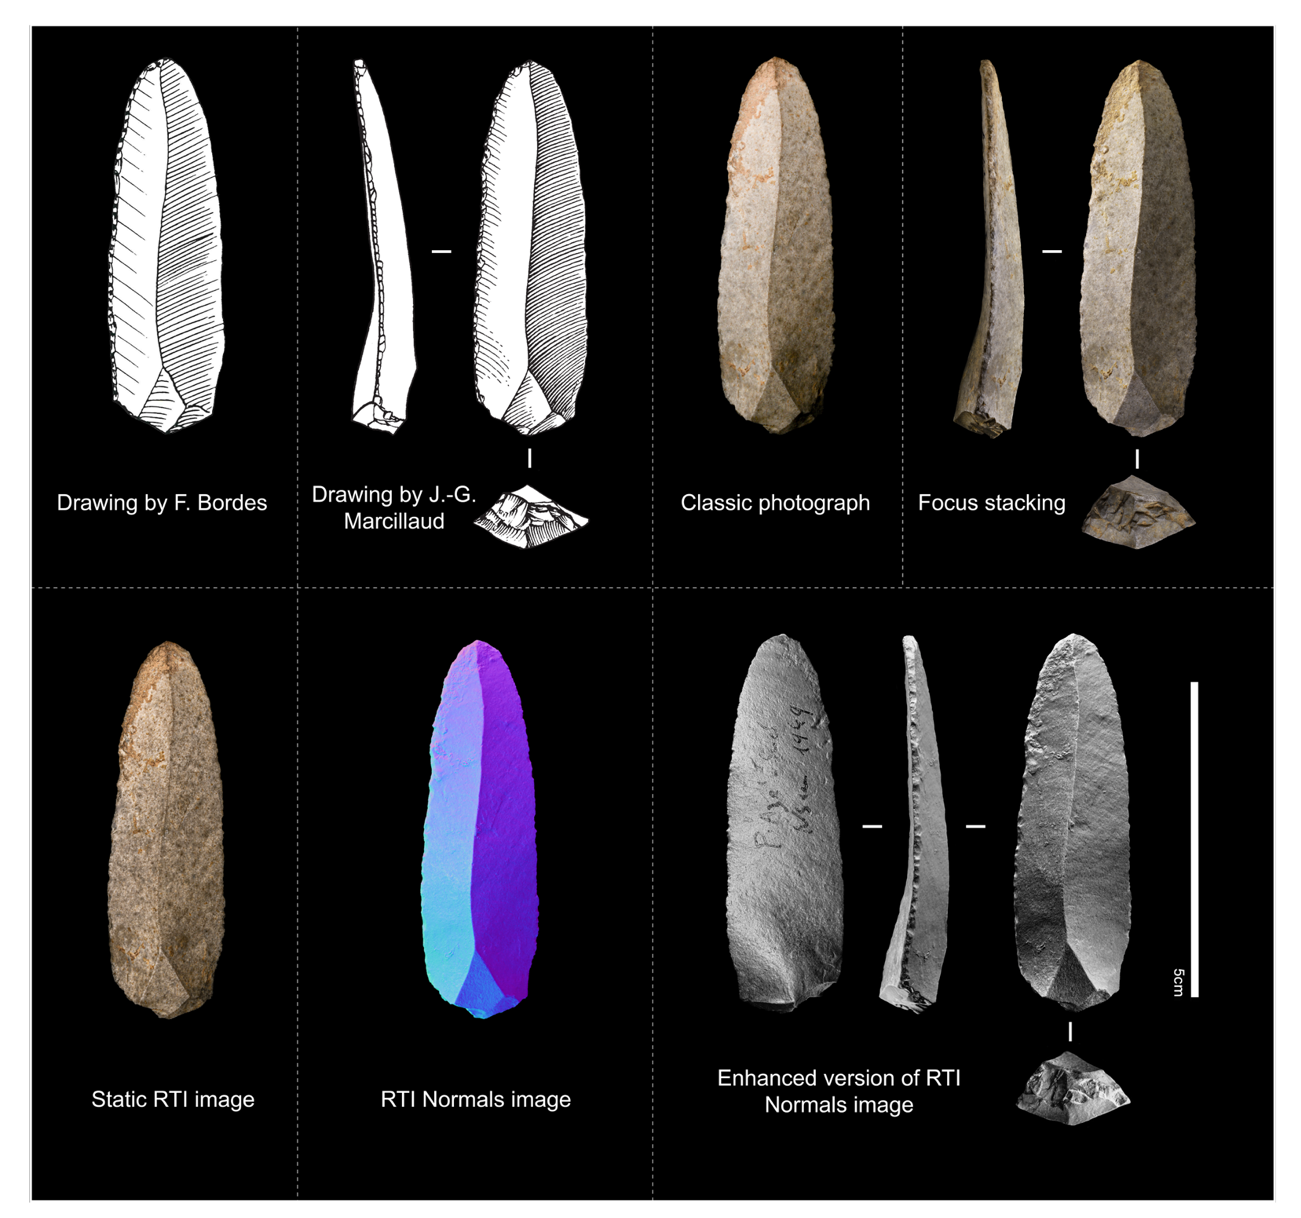
Figure 15 - Comparison of different illustration methods for the same lithic artifact – Elongated flake from Pech-de-l’Azé I (Paleolithic, Dordogne, France). Photography and focus stacking exif: Nikon D850 - Sigma ART 50mm f/1.4 DG HSM - f/13, 1/8s, ISO 80; 3D exif: Nikon D850 - Macro 60mm - f/14, 1/320s, ISO 100; RTI exif: Nikon D850 - Sigma ART 50mm f/1.4 DG HSM - f/11, 0.8s, ISO 80.
Acknowledgements
We would like to express our gratitude to the Musée National de Préhistoire des Eyzies, particularly its director, Nathalie Fourment, for granting access to its collections, which enabled the acquisition of new photographs, RTI images, and 3D models of selected pieces. We also thank the Nouvelle Aquitaine research project “ADNER” (Apprendre Différemment avec les Néandertaliens récents : humanités passées, humanités croisées au cœur de l’innovation scientifique, pédagogique et culturelle – AAPR2021-2020-11779310; 2021-26) for funding the Master’s thesis (J. Looten) directed by J.-G. Bordes and B. Gravina. The RTI images and photographs of lithic artifacts from Grotte XVI (Dordogne, France) were produced for this project, which also forms the basis of this article. Special thanks to Agnès Lamotte (HALMA – UMR 8164) for authorizing the use of diacritical sketches created as part of Julien Looten’s doctoral research thesis. We also thank Dominique Cliquet for permitting the use of RTI images from the project “Les premiers peuplements de Normandie” (Cliquet, dir.; 2024), carried out by J. Looten. Finally, we extend our gratitude to Jacques Jaubert, Gauthier Devilder, Nelson Ahmed-Delacroix, and Celia Fatcheung, the illustrators who generously shared their expertise on the challenges and time required for creating stone tool drawings.
Preprint version 4 of this article has been peer-reviewed and recommended by Peer Community In Archaeology (https://doi.org/10.24072/pci.archaeo.100605 ; Hallinan, 2025)
Funding section
No funding was received to assist with the preparation of this manuscript
Conflict of interest disclosure
The authors declare they comply with the PCI rule of having no financial conflicts of interest.
Data, script, code, and supplementary information availability
The raw data are available at: https://doi.org/10.5281/zenodo.15411558 (Looten et al., 2025)