
 CC-BY 4.0
Introduction
The ability to adapt to human modified environments is increasingly crucial because of the rapid expansion of this landscape type (Goldewijk, 2001; Liu et al., 2020; Wu et al., 2011) that individuals must cope with. Behavioral flexibility (hereafter ‘flexibility’), the ability to change behavior in the face of a changing environment by packaging information and making it available to other cognitive processes (see Mikhalevich et al., 2017 for background), is hypothesized to be a key factor in a species’ ability to successfully adapt to new environments, including human modified environments, and expand its geographic range (e.g., Lefebvre et al. 1997; Wright et al. 2010; Griffin & Guez, 2014; Chow et al. 2016; Sol & Lefebvre 2003; Sol et al. 2002). However, most tests of this hypothesis confound flexibility with the specific aspect of foraging, social, or habitat use behavior that is assumed to be involved in the particular study system, thus making a circular argument (Mikhalevich et al., 2017). For example, individuals with a larger diet breadth cannot be assumed to be the more flexible individuals unless there is direct evidence that diet breadth and flexibility are linked at the individual level. The lack of evidence linking flexibility to the particular behaviors individuals use in their environments severely limits the power of predictions about whether and how a species uses flexibility to adapt behaviorally to new environments. Flexibility is hypothesized to be particularly important when a species initially moves into an environment (Wright et al., 2010). Cross-species comparisons use foraging behaviors, including the number of novel foods eaten (often referred to as ‘innovation frequency’) and novel foraging techniques (sometimes called ‘technical innovations’) used across species as a proxy for flexibility (Lefebvre et al. 1997; Sol & Lefebvre 2003; Sol et al. 2002; Sol et al. 2005; Sol et al. 2007; Overington et al. 2009; Reader et al. 2016). The assumption that these variables are linked with flexibility has resulted in inconsistent conclusions. For example, species with more foraging innovations and, by proxy, supposedly more flexibility, are better at invading new environments (Sol et al., 2002; Sol & Lefebvre, 2003). However, resident birds are more flexible than migrants (Sol et al., 2005), and those with more foraging innovations are habitat generalists, but flexibility does not relate to diet breadth (Overington et al., 2011). Studies investigating the link between flexibility and innovation frequency at the individual level show that this relationship varies in unpredictable ways (Auersperg et al., 2011; Bond et al., 2007; Ducatez et al., 2015a; Jelbert et al., 2015; Logan et al., 2014, 2016; Logan, 2016c, 2016a; Manrique et al., 2013; Reader et al., 2011; Tebbich et al., 2010). This noise between and within species indicates that conclusions based on such flexibility proxies are uncertain (Logan et al., 2018). Further, the assumption that a food type or foraging technique is novel for a given species is biased by whether the human observer perceived the behavior to be novel, and not whether the behavior was actually novel to the species (see Logan et al., 2018 for an in depth treatment). Additionally, innovation frequency calculations are not easily replicable and it is unclear what the biological relevance of this measure is to the species in question, thus adding further evidence that measures of innovation frequency are highly noisy and uncertain (Logan et al., 2018). A less biased measure of foraging behavior involving the full repertoire, not only the pieces that are subjectively considered novel, combined with direct measures of flexibility are necessary to understand whether and how flexibility relates to adapting to new environments.
Using flexibility to adjust to new social environments is thought to have been involved in the early hominid range expansion (Rockman, 2009), and in the adaptation of people who come from one culture and move to an area where a different culture is predominant (Backmann et al., 2020). Despite an interest in understanding if flexibility varies with aspects of social life outside of the human literature, few investigations have directly explored this relationship. For example, Bond et al. (2007) found that the more social Pinyon jays (Gymnorhinus cyanocephalus) were more flexible than two less social species, Clark’s nutcrackers (Nucifraga columbiana) and California scrub jays (Aphelocoma californica). This indicates that more social interactions might be implicated in requiring more flexibility. While much is known about social learning of behaviors (Laland & Evans, 2017), we do not consider this relevant to understanding a species’ flexibility because it is unknown whether flexibility itself is socially learnable. Investigations into the relationship between flexibility and sociality are wide open for discoveries about whether, for example, individuals who are more flexible form stronger bonds or bonds with more individuals or are more likely to be immigrants from other areas.
Here, we directly investigate the relationship between flexibility and foraging, social, and habitat use behaviors in two populations (Tempe, Arizona and Woodland, California) of great-tailed grackles (hereafter ‘grackles’; Quiscalus mexicanus). Grackles are flexible (Logan, 2016a; Logan et al., 2023) birds who are originally from Central America and have rapidly expanded their geographic range across North America since the late 1800s (Wehtje, 2003). Between 1970 and 2019, they expanded their habitat breadth to include more urban and arid environments, indicating their success in human modified environments (Summers et al., 2023). We directly measured flexibility in grackles in a previous article (Logan et al., 2023) using two methods and we use the flexibility data from that article here. The first is a common method: reversal learning of a color preference (Lea et al., 2020). Two color choices are available, but only one color always contains a hidden food reward. After the individual learns to prefer the rewarded color, the food is then available only in the previously unrewarded color. The speed with which the individual changes their color preference is the measure of flexibility, with the faster individuals being more flexible. Both populations experienced one reversal and a subset of individuals within the Arizona population were manipulated to be more flexible through serial reversal learning. The second measure of flexibility used solution switching on a puzzlebox. The puzzlebox (multiaccess box) had four different ways of obtaining food rewards. Once a bird became proficient at solving one way, that locus was rendered non-functional and the number of seconds it took them to attempt a different locus served as the flexibility measure. All individuals were then released back to the wild where their foraging, social, and habitat use behaviors were observed. We aim to determine whether the more behaviorally flexible grackles have more flexible foraging behavior (i.e., eat a larger number of different foods, use a wider variety of foraging techniques), are more flexible in their social relationships (i.e., have more or stronger social bonds particularly with less related individuals, disperse farther from their natal area), and are more flexible in their habitat use (i.e., are found in more diverse habitat types). Results will allow us to determine if, as predicted by our hypotheses and cross-species correlational data, individual level variation in flexibility is linked with diet breadth, foraging proficiency, social interactions, habitat use, and movement into new geographic areas.
Preregistered Hypotheses
H1: Behavioral flexibility (see Mikhalevich et al., 2017 for a detailed definition) is related to foraging behavior (measured with focal follows using this ethogram) in wild individuals (after their release from the aviaries). We measure flexibility in aviaries using two paradigms: reversal learning (where grackles must learn to prefer one of two options that contain food and then reverse this preference) and switching between options on a multiaccess box (where grackles must learn to switch to a new option, out of four available options, when an option becomes non-functional). We expect this species to be behaviorally flexible because they are fast at reversal learning (Logan, 2016b), they often encounter human-made “puzzle boxes” in the wild as they attempt to open packaging to access food when digging through garbage cans and eating at outdoor cafes, and they may track resources across time and space (Rodrigo et al., 2021). Foraging behavior is considered central to the rapid geographic range expansion of this species, and it is thought that they have been so successful by following human urban and agricultural corridors (Peer, 2011; Wehtje, 2003). Therefore, as humans continue to modify landscapes, this increases the amount of suitable grackle habitat.
Prediction 1: Individuals that are faster to reverse preferences on a reversal learning task and who also have lower latencies to switch to solving new loci after previously solved loci become unavailable (multiaccess box) will eat a larger number of different foods and use a wider variety of foraging techniques in the wild, validating the cross-species correlational finding that technique breadth (Overington et al., 2009) and diet breadth (Ducatez et al., 2015b) are associated with flexibility.
P1 alternative 1: If there is no correlation, this suggests that flexibility as we measure it represents a trait that is not related to the number of foods eaten and foraging techniques used. Flexibility may not necessarily be associated with diet and foraging technique breadth because flexibility could be constrained in a foraging context due to social competition (e.g., subordinates are outcompeted while foraging and thus try new foods and techniques) or ecological limitations (e.g., constrained by what is available). Additional research would be required to determine the factors that might constrain foraging behavior.
P1 alternative 2: If there is a negative correlation between flexibility and the number of different foods eaten, this might indicate that the more flexible individuals target particular food items. If this prediction is supported, we will conduct an additional analysis to examine what food types the more flexible grackles eat and whether these food types are potentially more valuable (measured as having more calories).
P1 alternative 3: If there is a negative correlation between flexibility and the number of foraging techniques, this could indicate that the more flexible individuals use particular, and potentially more effective, techniques.
P2: Individuals whose flexibility has been increased experimentally will consume a larger number of foods and use more foraging techniques (measured with focal follows) than individuals whose flexibility has not been manipulated. This would further validate that flexibility is related to diet breadth and foraging techniques.
P2 alternative 1: If the flexibility manipulation does not work in that those individuals in the experimental condition do not decrease their reversal learning speeds more than control individuals, then we will rely on the general individual variation in flexibility and how it relates to foraging in the wild (as in P1).
P3: The proportion of a grackle’s diet that is human foods and the proportion of their foraging techniques involving human foods is higher for the more flexible individuals, who will consistently occur in locations closer to known outdoor human food locations like picnic areas and outdoor café seating (measured as the repeatability of the individual’s distance from cafes across multiple separate focal follows) OR who will occupy a home range that contains more outdoor human food locations. For the diet, this is potentially due to A) having stayed in their parent’s home range (i.e., they eat human food because it happens to be more prevalent in their home range than in other home ranges; local specialization) or B) because these individuals move around to seek out such opportunities (potentially seeking out habitat edges within their population). For the foraging techniques, this is potentially due to human foods and their packaging changing at a faster rate than natural foods and prey items and their accessibility. The foods eaten and the foraging techniques used will be recorded during focal follows. Because this species is highly associated with human-modified landscapes, it is likely that consuming human foods is part of the reason for this association, and that flexible individuals are better at solving these human-made “puzzle boxes” to access food.
P3 alternative 1: There is no correlation between an individual’s flexibility and the proportion of human foods in their diet, potentially because A) their daily range sizes encompass many different food resources, including human foods (though they are likely not specialized on human foods), and B) some less flexible individuals might specialize on human foods.
P3 alternative 2: There is a negative correlation between an individual’s flexibility and the proportion of human foods in their diet, potentially because some of the less flexible individuals might specialize on human foods, thus increasing their consumption above that of the more flexible individuals.
H2: Behavioral flexibility (see Mikhalevich et al., 2017 for a detailed definition) is related to social behavior (measured year-round with focal follows using the ethogram in Supplementary Material 4; Logan, 2025) in wild individuals. Flexibility is measured in aviaries using two paradigms: reversal learning and switching between options on a multiaccess box. To give an example of the types of social relationships this sexually dimorphic species engages in, they forage and roost socially (Selander and Giller 1961) and they have a non-faithful-female frank polygynous mating system (Johnson et al. 2000). In terms of male social relationships, Johnson et al. (2000) found during the breeding season in a population in Texas that one or more territorial males defend a territory with several nests from females, that non-territory holding resident males will queue to gain access to a territory, and that transient males move from colony to colony. There could be varying needs for males to manage their relationships with each other in breeding and non breeding seasons, and flexibility could potentially play a role in such management.
Prediction 4: Flexible individuals are more likely to have a greater number of bonds OR stronger bonds with others, in particular with individuals who are less related, potentially because they are better able to adjust their behavior to that of an affiliate. Social bonds are measured using the focal follow method to sample affiliative and aggressive behaviors.
P4 alternative 1: Individual flexibility is not related to the number or strength of social bonds, potentially because all individuals are able to form bonds with like individuals, including the less flexible individuals.
P4 alternative 2: Flexible individuals may have fewer affiliates or be less likely to regularly affiliate with the same individuals, potentially because they frequently change their behavior and are difficult to associate with. We are not able to test this alternative in this study, but could propose experimental designs for future research if this alternative is supported by the data.
H3: Individuals that are behaviorally flexible (see Mikhalevich et al., 2017 for a detailed definition) will differ in their use of microhabitats within human-modified landscapes (substrate qualification during each focal follow), but the macrohabitat (square kilometer) of each population will not differ in human population density (measured with a GPS point for each focal follow after their release from the aviaries; we measure microhabitat types according to the last substrate the focal individual was seen on at the end of the focal follow: grass, gravel (rock), tree, building, dumpster, shrub, ground, miscellaneous human substrate. Flexibility is measured in aviaries using two paradigms: reversal learning and switching between options on a multiaccess box. Although we were only able to find this species in association with human-modified landscapes based on eBird sightings (i.e., there appear to be no forest-based populations), individuals could use these landscapes in a variety of ways. For example, they could specialize on particular foods or at particular types of locations (e.g., foraging exclusively at cafes or in grassy areas), they could generalize across all foods and location types, or they might fall somewhere in between these extremes.
Prediction 5: Individuals immigrating into a population are more likely to be flexible, potentially because they need to learn how to obtain resources in an unfamiliar area. Immigrants are individuals who carry many genetic variants (identified using ddRADseq) that are not found in other individuals in this population.
P5 alternative: Individuals immigrating into a population are not more likely to be flexible, potentially because the human urban environment is comparable across landscapes.
P6: Flexible individuals will be found more regularly in a wider diversity of microhabitats (human-modified substrates including dumpsters, buildings, and miscellaneous human substrate; or natural substrates including grass, shrubs, trees, rock, and ground) during focal follows.
P6 alternative: Flexibility is not associated with presence in diverse microhabitats because the more flexible individuals might specialize in specific foraging strategies best suited to particular microhabitats.
P7: There will be no difference in human population density among the sites for the grackle populations because all grackle populations are highly associated with human-modified landscapes. Human population density per square mile data will be obtained from census information (US census bureau: https://www.census.gov/quickfacts/fact/note/US/LND110210)
P8: Flexible individuals will not be associated with presence in diverse microhabitats, not necessarily because they are specialists or generalists in specific foraging strategies, but rather because they may focus on high quality resources in particular habitat types. If this prediction is supported, we will conduct an additional analysis to examine the proportion of focal follows associated with a particular microhabitat type, which will allow us to determine whether the more flexible individuals are associated with particular microhabitats more than the less flexible individuals.
Material and methods
We first describe the changes we made from our original plans, then we describe the sampling methods to measure behavior, and finally outline the analyses we used for each prediction.
Updates and changes to the preregistration
This study began as a preregistration, which received in principle acceptance at PCI Ecology in 2019: https://github.com/corinalogan/grackles/blob/master/Files/Preregistrations/g_flexforagingPassedPreStudyPeerReviewOn6Aug2019.pdf. The preregistration contains the pre-planned analyses. Here, we first describe the rationale for the ways in which we conducted the study differently from the plan, and then summarize the methods we used to obtain the results.
Changes made in the middle of data collection
Because all models only included aviary-tested birds for our analyses, Condition (independent variable 6), which indicates whether a bird is aviary-tested or not aviary tested, was removed. We were only planning to use the Condition variable to compare foraging behavior, and not flexibility as it relates to foraging, between the aviary tested and non aviary tested birds, however there was not a large enough sample of focal follows with foraging data on non aviary tested birds to run this comparison (13 July 2022)
In the preregistration, we propose multiple measures of flexibility and state that the measure Flexibility 4 replaces the others if it is based on the better model as analyzed in a separate article. We found that Flexibility 4 is based on the better model (Blaisdell et al., 2021) and we used the values for this measure for the individuals in the current article that were generated in an improved version of the model by Lukas et al. (2022). Therefore, in the current article, we used only Flexibility 4 and not Flexibility 1 (both reflect performance in the color tube reversal experiment).
In Logan et al. (2023), we discovered that the flexibility measures of the number of trials to reverse a preference in the color tube experiment and the latency to attempt to solve a new locus on the multiaccess box did not correlate with each other. Therefore, we analyzed flexibility performance (latency to switch) on the multiaccess box separately, as previously planned. However, we did not implement a multiaccess box latency analysis for P2 because it is a direct comparison of the birds in the control and manipulated groups in the reversal learning experiment.
In Logan et al. (2023), we found that it is unnecessary and actually confounding to include the flexibility manipulation (manipulated or control) as an independent variable in the models when the Flexibility 4 variable is already included. This is because we used data from the last reversal the individual participated in (reversal 1 for control birds and the last reversal in the serial reversals for the manipulated birds), which already accounts for the influence the flexibility manipulation had on the birds in the manipulated condition. Therefore, we removed the flexibility manipulation condition variable from the models in the current article. (13 July 2022)
Initially, the dependent variables for P2 calculated the number of different foods eaten and the number of foraging techniques used in the first X minutes of a focal follow. To standardize observation time across individuals such that all individuals would have the same amount of total observation time, X minutes was the total observation time using the individual with the lowest sum across all individuals. As we started to clean the data and prepare it for analysis, we noticed three individuals had no focal follows (sum focal time = 0 min) and the next lowest sum focal time was 497 seconds. The average sum focal time across all 38 individuals was 3024 seconds, which means that we would have excluded the majority of the data when using the originally prescribed calculation of the dependent variables. Therefore, we changed this to using the number of different foods eaten and the number of foraging techniques used by an individual as the response variable and included the total observation time per individual as an explanatory variable (which, in this case is more like a random variable in a GLMM, but it is treated differently in Bayesian analyses). Including time in this way allows us to derive the slope of the expected number of foraging techniques a bird would have if it had been observed for a given amount of time. This allows the model to assess whether, after we account for the differences in the amount of time that different individuals have been observed, manipulated individuals deviate more or less from the expected values than control individuals. The analyses for the P1 and P2 dependent variables accommodate this change by adjusting from a Poisson to a binomial distribution. (3 August 2022 & 17 May 2023)
The dependent variables for P1 were also planned as calculating the number of different foods eaten and the number of foraging techniques used in the first X minutes of a focal follow. However, we removed observation time and replaced it with the total number of food events observed per bird. The number of times we observed a bird eat is an upper bound on the number of food types and foraging techniques we can record for a bird (e.g., if we observed all individuals take only one food item, then differences in flexibility could not explain differences in the number of foods taken or foraging techniques used because all individuals would have the same value). Therefore, we must account for this in the model by adding the number of food events observed per bird.
We omitted observation time from the models in P3 that had the proportion of human foods as the dependent variable because the fact that it is a proportion already accounts for overall differences in observation time.
We originally planned to collect data from three field sites: the middle of the northern expanding edge (Tempe, Arizona), on the northern expanding edge (Woodland, California), and at a site in the center of their original range (Central America). We were not able to run the Central American site because the research station we were planning on using as the base for the site was exposed for having decades of sexual abuse toward women. We did not feel comfortable being at that station or bringing our business there, and it was too late to find another site because they take years to set up. Therefore, we have data from only two field sites and not three. This also means our sample size is not >200 grackles as originally planned. Our sample size is 95 grackles with focal follow data (69 in Arizona and 26 in California). We planned on bringing at least 60 of these grackles (across all three field sites) into the aviaries for behavioral choice tests. Of the 55 (24 in Arizona and 32 in California) grackles we brought into the aviaries, 39 (20 in Arizona and 19 in California) completed their reversal learning experiment. We stopped collecting data in December 2022 when the California field site’s data collection was complete.
Changes made after data collection, before data analysis
As originally planned, we read McElreath (2018) and changed all of the analyses from MCMCglmms or glms to bespoke Bayesian models. In doing so, this removed the need to conduct the preplanned data checking for overdispersion, underdispersion, zero-inflation, and heteroscedasticity. This is because the Bayesian models are already informed by the constraints of the hypothesis and experiment before they are run and, in many cases, we run simulations of the Bayesian models before running them on the actual data and we modify the models until they perform in a way that allows all feasible relationships, but not impossible relationships.
Changes made after data collection, in the middle of data analysis
We removed the random effect of ID from the models because there is only one data point per individual in the analyses. It was an error on our part to include it in the preregistration. (27 April 2023). Reassuringly, the interobserver reliability scores were very high (see Supplementary Material 1; Logan, 2025), indicating there was no difference between experimenters.
P4: We only used the social association data from the nonbreeding season even though we were not able to conduct a comparison between the seasons to determine whether they were similar or different. This is because, after we filtered the raw data to include only individuals in the behavioral flexibility test in the aviaries and with a minimum of 2 focal follows per season, we were left with only 7 interaction data points in the breeding season and there was no variability in this subset of data. This small sample precludes us from comparing social network metrics across seasons, and therefore we use only the nonbreeding season social association data.
P6: We removed population (random variable) because we found no average differences in the flexibility components (phi and lambda) between the Arizona and California populations in Logan et al. (2023). Also, it should not be included in the analysis because it is not directly part of the prediction, which is something we learned after taking Richard McElreath’s Statistical Rethinking course. We originally planned to run models with a Poisson distribution, however we used a Normal distribution (with a log link) because the Shannon Diversity Index is not a count, but more similar to a sum.
Ability to detect actual effects: in the preregistration, we stated, “We will use Bayesian analyses to estimate our likely confidence in the results given simulated data. We will revise this preregistration to include these new analyses before conducting the planned analyses on our actual data. Based on the simulations, we might adapt the number of focal follows per individual or decide to collect much more data just with the aviary-tested birds to increase the amount of information per individual.” It ended up taking 5 years of data collection to meet our pre-stated minimum sample size and we stopped data collection after meeting the minimum. At this point, we had not yet had time to build the models and run simulations because the field work was so time intensive. Therefore, we used Bayesian simulation analyses to determine, given our sample size for a given prediction, how large of an effect can we expect to reliably detect.
P4: We originally planned to conduct social network permutations to determine whether individuals were associating non-randomly based on flexibility, however we ended up removing them. We cannot do a permutation that fully reflects the data that we collected because there was variation in how often individuals were observed and whether observations included unbanded birds, which arose from the difficulty in trapping grackles to band, and then finding and following the banded grackles. A permutation randomly redistributes values, but in this case, we cannot randomly redistribute values because there is variation in the actual data. For example, from the perspective of a focal bird that is banded, an unbanded partner that is observed once is a unique partner. However, there is no way to determine whether an unbanded bird observed with this focal individual is the same as an unbanded bird observed with a different focal individual. For the permutations, it is critically important how many birds there are in the network because this will influence the expected number of bonds that a permuted individual can expect to engage in. Permutations only work if all individuals are known and are observed for roughly the same amount of time, and even still they might not account for the non-independence in the data (Hart et al., 2023; Ross et al., 2022).
Trapping
We used three different trapping techniques to capture grackles in the wild for transfer to the aviaries, including mist nets, walk-in traps, and bownets. Use of a particular trapping method depended on trapping location (e.g., mist nests required ample space for set up), time of day (e.g., mist nests are not as effective past dawn or before dusk), and individual grackle behavior. Some of these trapping methods decreased the likelihood of a selection bias for exploratory and bold individuals because grackles cannot see the traps (i.e., mist nets). For the visible trapping methods, we conducted extensive trap habituation to increase the chance of catching the individuals that were initially more cautious approaching these traps. To lure birds to the trapping location, we habituated birds to eating a mix of crackers, mealworms, and bird seed in the immediate vicinity of the trap. Following capture of a grackle, the bird was either processed immediately on site if they were not slated to undergo aviary testing, or the bird was transported to the aviary location for subsequent processing. Processing involved collecting biometric measurements, feathers, and blood. The latter was used to extract DNA and determine relatedness (P4, P5).
Reversal Learning
We used reversal learning to measure grackle behavioral flexibility. Briefly, we trained grackles to search in one of two differently colored containers for food (Figure SM5.1; Logan, 2025). After grackles showed a significant preference for one color (minimum of 17 out of 20 correct choices), we switched the location of the food to the container of the other color. We measured behavioral flexibility as the number of trials it takes grackles to switch their preference and search in the container of the other color on a minimum of 17 out of 20 trials (a reversal). Grackles in Arizona were randomly assigned to one of two groups: a flexibility manipulation group where they received serial reversals until they switched their preference quickly enough to meet the experiment passing criterion (form a preference in 2 sequential reversals in 50 or fewer trials), and a control group that received one reversal and then a similar number of trials as the manipulation group, but with two yellow tubes that both contained food. See the protocol for serial reversal learning in Supplementary Material A (Logan, 2025).
Multiaccess Boxes
We used two different multiaccess boxes to generate additional measures of grackle flexibility. All grackles were given time to habituate to the multiaccess boxes prior to testing. We set up the multiaccess boxes in the aviary of each grackle with food in and around each box in the days prior to testing. At this point, all loci were absent or fixed in open, non-functional positions to prevent early learning of how to solve loci. We began testing when the grackle was eating comfortably from the multiaccess box. For each multiaccess box, the goal was to measure how quickly they learned to solve each locus, and then how quickly they attempted to solve a new locus when a previously solved locus was rendered non-functional. We measured the latency in seconds until the grackle attempted a new locus after a previously solved locus was made non-functional (solution switching). See protocols for multiaccess box habituation and testing in Supplementary Material A (Logan, 2025).
Plastic multiaccess box: This apparatus consisted of a box with transparent plastic walls (Figure SM5.1; Logan, 2025). There was a pedestal within the box where the food was placed and 4 different options (loci) set within the walls for accessing the food. One locus was a window that, when opened, allowed the grackle to reach in to grab the food. The second locus was a shovel that the food was placed on such that, when turned, the food fell from the pedestal and rolled out of the box. The third locus was a string attached to a tab that the food was placed on such that, when pulled, the food fell from the pedestal and rolled out of the box. The last locus was a horizontal stick that, when pushed, shoved the food off the pedestal such that it rolled out of the box. A trial ended when a grackle used a locus to retrieve the food item or after 10 min, whichever came first. If the grackle had not yet solved a locus, but was on the ground at 10 min, they were given an extra 5 min to interact. We reset the box out of view of the grackle and then began the next trial. To pass criterion for a locus, the grackle had to get food out of the box using only functional actions (i.e., they used a functional behavior to retrieve the food) in 2 consecutive sessions, or solving in 9/10 trials within a session, or in 8 consecutive trials in 1 session. After passing criterion, the locus is made non-functional to encourage the grackle to interact with the other loci.
Wooden multiaccess box: This apparatus consisted of a natural log that contained 4 compartments (loci) covered by transparent plastic doors (Figure SM5.1; Logan, 2025). Each door opened in a different way (open upward like a hatch, out to the side like a car door, pull out like a drawer, or push in). During testing, all doors were closed and food was placed in each locus. A trial ended when the grackle opened a door or after 10 min (or 15 min if the grackle was on the ground at 10 min). After solving a locus, the experimenter re-baited that compartment and closed the locus door out of view of the grackle, and the next trial began. After a grackle solved one locus 3 times, that door was fixed in the open position and the compartment left empty to encourage the grackle to attempt the other loci.
Radio Telemetry
We attached radio transmitter tags to most grackles released from the aviaries upon completion of their test battery. Radio tags allowed us to relocate and track released grackles to collect space use data and foraging and social behavior data. We used three different kinds of radio transmitters, namely Lotek (model: Pip Ag386, https://www.lotek.com/, Seattle, WA, USA), Holohil (model: BD-2, https://www.holohil.com/, Carp, Ontario, Canada), and ATS (model: A2455, https://atstrack.com/, Isanti, MN, USA). Holohil and ATS tags were used on birds that could not accommodate the heavier Lotek tags, given that the weight of a radio tag must not exceed 3% of the bird’s total body weight to avoid hindering the animal’s movement behavior (Barron et al., 2010; Hallworth & Marra, 2015; Murray & Fuller, 2000). We used the leg-loop harness method of attaching radio transmitters to the grackles in an effort to prolong the amount of time the tag stays affixed to the bird’s body (Rappole & Tipton, 1991). Before releasing the grackles back into the wild, we programmed each tag’s unique frequency into our Yagi*brand radio receiver and annotated which frequency corresponded to which individual. This allowed us to quickly find and track birds upon release to the site at which they were initially caught. Immediately following the release of the radio-tagged grackles, each bird was followed for 30 min to make sure they behaved normally. In the days following release, the radio receiver and antenna were used to relocate tagged individuals, together with the visual confirmation of color bands, for subsequent GPX tracking and focal follows. See full protocol for Radio Telemetry in Supplementary Material B (Logan, 2025).
Focal Follows
To quantify foraging and social relationships, we conducted focal follows using methods described in Altmann (1974) Following the release of the study birds from the aviaries upon completion of their test battery, we observed each individual over an ideally 10 min period (increased to 15 min if the bird went out of view) to record all foraging behaviors and social interactions, categories of which are listed in the ethogram (see Supplementary Material 4; Logan, 2025). To ensure we fully sampled social and foraging behavior, we prioritized conducting focal follows on grackles that successfully completed all aviary tests, for which we have a much larger amount of individualized data, including multiple measures of flexibility. We also sampled many other color marked grackles that were never tested in the aviaries, and thus do not have measures of flexibility. We aimed to conduct at least four, but no more than eight, focal follows for each individual, spaced equally across breeding (Apr - Aug) and non-breeding (Sept - Mar) seasons. Subsequent follows on the same individual were a minimum of three weeks apart from the previous focal follow to prevent temporal autocorrelation in behavior (Whitehead, 2008). Each observer successfully completed an interobserver reliability test before collecting focal follow data to be used in the data set (see Supplementary Material 1; Logan, 2025). We used two different methods of collecting focal follow data: the Prim8 behavioral data collection application, and voice recordings. At the end of every focal follow, observers recorded the ending group size, GPS point of the bird’s location, and substrate type. See full protocol for Focal Follows in Supplementary Material C (Logan, 2025).
Data from focal follows that were used in analyses include: the number of food types taken and foraging techniques used (P1 and P2); the number of human foods taken by an individual, the distance to an outdoor human food source for an individual, number of human food sources inside an individual’s home range (in addition to GPX data, P3); the strength of the strongest bond (maximum bond), the strength of all bonds an individual has (strength), the maximum number of other individuals that the focal individual associated with (degree, P4), the Shannon Diversity Index was calculated from this data as a measure of the proportion of time spent in each microhabitat (P6); and the proportion of focal follows that were recorded in a particular microhabitat for each individual (P8).
GPX Tracking
After releasing birds from the aviaries following completion of their test battery, we tracked grackle movements and space use by collecting GPX points on each bird’s location during the breeding and non-breeding seasons. GPX tracking occurred as soon as one day following a bird’s release, and continued until a sufficient number of points were collected to calculate an accurate home range estimate (Leo et al., 2016). We prioritized tracking birds that successfully completed tests in the aviaries, however, we were limited by which bird to track based on which birds were discoverable on any given day. Where possible, radio tag transmitters were used in coordination with a radio receiver to triangulate grackle locations. We used the Open GPX Tracker app (Juan Manuel Merlos, https://apps.apple.com/de/app/open-gpx-tracker/id984503772) for iOS devices to collect these GPX data because this app allows the user to manipulate pin location after placement and starts a tracking timer to indicate duration of tracking time. This latter function is especially critical to the protocol because we collected one GPS point on the bird’s location every 60 sec. Once a minimum of 20 points and a maximum of 90 points were achieved in a day, the file was saved and the data collector resumed tracking other discoverable individuals. We attempted to balance the data collection times between the morning (i.e., before 12 PM) and afternoon (i.e., after 12 PM) to account for variation in movement and space use at different times of day. See full protocol for GPX Tracking in Supplementary Material B (Logan, 2025). Data from GPX tracking that were used in analyses include: the distance to an outdoor human food source for an individual and the number of human food sources inside an individual’s home range (in addition to focal follow data, P3).
Sample
Grackles were caught in the wild at two field sites across their geographic range: the middle of the northern expanding edge (Tempe, Arizona USA; n=94), and on the northern expanding edge (Woodland, California USA; n=35). Individuals were identified using colored leg bands in unique combinations, their data collected (blood, feathers, and biometrics), and then they were released back to the wild. Some individuals (34 in Arizona and 35 in California) were brought temporarily into aviaries for behavioral testing, and then released back to the wild where the data for this study were collected. We stopped collecting data in 2022 when the minimum sample sizes were met.
Analyses
We did not exclude any data. When missing data occurred, the existing data for that individual was included in the analyses for the tests they completed. Analyses were conducted in R (current version 4.3.2) (R Core Team, 2023) and RStudio (RStudio Team, 2020), using several R packages: xtable (Dahl et al., 2019), MCMCglmm (Hadfield, 2010), rethinking (McElreath, 2018), rstan (Stan Development Team, 2020), formatr (Xie, 2023), Rcpp (Eddelbuettel & François, 2011), ggplot2 (Wickham, 2016), knitr (Xie, 2013, 2017, 2018), dplyr (Wickham et al., 2021), cmdstanr (Gabry & Češnovar, 2021), posterior (Bürkner et al., 2020), cowplot (Wilke, 2017), irr (Gamer et al., 2012), psych (Revelle, 2014, 2017), DHARMa (Hartig, 2019), lme4 (Bates et al., 2012; Bates et al., 2015), igraph (Butts, 2016), and rptR (Stoffel et al., 2017), and the intra-class correlation coefficient (ICC, Hutcheon et al., 2010). We analyzed data for females and males separately because each sex has a distinct natural history that might play a role in behavioral differences.
Calculating the independent variable Flexibility 4 (𝜙 and 𝜆)
We developed a Bayesian model of behavioral flexibility (Blaisdell et al., 2021), which better represents flexibility than using the number of trials to pass a reversal in a color tube experiment (Lukas et al., 2022). This model represents flexibility using two parameters: the learning rate 𝜙) and the rate of deviating from learned preferences (𝑙𝑎𝑚𝑏𝑑𝑎). These two parameters make up the Flexibility 4 measure, which is an independent variable used in some of the analyses in the results section. We use 𝜙 and 𝜆 from each bird’s initial discrimination plus first reversal (for the Woodland birds and Tempe control birds) or the last two reversals (for the Tempe manipulated birds). This means that the 𝜙 and 𝜆 are used that reflect the individual’s current state when they are released back to the wild, after which point, the focal follows are conducted. We calculate 𝜙 and 𝜆 using the model and code from Lukas et al. (2022), and enter these into the data sheets used for the analyses in the results section of the current article.
P1: Flexibility and food types / foraging techniques
We used a binomial model that evaluates, of the known food types and foraging techniques, how many an individual uses. The model assumes every individual is able to eat all of the food types and use all of the foraging techniques, and it evaluates the probability of using a given food type or foraging technique at a given time. This model was run for males and females separately and takes the form of:
𝑡𝑒𝑐ℎ𝑖 ~ Binomial(11, 𝑝),
logit(𝑝) ~ 𝑎 + 𝑏𝑝 x 𝜙𝑖 + 𝑏𝑙 x 𝜆𝑖 + 𝑏𝑒 x 𝑜𝑏𝑠𝑡𝑖𝑚𝑒𝑖 + 𝑏𝑟 x 𝑟𝑎𝑛𝑘𝑖,
where 𝑡𝑒𝑐ℎ𝑖 is the number of foraging techniques used (out of the total possible 11 foraging techniques that were observed across both populations) by individual, i, 𝑝 is the probability of using a given technique, 𝑎𝑖 is the intercept, 𝑏𝑝 is the slope for the interaction with 𝜙𝑖 for individual, i, bl is the same for 𝜆𝑖, 𝑏𝑒 is the slope for the interaction with total number of seconds individual, i, was observed for, 𝑜𝑏𝑠𝑡𝑖𝑚𝑒𝑖, and 𝑏𝑟 is the same for dominance rank per bird, 𝑟𝑎𝑛𝑘𝑖. Note that the model is the same when analyzing the number of food types taken for each individual, 𝑓𝑜𝑜𝑑𝑠𝑖, which replaces 𝑡𝑒𝑐ℎ𝑖 in the above model, and 22 (number of food types observed across both populations) replaces the 11.
P2: Flexibility manipulation and food types / foraging techniques
The model is the same as in P1 except that this dataset includes only the Arizona grackles who were in the flexibility manipulation (serial reversal learning of color preferences) or the control group (only one reversal). Both sexes were analyzed together because the sample size was small. This model takes the form of:
𝑡𝑒𝑐ℎ𝑖 ~ Binomial(9, 𝑝),
logit(𝑝) ~ 𝑎𝑖 [𝑡𝑟𝑒𝑎𝑡𝑚𝑒𝑛𝑡] + 𝑏𝑖 x 𝑡𝑖𝑚𝑒,
where 𝑡𝑒𝑐ℎ𝑖 is the number of foraging techniques used (out of the total possible 9 foraging techniques that were observed in the Arizona population) by individual, i, 𝑝 is the probability of using a given technique, 𝑎𝑖 is the intercept (one per level of 𝑡𝑟𝑒𝑎𝑡𝑚𝑒𝑛𝑡: control and manipulated), and 𝑏𝑖 is the slope for the interaction with total number of seconds of observation 𝑡𝑖𝑚𝑒 for individual, i. The term 𝑏𝑖 x 𝑡𝑖𝑚𝑒 allows us to derive the slope of the expected number of foraging techniques a bird would have if it had been observed for a given amount of time. Whereas, 𝑎𝑖[𝑡𝑟𝑒𝑎𝑡𝑚𝑒𝑛𝑡] explains the remaining variation in whether treatment has an effect on how different the actual versus expected values are for the number of foraging techniques. Note that the model is the same when analyzing the number of food types taken for each individual, 𝑓𝑜𝑜𝑑𝑠𝑖, which replaces 𝑡𝑒𝑐ℎ𝑖 in the above model, and 20 (number of food types observed in the Arizona population) replaces the 9.
We used contrasts to determine whether there was a difference between 𝑡𝑟𝑒𝑎𝑡𝑚𝑒𝑛𝑡s and concluded that there is a difference if the 89% compatibility interval does not cross zero.
P3: Flexibility and human foods / human food sources
To investigate what proportion of the diet consists of human foods and how this relates to flexibility, we used a binomial model as follows:
ℎ𝑢𝑚𝑎𝑛𝑓𝑜𝑜𝑑𝑠𝑖 ~ Binomial(𝑡𝑜𝑡𝑎𝑙𝑓𝑜𝑜𝑑𝑠𝑖, 𝑝),
logit(𝑝) ~ 𝑎𝑖 + 𝑏𝑝 x 𝜙𝑖 + 𝑏𝑙 x 𝜆𝑖 + 𝑏𝑟 x 𝑟𝑎𝑛𝑘𝑖,
where ℎ𝑢𝑚𝑎𝑛𝑓𝑜𝑜𝑑𝑠𝑖 is the number of human foods taken by individual, i, 𝑡𝑜𝑡𝑎𝑙𝑓𝑜𝑜𝑑𝑠𝑖 is the total number of foods taken by individual, i, 𝑝 is the probability of taking human foods, 𝑎𝑖 is the intercept, 𝑏𝑝 is the slope for the interaction with the flexibility component 𝜙𝑖, 𝑏𝑙 is the slope for the interaction with the flexibility component 𝜆𝑖, and 𝑏𝑟 is the slope for the interaction with dominance rank, 𝑟𝑎𝑛𝑘𝑖. Note that the model is the same when analyzing the latency (in sec) to attempt a new option on the multiaccess box except the terms for 𝜙𝑖 and 𝜆𝑖 are replaced with 𝑏𝑙𝑎𝑡 * 𝑙𝑎𝑡𝑒𝑛𝑐𝑦𝑖 in the above model.
We used the same model to investigate whether the proportion human foods relates with the number of foraging techniques used, but we removed all terms except for 𝑎𝑖, and added 𝑏𝑡, the slope for the interaction with the number of techniques used per bird, 𝑡𝑒𝑐ℎ𝑖.
To investigate the distance to human food sources and how this relates to flexibility, we recorded the spatial location of each individual at the end of each of its focal follow to measure the distance between this location and the nearest source of human food. We defined a human food source as locations where human-provided food is accessible to grackles, and this included dumpsters, restaurant outdoor seating areas, and feral cat feeding stations. To evaluate whether individual grackles consistently occur in certain spatial locations relative to human food (i.e., may have a preference for proximity to human food locations), we first examined whether distance to human food sources was repeatable within individuals across focal follows. If so, then we would be able to use a bird’s average distance as the response variable in the model. Repeatability is calculated as the ratio of variance among individuals in the distance to a human food source compared to total within- and among-individual variance in distance. We used a Bayesian mixed model (MCMCglmm) framework to determine the variance components for the repeatability value. We additionally used the rptR function in R to calculate repeatability because this function also runs permutations of the data to calculate the p-value as the probability of getting the observed repeatability value if the distance to human food sources was randomized across grackles. We found that distance to a human food source was a repeatable trait in grackles (p = 0.003) and the repeatability values and confidence intervals between the MCMCglmm and the rptR function were nearly identical (MCMCglmm: R = 0.28, CI = 0.15-0.39; rptR: R = 0.28, CI = 0.16-0.39). Therefore, we went forward with the analysis that answers the question for this prediction using a normal model as follows:
𝑑𝑖𝑠𝑡𝑎𝑛𝑐𝑒𝑖 ~ Normal(𝜇, 𝜎),
𝜇~ 𝑎𝑖 + 𝑏𝑝 x 𝜙𝑖 + 𝑏𝑙 x 𝜆𝑖 + 𝑏𝑟 x 𝑟𝑎𝑛𝑘𝑖,
where 𝑑𝑖𝑠𝑡𝑎𝑛𝑐𝑒𝑖 is average number of meters to an outdoor human food source for individual, i, 𝜇 is the population mean number of meters to a human food source, 𝜎 is the standard deviation, the rest of the terms are as in above models. Note that the model is the same when analyzing the latency (in sec) to attempt a new option on the multiaccess box except the terms for 𝜙𝑖 and 𝜆𝑖 are replaced with 𝑏𝑙𝑎𝑡 * 𝑙𝑎𝑡𝑒𝑛𝑐𝑦𝑖 in the above model.
To investigate the number of outdoor food sources within an individual’s home range and how this relates to flexibility, we first measured home range size for each individual. We conducted high-resolution spatial location tracking for a different investigation (McCune et al., 2020) in which we used radio telemetry to follow grackles for 20-120 minutes and record GPS locations of the grackle at 1-minute intervals. We used the Kernel Density Estimation tool in QGIS (QGIS.org, 2023) to calculate home range size. This tool incorporates all of the GPS locations where a bird was seen, as well as the average step length (distance between two sequential spatial locations collected at 1-minute intervals) to inform the kernel radius. We selected a pixel size of 10 meters to account for the satellite accuracy from collected data points. However, because we are including the entire area of the calculated home range instead of eliminating the outlying 5% in a 95% Kernel Density Estimation, pixel size did not affect the number of human food locations intersecting within a home range. Lastly, we used the quartic kernel shape option in the home range calculation. We then drew a 25 meter radius circular buffer around each of the human food location points to account for trash and food disposal as well as incidences of birds queuing in the vicinity of food sources. To determine all food location buffers that intersected with each bird’s home range, we polygonized the home range raster output using the Polygonize (raster to vector) tool in QGIS to Select by Location the intersecting human food sources. Our protocol and detailed methods for all spatial analyses can be found in Supplementary Material D (Logan, 2025).
The binomial model is as follows:
𝑛𝑢𝑚𝑏𝑒𝑟𝑖 ~ Binomial(𝑡𝑜𝑡𝑎𝑙𝑖, 𝑝),
logit(𝑝) ~ 𝑎𝑖 + 𝑏𝑝 x 𝜙𝑖 + 𝑏𝑙 x 𝜆𝑖 + 𝑏𝑟 x 𝑟𝑎𝑛𝑘𝑖,
where 𝑛𝑢𝑚𝑏𝑒𝑟𝑖 is the number of human food sources inside the home range of individual, i, 𝑡𝑜𝑡𝑎𝑙𝑖 is the maximum number of human food sources a bird had in its home range in this sample, 𝑝 is the probability of having a given number of human food sources in a home range, and the rest of the terms are as in the above models. Note that the model is the same when analyzing the latency (in sec) to attempt a new option on the multiaccess box except the terms for 𝜙𝑖 and 𝜆𝑖 are replaced with 𝑏𝑙𝑎𝑡 * 𝑙𝑎𝑡𝑒𝑛𝑐𝑦𝑖 in the above model.
P4: Flexibility and social bonds
To quantify social relationships, we conducted at least four 10-minute focal follows on each subject spaced equally across breeding and non-breeding seasons. We found subjects in the wild by attaching radio transmitter tags to all grackles that were released from the aviaries upon completion of their test battery. To ensure we fully sampled social and foraging behavior, we prioritized conducting focal follows on these tagged grackles for which we had a much larger amount of individualized data, including multiple measures of flexibility.
To measure affiliative bonds, during each focal follow we recorded when another grackle came within one body length of the focal bird (and did not engage in aggressive interactions). In case we did not observe enough of these close associations, we also recorded when another grackle came within 3m of the focal subject (and did not engage in aggressive interactions). Finally, we conducted a scan sample at the end of the follow to determine group size as the number of other grackles within 10 m of the focal individual. Unmarked grackles that were seen in proximity of the focal individual were recorded and included in the count of group size and individual degree (the number of unique associates). However, because we cannot distinguish unmarked individuals from each other, we excluded unmarked bird data from calculations of an individual’s summed bond strengths (see details in the next paragraph). We also measured aggressive behavioral interactions, as indicated in our ethogram. The outcome of these dyadic interactions was used to create our index of dominance ranks (wins - losses / wins + losses).
We conducted subsequent follows on the same individual only when 3 or more weeks passed since the previous focal follow to prevent temporal autocorrelation in behavior (Whitehead, 2008). From the data sheet of dyadic associations during focal follows, we created a matrix of association strengths between all marked grackles by calculating the Half-Weight association index. This index determines association strength based on the proportion of observations in which two individuals are seen together versus separately, and accounts for bias arising from subjects that are more likely to be observed separately rather than together in the same group (Cairns & Schwager, 1987). From the matrix of association values, we used the R package igraph (Csardi & Nepusz, 2006) to create a social network, and calculated each individual’s strength (sum of all association values) and degree (maximum number of unique associates) values (Croft et al., 2008).
Before analyzing degree and strength (individual strength and strength of the maximum bond), we determined if these values differed between breeding (Apr - Aug) and non-breeding seasons (Sept - Mar) because social associations could change as a result of breeding behaviors. There was not enough data in the breeding season (only 5 banded bird to banded bird associations) to statistically test if there was a difference between the seasons, therefore we omitted breeding season data from the analyses.
The maximum bond model is as follows:
𝑚𝑎𝑥𝑏𝑜𝑛𝑑𝑖 ~ Normal(𝜇, 𝜎),
𝜇~ 𝑎𝑖 + 𝑏𝑝 x 𝜙𝑖 + 𝑏𝑙 x 𝜆𝑖 + 𝑏𝑟 x 𝑟𝑎𝑛𝑘𝑖,
where 𝑚𝑎𝑥𝑏𝑜𝑛𝑑𝑖 is the strength of the strongest bond and calculated as the half-weight index based on association behavior during focal follows for individual, i, 𝜇 is the population mean strength of the strongest bond, and 𝜎 is the standard deviation. The rest of the terms are as in the above models, and the same note about the latency model applies here.
The strength model is as follows:
𝑠𝑡𝑟𝑒𝑛𝑔𝑡ℎ𝑖 ~ Normal(𝜇, 𝜎),
𝜇~ 𝑎𝑖 + 𝑏𝑝 x 𝜙𝑖 + 𝑏𝑙 x 𝜆𝑖 + 𝑏𝑟 x 𝑟𝑎𝑛𝑘𝑖,
where 𝑠𝑡𝑟𝑒𝑛𝑔𝑡ℎ𝑖 is the sum of all bonds individual, i, has, 𝜇 is the population mean bond strengths, and 𝜎 is the standard deviation. The rest of the terms are as in the above models, and the same note about the latency model applies here.
The degree model is as follows:
𝑑𝑒𝑔𝑟𝑒𝑒𝑖 ~ Poisson(𝑙),
logit(𝑙) ~ 𝑎𝑖 + 𝑏𝑝 x 𝜙𝑖 + 𝑏𝑙 x 𝜆𝑖 + 𝑏𝑟 x 𝑟𝑎𝑛𝑘𝑖,
where 𝑑𝑒𝑔𝑟𝑒𝑒𝑖 is the maximum number of other individuals that the focal individual, i, associated with, and 𝑙 is the population mean degree. The rest of the terms are as in the above models, and the same note about the latency model applies here.
Because the response variables involve interactions within and between the sexes, we combined the sexes when analyzing the data.
We calculated the percentage of territory that a male shares with another male by using the polygons created for Prediction 3 to calculate the area of each male’s territory and performing an overlap analysis to determine the percentage of this area that overlapped with another male’s territory. We define territory as the space a bird was observed using (for foraging, nesting, etc.) during both the breeding and nonbreeding seasons, measured by following individuals for 20 - 120 minutes, noting the bird’s GPS location at 1-min intervals, several times a week after the bird was released from the aviaries. See the full protocol for calculation in Supplementary Material D (Logan, 2025).
The percentage of shared territory model is as follows:
𝑡𝑒𝑟𝑟𝑖𝑡𝑜𝑟𝑦𝑖 ~ Normal(𝜇, 𝜎),
𝜇~ 𝑎𝑖 + 𝑏𝑝 x 𝜙𝑖 + 𝑏𝑙 x 𝜆𝑖 + 𝑏𝑟 x 𝑟𝑎𝑛𝑘𝑖,
where 𝑡𝑒𝑟𝑟𝑖𝑡𝑜𝑟𝑦𝑖 is the percentage of shared territory an individual male, i, shares with another male, 𝜇 is the population mean percentage of shared territory, and 𝜎 is the standard deviation. The rest of the terms are as in the above models, and the same note about the latency model applies here.
We calculated the relatedness between individuals who had the strongest bonds with each other (maximum bond) using the protocol in Thrasher et al. (2018). We estimated pairwise relatedness between all individuals based on the extent of sharing of genetic variants as determined by ddRADseq. We calculated relatedness among pairs of individuals from single-nucleotide-polymorphism (SNP) data (for details on SNP typing see Sevchik et al., 2022). We performed the genetic analyses at the population level, calling SNPs and calculating relatedness separately for the Arizona and the California individuals. The populations are too far apart geographically to expect any migration between them: combining the two populations into one analysis would lose information about the local relatedness in each. We used stringent settings for the SNP filtering, including loci only if they were present in 95% of the samples and had a minimum minor allele frequency of 0.05, to reduce potential noise from missing data. This resulted in 493 SNPs in California for 35 individuals (2.8% missing data) and 462 SNPs in Arizona for 94 individuals (2.9% missing data). The expected heterozygosity in both populations is 0.29, indicating that we have a high degree of power to calculate relatedness among individuals. We used functions in the package “related” (Pew et al., 2015) in R to estimate relatedness among all pairs in a population using the approach by Queller & Goodnight (1989). For each individual, we identified who the individual with their strongest bond was, and took their pairwise relatedness. This is not necessarily symmetrical: individual A might have their strongest bond with individual B, but individual B might have an even stronger bond with individual C.
The model to link relatedness between individuals who had the strongest bonds to 𝜙 and 𝜆 is:
𝑟𝑒𝑙𝑎𝑡𝑒𝑑𝑛𝑒𝑠𝑠𝑠𝑡𝑟𝑜𝑛𝑔𝑒𝑠𝑡𝑏𝑜𝑛𝑑𝑖 ~ Normal(𝜇, 𝜎),
𝜇~ 𝑎𝑖 + 𝑏𝑝 x 𝜙𝑖 + 𝑏𝑙 x 𝜆𝑖,
and the model to link relatedness among the strongest bonds to the latency is:
𝑟𝑒𝑙𝑎𝑡𝑒𝑑𝑛𝑒𝑠𝑠𝑠𝑡𝑟𝑜𝑛𝑔𝑒𝑠𝑡𝑏𝑜𝑛𝑑𝑖 ~ Normal(𝜇, 𝜎),
𝜇~ 𝑎𝑖 + 𝑏𝑙𝑎 x 𝑙𝑎𝑡𝑒𝑛𝑐𝑦𝑖,
where 𝑟𝑒𝑙𝑎𝑡𝑒𝑑𝑛𝑒𝑠𝑠𝑠𝑡𝑟𝑜𝑛𝑔𝑒𝑠𝑡𝑏𝑜𝑛𝑑𝑖 is the relatedness of individual i to the individual with whom it forms their strongest bond, 𝜇 is the average level of relatedness in the population and 𝜎 is the standard deviation. The rest of the terms are as in the above models.
P5: Flexibility and Immigration
To assess whether individuals are potential immigrants, we calculated their genetic relatedness to all other individuals in their population. Individuals with low average relatedness do not share many of the genetic variants locally present and therefore are more likely to be immigrants. In contrast, individuals with high average relatedness have relatives and others with whom they share genetic variants in the same population and are therefore likely to have hatched in the population. We used the same pairwise relatedness data as in P4 to calculate for each individual the average of their pairwise relatedness with all other individuals in the population for whom we had genetic data (94 individuals in Arizona and 35 individuals in California).
The model to link average relatedness to 𝜙 and 𝜆 is:
𝑎𝑣𝑒𝑟𝑎𝑔𝑒𝑟𝑒𝑙𝑎𝑡𝑒𝑑𝑛𝑒𝑠𝑠𝑖 ~ Normal(𝜇, 𝜎),
𝜇~ 𝑎𝑖 + 𝑏𝑝 x 𝜙𝑖 + 𝑏𝑙 x 𝜆𝑖,
and the model to link average relatedness to the latency is:
𝑎𝑣𝑒𝑟𝑎𝑔𝑒𝑟𝑒𝑙𝑎𝑡𝑒𝑑𝑛𝑒𝑠𝑠𝑖 ~ Normal(𝜇, 𝜎),
𝜇~ 𝑎𝑖 + 𝑏𝑙𝑎 x 𝑙𝑎𝑡𝑒𝑛𝑐𝑦𝑖,
where 𝑎𝑣𝑒𝑟𝑎𝑔𝑒𝑟𝑒𝑙𝑎𝑡𝑒𝑑𝑛𝑒𝑠𝑠𝑖 is the average relatedness of individual i, 𝜇 is the average level of relatedness in the population and 𝜎 is the standard deviation. The rest of the terms are as in the above models.
P6: Flexibility and Habitat Diversity
This species is primarily found within urbanized environments, however there are many different substrates within urban habitats that could provide a variety of food items. Since we are interested in the flexibility of grackle foraging behaviors within the urban habitat, we focused our habitat diversity measures on the different substrates on which we are mostly likely to see individual variability in foraging behaviors and food types, if present. For example, cement, cafe, and dumpster substrates are all likely to contain human-provided food (either because people leave food out for wild animals or wild animals are able to scrounge human foods), whereas grass, gravel, or other natural substrates such as trees likely contain non-human provided prey items including insects and small vertebrates. We used the Shannon diversity index to understand the evenness of substrate use within urban habitats as recommended by others in the field of urban ecology (Alberti et al., 2001; Tews et al., 2004).
The model takes the form of:
𝑑𝑖𝑣𝑖 ~ Normal(𝜇𝑖, 𝜎𝑖) [likelihood],
log(𝜇𝑖) ~ a + bp x 𝜙𝑖 + bl x 𝜆𝑖 + br x 𝑟𝑎𝑛𝑘𝑖 [model],
where 𝑑𝑖𝑣𝑖 is the Shannon Diversity Index (see Oksanen et al., 2022 for mathematical definition) for each individual i, 𝜇𝑖 is the mean and 𝜎𝑖 is the standard deviation for each individual. The rest of the terms are as in the above models, and the same note about the latency model applies here. We determine that 𝜙𝑖 and 𝜆𝑖 are strongly related to the diversity index if the compatibility interval for the slope does not cross zero.
P7: Human Population Density Across Sites
Human population density (population per square mile) was obtained from the U.S. Census Bureau for Tempe, Arizona (https://www.census.gov/quickfacts/fact/table/tempecityarizona,US/POP060220), Woodland, California (https://www.census.gov/quickfacts/fact/table/woodlandcitycalifornia/POP060220), and Sacramento, California (https://www.census.gov/quickfacts/fact/table/sacramentocitycalifornia,tempecityarizona,US/POP060220) for 2010 and 2020 (the Census data), and from the U.S. Census American Community Survey (https://www.opendatanetwork.com/entity/1600000US0664000-1600000US0686328-1600000US0473000/Sacramento_CA-Woodland_CA-Tempe_AZ/geographic.population.density?year=2018&ref=compare-entity) for the rest of the years from 2009 to 2018 (note that there is no data for 2019). The Woodland population consisted of two trapping locations: one in Woodland and the other in Sacramento. The two locations represent the same population because some of the same individuals were found at both locations. We designed a bespoke Bayesian model to determine whether there are differences between populations and we conducted a simulation to determine how much of a difference between the means (at least 250 people per square mile) would result in there being a difference between the cities (evaluated using a contrast).
The model takes the form of:
𝑝𝑖 ~ Normal(𝜇𝑖, 𝜎𝑖),
log(𝜇𝑖) ~ a[city],
where 𝑝𝑖 is the human population density (total population divided by the land area per square mile) for each observation i, 𝜇𝑖 is the mean and 𝜎𝑖 is the standard deviation, and a[city] is the intercept for each city.
P8: Flexibility and Microhabitat Types
We examine the proportion of focal follows associated with each microhabitat per individual and relate this to their flexibility scores on their most recent reversal in the tube experiment. This allows us to see whether the more flexible individuals (faster to reverse) are associated with particular microhabitats more than the less flexible individuals.
The model takes the form of:
𝑓𝑜𝑙𝑙𝑜𝑤𝑠𝑖 ~ Binomial(𝑡𝑜𝑡𝑎𝑙𝑓𝑜𝑙𝑙𝑜𝑤𝑠, 𝑝),
logit(𝑝) ~ 𝑎𝑖 [habitat] + 𝑏𝑖 x 𝜙𝑖,
where 𝑓𝑜𝑙𝑙𝑜𝑤𝑠𝑖 is the proportion of focal follows that were recorded in a particular microhabitat for each individual i, 𝑡𝑜𝑡𝑎𝑙𝑓𝑜𝑙𝑙𝑜𝑤𝑠 is the total number of focal follows per bird, 𝑝 is the probability of being in a given microhabitat, 𝑎𝑖 is the intercept (one per observation), 𝑏𝑖 is the slope for the interaction with 𝜙𝑖, and 𝜙𝑖 is the learning rate of attraction to one of the two options and is one of the two components of the flexibility measure (see Lukas et al., 2022 for details). Note that the model is the same when analyzing 𝜆𝑖, which replaces 𝜙𝑖 in the above model. 𝜆𝑖 is the rate of deviating from the learned attractions and is the second component of the flexibility measure. We determine that 𝜙𝑖 and 𝜆𝑖 are strongly related to the proportion of focal follows in a given habitat if the compatibility interval for the slope does not cross zero.
Ability to Detect Actual Effects
Given our sample size for a given prediction, how large of a difference can we reliably detect? We developed bespoke Bayesian power analysis models to answer this question. There are three types of models that we use to analyze our results: the outcome variable follows either a normal or a binomial distribution, and for the binomial model there are two types of predictor variables, continuous and categorical. We developed a generic power analysis for each type. We ran these analyses for sample sizes of 4, 9, and 26 because sample sizes in the article range across 4, 6, 7, 8, 9, 10, 12, 13, 18, 19, 21, and 26, with 9 and 26 being the most common. We simulate three different effect sizes and classify their sizes as follows (Cohen, 2013): - Small effect size: explains 20% of the variation in the outcome variable - Medium effect size: explains 50% of the variation in the outcome variable - Large effect size: explains 75% of the variation in the outcome variable
Models are run 100 times on each sample size/effect size setting and the proportion of times the 89% compatibility interval crosses zero is used to determine whether the model can reliably infer a relationship. The fewer times the interval crosses zero, the more power there is to detect the effect. We ran power analyses for the three types of models included in our article.
Scenario 1 is for an outcome variable that has a binomial distribution and a predictor variable that is continuous and standardized such that the mean is centered on zero (𝜙, 𝜆, or latency to switch). The model takes the form of:
𝑜𝑢𝑡𝑐𝑜𝑚𝑒 ~ Binomial(22, 𝑝),
logit(𝑝) ~ 𝑎𝑖 + 𝑏𝑖 x 𝑝𝑟𝑒𝑑𝑖𝑐𝑡𝑜𝑟,
where 22 is chosen because it is in the middle of the range of values that appear in the models in this article.
We found that the small sample size (n=4) can reliably detect large effects, the intermediate sample size (n=9) can reliably detect large and medium effects, and the large sample size (n=26) can detect large, medium, and small effects (Table 1).
Table 1 - Our power to detect small, medium, or large effect sizes at various sample sizes (number of individuals) is indicated by the proportion of iterations the confidence interval crosses zero (a low proportion means that there is high power, whereas a high proportion indicates low power). Average slope is the value for b in the model output or the average contrast of b2 minus b1 in the model with the categorical predictor.
Model type | Sample size | Effect size | Average slope / average contrast | Proportion of iterations that cross zero |
Scenario 1: Binomial (continuous predictor) (average slope) | 4 | large | 1.55 | 0.09 |
4 | medium | 1.08 | 0.22 | |
4 | small | 0.56 | 0.46 | |
9 | large | 1.73 | 0.00 | |
9 | medium | 1.17 | 0.08 | |
9 | small | 0.59 | 0.34 | |
26 | large | 1.83 | 0.00 | |
26 | medium | 1.10 | 0.00 | |
26 | small | 0.59 | 0.07 | |
Scenario 2: Binomial (categorical predictor) (average contrast) | 18 | large | 0.19 | 0.00 |
18 | medium | 0.15 | 0.08 | |
18 | small | 0.06 | 0.64 | |
Scenario 3: Normal (average slope) | 4 | large | 0.72 | 0.13 |
4 | medium | 0.38 | 0.68 | |
4 | small | 0.15 | 0.91 | |
9 | large | 0.79 | 0.00 | |
9 | medium | 0.47 | 0.31 | |
9 | small | 0.15 | 0.89 | |
26 | large | 0.80 | 0.00 | |
26 | medium | 0.50 | 0.00 | |
26 | small | 0.18 | 0.70 |
Scenario 2 is for an outcome variable that has a binomial distribution and a predictor variable that is categorical (flexibility manipulated vs control groups). We have only one model that uses this scenario (P2), therefore we used that particular sample size (n=18: 8 in the flexibility manipulated group, 10 in the control group). The model is the same as above, except for the second line:
logit(𝑝) ~ 𝑏𝑖[predictor].
We found that our small sample size of 18 can reliably detect large and medium effects (Table 1).
Scenario 3 is for an outcome variable that has a normal distribution and a predictor variable that is continuous and standardized such that the mean is centered on zero (𝜙, 𝜆, or latency to switch). The model is as follows:
𝑜𝑢𝑡𝑐𝑜𝑚𝑒 ~ Normal(𝜇𝑖, 𝜎𝑖),
𝜇𝑖 ~ 𝑎 + 𝑏𝑖 x 𝑝𝑟𝑒𝑑𝑖𝑐𝑡𝑜𝑟.
We found that the small (n=4) and intermediate (n=9) sample sizes can reliably detect large effects, and the large sample size (n=26) can detect large and medium effects (Table 1).
Results
We found several relationships between flexibility and foraging, and some with social and habitat variables (Table 2). However, when evaluating the overall conclusion across all of the analyses in each prediction, the evidence indicated that there was support at the prediction level for the foraging relationships in predictions 2 and 3 (Table 2; see Discussion for an explanation of this analysis and the R code). We share the results from each prediction below.
P1: Flexibility and the Number of Foraging Types
A total of 22 food types were taken and 11 foraging techniques used across both populations, which included 35 grackles (8 of which were in the flexibility manipulated condition; n=9 females, mean number of follows per female=4.2, range=1-6; n=26 males, mean number of follows per male=4.6, range=1-8). The Arizona population took 20 food types, including lizard, bird poop, candy, vomit, condiment, and carcass, which the California population did not have. The California population took 15 food types, including mulch, which the Arizona population did not have. The Arizona population used 9 foraging techniques, including break into pieces, dunk in water, tolerated theft, and theft, which the California population did not have. The California population used 8 foraging techniques, including pick up, and sweep, which the Arizona population did not have. The food types were: fry, lizard, grains, insect, rock, cat food, worm, seed, food crumbs, vegetation, fruit, bird poop, candy, vomit, misc. trash, soil, condiment, carcass, chicken, peanut, mulch, and unknown. The foraging techniques were: gape, lift or nudge, stalk catch, flip, food share, break into pieces, dunk in water, theft, dig, pick up, and sweep. Flexibility was measured as 𝜙, 𝜆, and average switching latency on the multiaccess box.
The females who used more food types had slower latencies to switch on the multiaccess box (i.e., less flexible), which supports prediction 1 alternatives 2 and 3, while 𝜙 and 𝜆 did not strongly relate to the number of different food types eaten as indicated by the slope’s compatibility interval (CI) crossing zero or not, which supports prediction 1 alternative 1 (Figure 1; 𝜙: mean=-0.30, sd=0.51, 89% CI=-1.14-0.47; 𝜆: mean=-0.27, sd=0.35, 89% CI=-0.83-0.28; latency: mean=0.67, sd=0.38, 89% CI=0.08-1.29). The males who used more food types had higher 𝜆 values (i.e., less flexible), which supports prediction 1 alternatives 2 and 3, and higher 𝜙 values and faster latencies to switch on the multiaccess box (i.e., more flexible), which supports prediction 1 (Figure 1; 𝜙: mean=0.41, sd=0.14, 89% CI=0.19-0.63; 𝜆: mean=0.36, sd=0.16, 89% CI=0.10-0.62; latency: mean=-0.47, sd=0.20, 89% CI=-0.79 - -0.18).
Table 2 - Summary of all results. Pluses and minuses are relative to FLEXIBILITY and not the specific relationship between 𝜆 or 𝜙 or latency, therefore a + means that the more flexible individuals, for example, use more food types, etc. We adopted this interpretation because a lower 𝜆 and latency means that the individual is more flexible, while a higher 𝜙 means they are more flexible, which makes the interpretation more confusing.
Section | Prediction | Sex | Flexibility (reversal learning) | Flexibility (multiaccess box) | Overall result | ||||
𝜙 | 𝜆 | Latency to switch | |||||||
Foraging | P1: food types | Females Males | 0 + | 0 - | - + | 0 | |||
P1: foraging techniques | Females Males | - 0 | + 0 | - + | |||||
P1alt2: food value | Females Males | NA 0 | NA 0 | 0 NA | |||||
P2: food types | Together | + and [Manipulated > Control] | NA | + | |||||
P2: foraging techniques | Together | + and [Manipulated > Control] | NA | ||||||
P3: proportion human foods | Females Males | 0 0 | - - | + - | - | ||||
P3: distance to human food | Females Males | 0 0 | - 0 | 0 0 | |||||
P3: number of human food sources | Females Males | 0 0 | - - | - - | |||||
Social | P4: strength of strongest bond | Together | 0 | 0 | 0 | 0 | |||
P4: bond strength | Together | 0 | 0 | + | |||||
P4: degree (banded to banded) | Together | 0 | 0 | 0 | |||||
P4: degree (banded + unbanded) | Together | 0 | - | 0 | |||||
P4: degree (max group size) | Together | 0 | 0 | + | |||||
P4: male shares territory | Together | 0 | 0 | 0 | |||||
P4: relatedness of strongest bond | Together | 0 | 0 | 0 | |||||
P5: probability of being an immigrant | Together | 0 | 0 | 0 | 0 | ||||
Habitat | P6: proportion time in each habitat | Females Males | 0 0 | 0 0 | 0 0 | 0 | |||
P7: human population density | All field sites (Woodland, Sacramento, Tempe) differ from each other | ||||||||
P8: proportion focals in each habitat | Females Males | - (trees) 0 | 0 0 | 0 0 | |||||
The females who used more foraging techniques had lower 𝜙 values and higher switching latencies on the multiaccess box (i.e., less flexible), which supports prediction 1 alternative 2, while the females with more foraging techniques had lower 𝜆 values (i.e., more flexible; Figure 2; 𝜙: mean=-0.76, sd=0.51, 89% CI=-1.60 - 0.00; 𝜆: mean=-0.91, sd=0.43, 89% CI=-1.61 - -0.25; latency: mean=1.15, sd=0.42, 89% CI=0.53-1.87). The males who used more foraging techniques had lower switching latencies on the multiaccess box (i.e., more flexible), which supports prediction 1, while there was no strong relationship with 𝜙 or 𝜆, which supports prediction 1 alternative 1 (Figure 2; 𝜙: mean=0.19, sd=0.16, 89% CI=-0.07-0.45; 𝜆: mean=0.21, sd=0.18, 89% CI=-0.10 0.49; latency: mean=-0.79, sd=0.24, 89% CI=-1.19 - -0.42).

Figure 1 - Scatterplots for females (top row) and males (bottom row) showing the relationship between the number of different food types taken and flexibility: 𝜙 (left column), 𝜆 (middle column), and the switching latencies on the multiaccess box (right column).
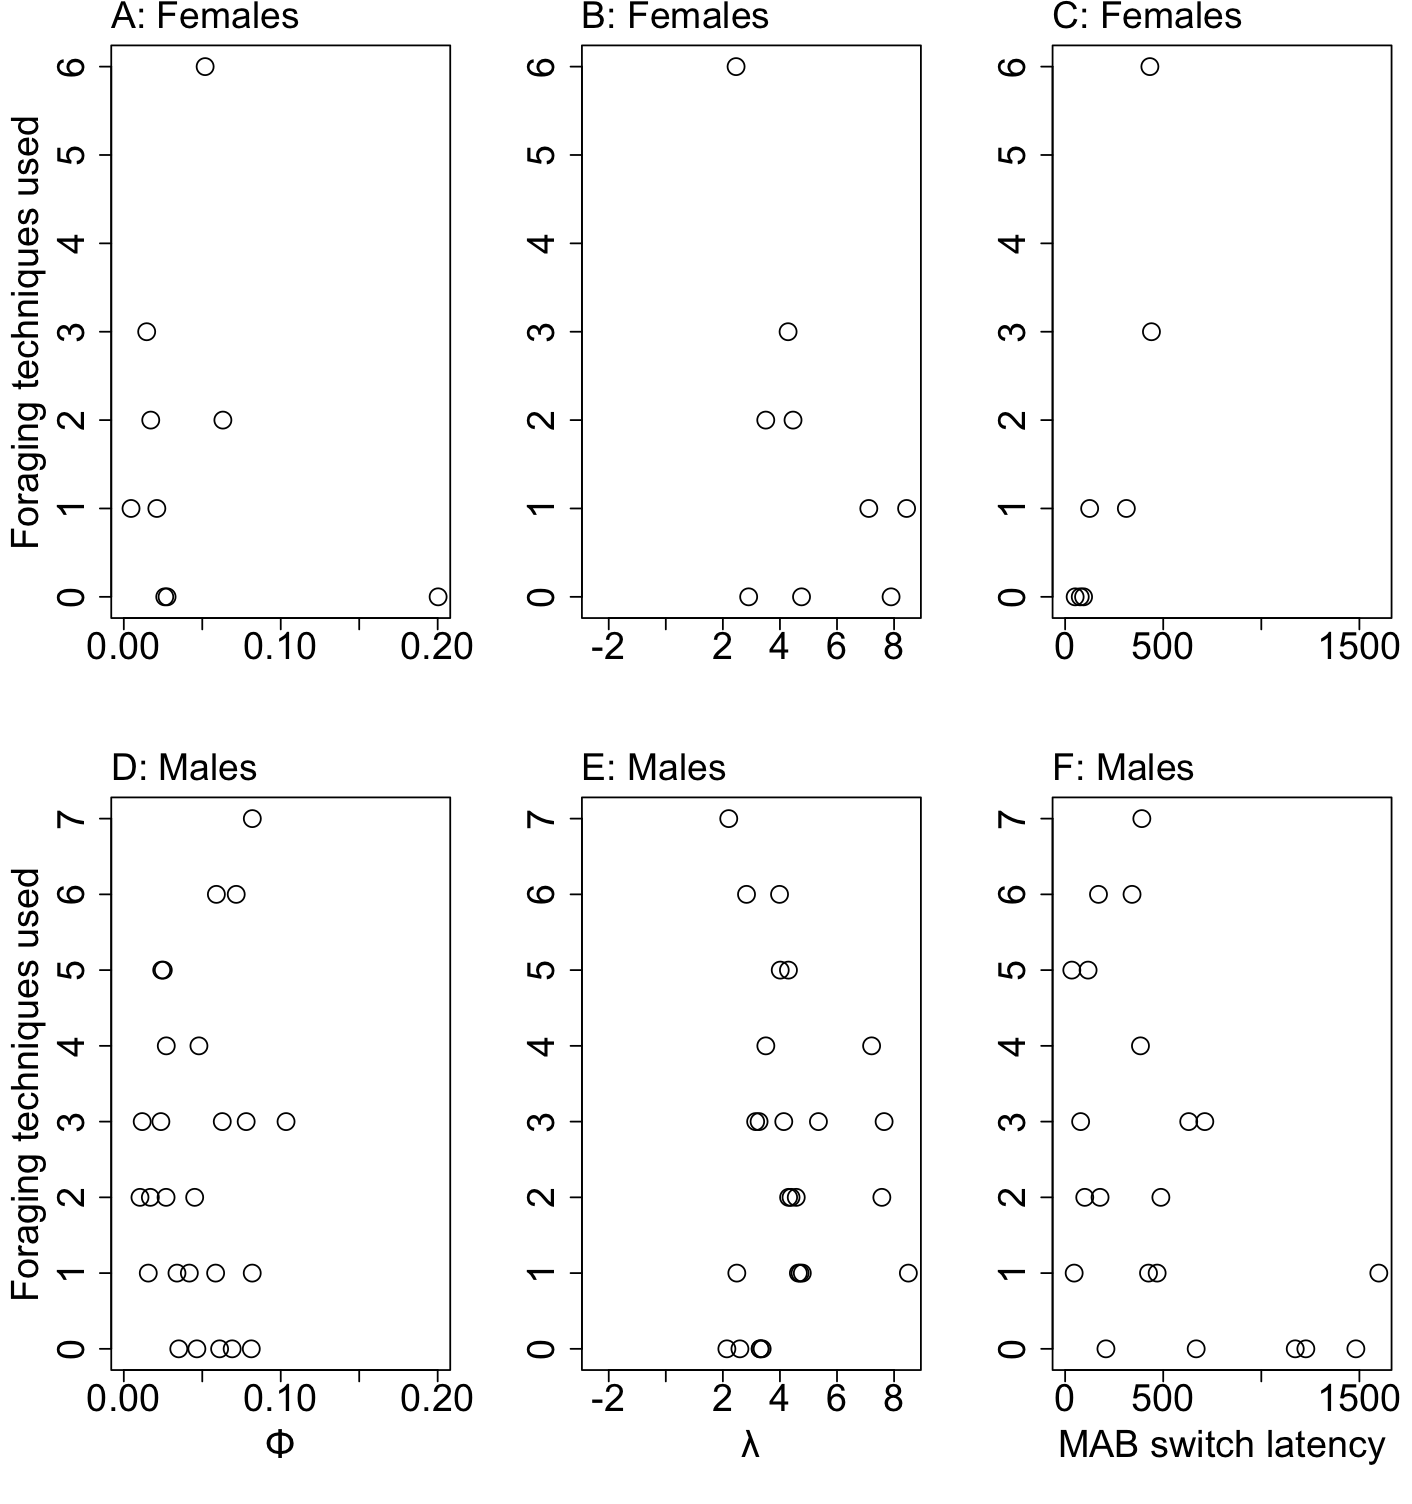
Figure 2 - Scatterplots for females (top row) and males (bottom row) showing the relationship between the number of different foraging techniques used and flexibility: 𝜙 (left column), 𝜆 (middle column), and the switching latencies on the multiaccess box (right column).
We found some support for prediction 1 alternative 2 - a negative correlation between food types taken and flexibility (𝜆 in males and latency to switch in females). Therefore, we conducted the preregistered follow up analysis examining what food types the more flexible individuals take and whether these food types are potentially more valuable (measured as having more calories). There was no correlation between average calories per 100g per bird and 𝜙 or 𝜆 in males (n=19 males; 𝜙: mean=-0.01, sd=0.49, 89% CI=-0.81-0.77; 𝜆: mean=0.01, sd=0.49, 89% CI=-0.75-0.79) or with switch latencies in females (n=4 females; mean=-0.03, sd=0.50, 89% CI=-0.84-0.80).
P2: Flexibility manipulation and food types and foraging techniques
This dataset consists of only the Tempe grackles. There were 8 manipulated birds and 10 control birds, and they had 1-8 focal follows per bird with a mean of 4.7 follows.
We used a binomial model to determine how many of the known food types and foraging techniques were used. We found that flexibility manipulated individuals took an average of 1.9 more food types and used an average of 1.1 more foraging techniques than control individuals at the average amount of observation time because the contrast compatibility interval did not cross zero (food types: mean=-1.85, sd=0.75, 89% compatibility interval=-3.02 - -0.65; techniques: mean=-1.12 sd=0.65, 89% compatibility interval=-2.16 - -0.09; Figure 3). The manipulated birds had a 1.9 higher likelihood of using any of the 20 food types, a 19% probability, whereas control birds only had a 10% probability. The manipulated birds had a 1.6 higher likelihood of using any of the 9 techniques than the control birds, a 32% probability compared to a 20% probability for the control birds. See Supplementary Material 2.1 (Logan, 2025) for an analysis that better accounts for undersampling, which gives the same results, but has much higher uncertainty.
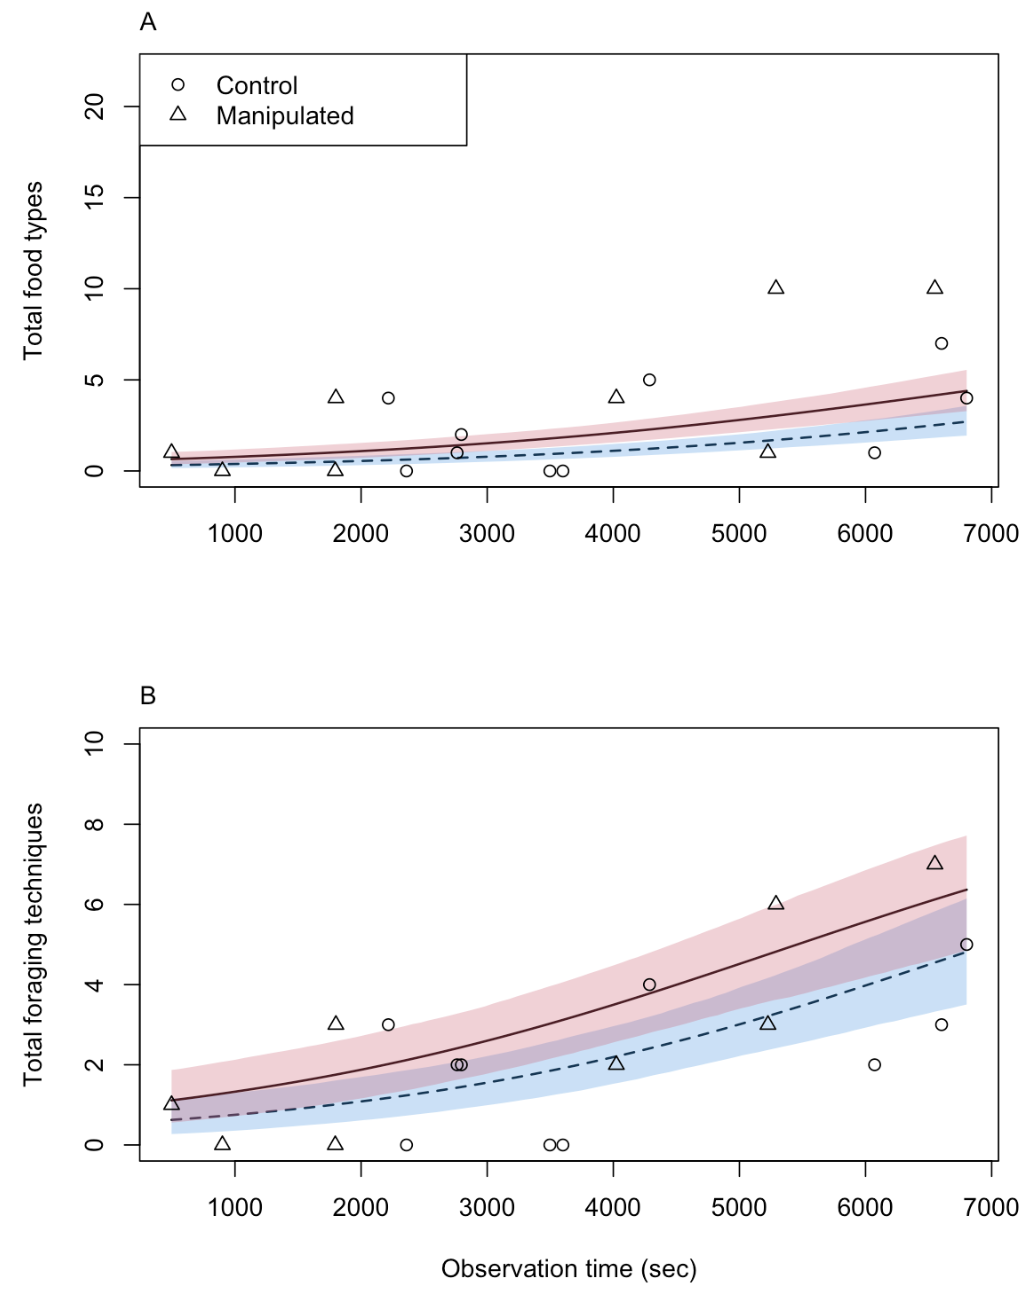
Figure 3 - The relationship between the number of food types eaten (A) or foraging techniques used (B) and observation time (number of seconds) for the manipulated (triangle points with red shading and a solid line) and control (circle points with blue shading and a dashed line) individuals.
Unregistered Analyses
The results suggest that the difference between manipulated and control individuals could be due to differences in the probability that birds will switch among foraging techniques. We predict that manipulated birds have a higher probability of switching techniques per second or per minute because switching is a measure of flexibility, which was manipulated in the aviaries for these individuals. The food type data set consisted of 13 individuals (6=manipulated, 7=control), and the foraging technique data set consisted of 12 individuals (n=5 manipulated, n=7 control) who had data that involved eating at least one food type or using at least one foraging technique. For each focal follow, we calculated the number of switches between food types or techniques that occurred and the total amount of time that the bird was observed. We summed both measures across focal follows to have one data point per bird. This model takes the form of:
𝑠𝑤𝑖𝑡𝑐ℎ𝑒𝑠𝑖 ~ Binomial(𝑡𝑜𝑡𝑎𝑙𝑡𝑖𝑚𝑒𝑖, 𝑝) [likelihood],
logit(𝑝) ~ 𝛼𝑖[𝑡𝑟𝑒𝑎𝑡𝑚𝑒𝑛𝑡] [model],
where 𝑠𝑤𝑖𝑡𝑐ℎ𝑒𝑠𝑖 is the number of times individual, i, changed foraging techniques within a focal follow and summed across all of their focal follows, 𝑡𝑜𝑡𝑎𝑙𝑡𝑖𝑚𝑒𝑖 is the number of seconds individual, i, was observed across all of its focal follows, 𝑝 is the probability of switching to a different technique per second, and 𝛼𝑖 is the intercept (one per level of 𝑡𝑟𝑒𝑎𝑡𝑚𝑒𝑛𝑡: control and manipulated). Note that the model is the same when analyzing the number of food types eaten for each individual, 𝑓𝑜𝑜𝑑𝑠𝑤𝑖𝑡𝑐ℎ𝑒𝑠𝑖, which replaces 𝑠𝑤𝑖𝑡𝑐ℎ𝑒𝑠𝑖 in the above model.
We found that the manipulated birds on average were 1.9 times more likely to switch to a different food type (mean=1.93, sd=0.31, 89% compatibility interval=1.44 - 2.38), and 1.7 times more likely to switch to a different foraging technique (mean=1.69, sd=0.33, 89% compatibility interval=1.19 - 2.21) compared to control birds (Figure 4). The manipulated birds had an average probability of switching among food types of 16% per minute compared with 8% for control birds, and the probability of switching among foraging techniques was 11% per minute for manipulated birds compared to 7% per minute for control birds.
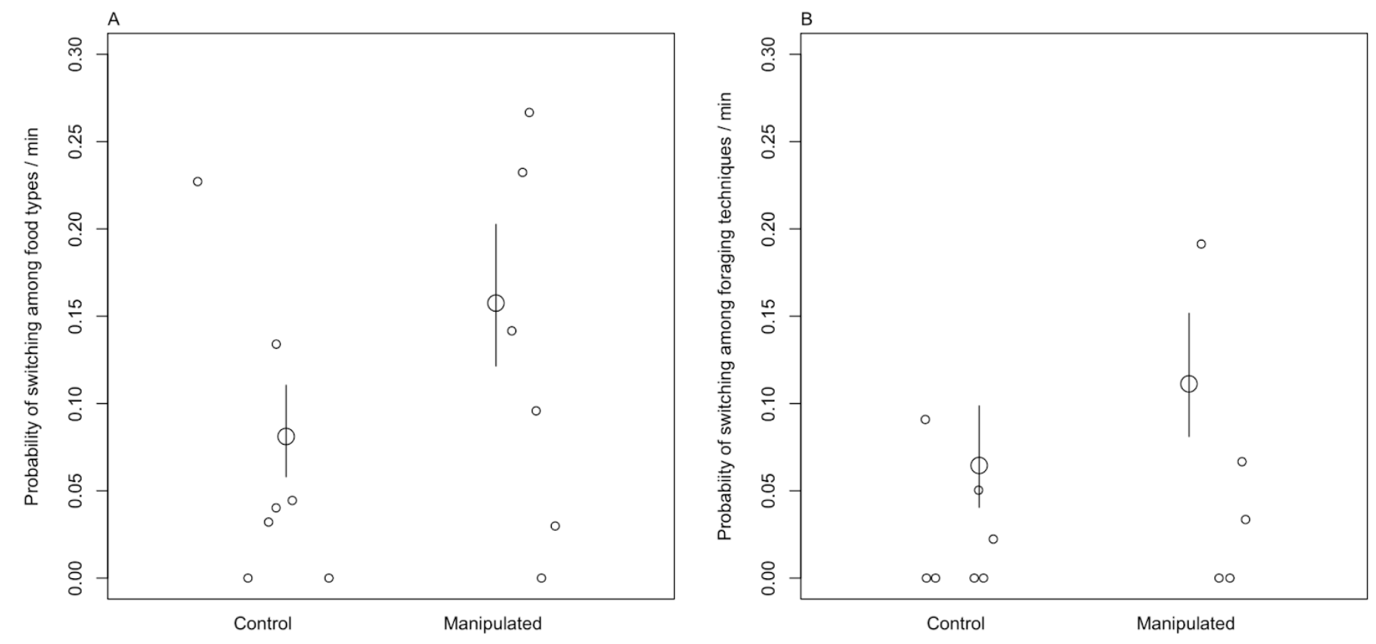
Figure 4 - The probability of switching among food types (A) and foraging techniques (B) per minute for the control and manipulated birds. The small circles are the data points per individual and the large circles are the estimated means with their 89% compatibility intervals represented by the vertical lines.
There is the caveat that during a given focal follow, the bird might have been out of view for part of the time. Our calculation of total time in view excludes the out of view time, but treats observations before and after the out of view period as a single focal follow. This could either overestimate switch rates if during the time out of view birds were not foraging or it could underestimate the switch rates if during the time out of view birds were foraging on different food types and using different foraging techniques. The control birds were out of view for 56 seconds longer than manipulated birds on average (mean=-56.21, sd=30.12, 89% compatibility intervals=-104.26 - -9.07). Through running a simulation, we conclude that the reduced time in view should result in a +/-1% different estimated switch rate per minute. If the only reason for the difference in the switching rates between the manipulated and control birds is the difference in the time out of view, then the contrast in the switching rates between manipulated and control birds would always overlap zero. This was not the case because the contrasts above did not cross zero. Therefore, the results that the manipulated birds have higher switching rates (16% and 11%) still holds because their rates are more than 2% higher than the rates of the control birds (8% and 7%).
In addition to the manipulated birds switching between food types more often than control birds, in an additional unregistered analysis, we explored whether it was also likely that the manipulated birds used more food types in part because they ate more often than control birds. We found that manipulated birds were observed to forage more frequently per minute than control birds (contrast: mean=0.18, sd=0.03, 89%CI=0.13-0.24). The difference in food types arose because control and manipulated birds feed on slightly different food types with manipulated birds having more food types that only they eat. Nevertheless, even after accounting for the total number of food events, the manipulated birds still switched among food types more often than control birds (contrast: mean=-0.04, sd=0.03, 89%CI=-0.09-0.00). For foraging technique switches, after accounting for the number of feeding events, the manipulated birds had higher switch rates per minute, but the differences were not reliable with our small sample size as indicated by the compatibility interval crossing zero (contrast: mean=-0.02, sd=0.02, 89%CI=-0.04-0.01).
P3: Human Foods
The less flexible (higher 𝜆) females and males ate a higher proportion of human foods, while there was no strong relationship with 𝜙 (𝜙: females: n=6 birds; mean=0.23, sd=0.62, 89%CI=-0.77-1.22; males: n=20 birds, mean=0.11, sd=0.20, 89%CI=-0.22-0.41; 𝜆: females: mean=1.69, sd=0.62, 89%CI=0.73-2.75; males: mean=0.39, sd=0.19, 89%CI=0.09-0.68; Figure 5). The males with the higher latencies to switch options on a multiaccess box (less flexible) ate a higher proportion of human foods, while the females with the lower latency (more flexible) ate a higher proportion of human foods (females: n=4 birds, mean=-1-59, sd=0.58, 89%CI=-2.55 - -0.68; males: n=15 birds, mean=0.93, sd=0.29, 89%CI=0.48-1.38). The proportion of human foods eaten and the number of foraging techniques used were negatively correlated in females (n=6 birds; mean=-1.46, sd=0.61, 89%CI=-2.47 - -0.56) and males (n=20 birds; mean=-0.34, sd=0.17, 89%CI=-0.60- -0.07).
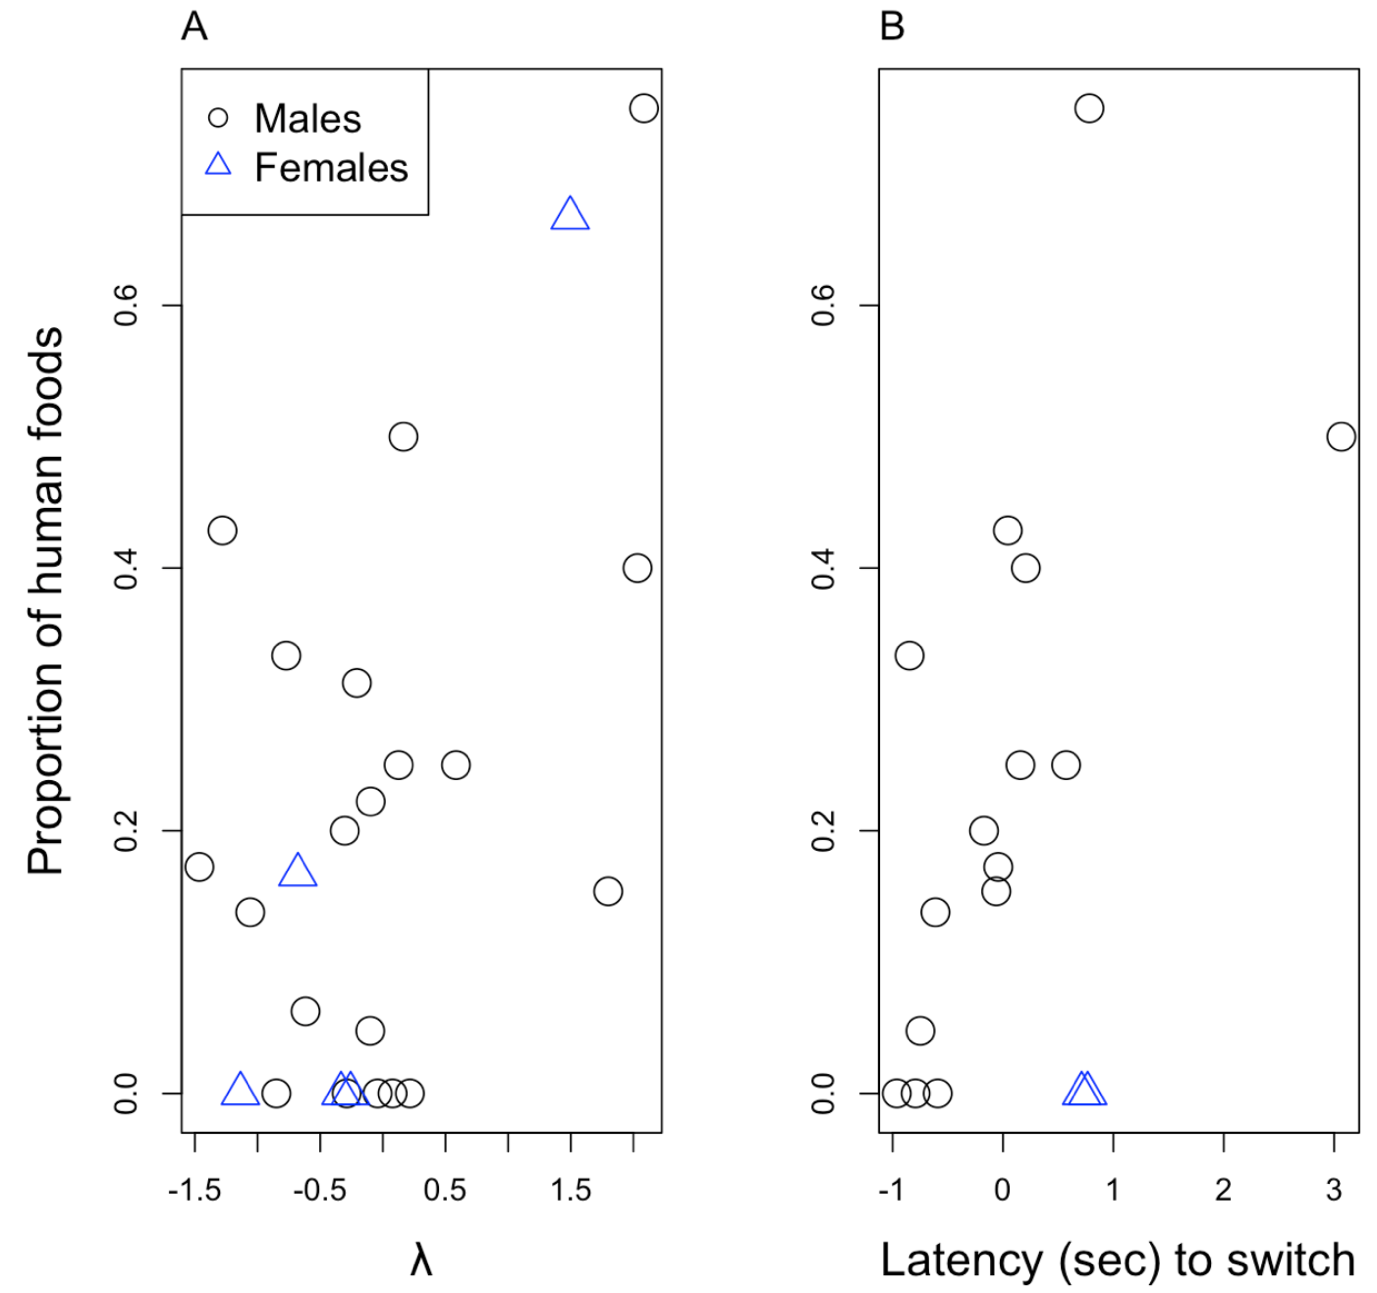
Figure 5 - Proportion of human food sources inside a bird’s home range and its association with A) 𝜆 (standardized so it is centered on zero) from the reversal learning experiment and B) the latency to switch options on the multiaccess box in females (blue triangles) and males (black circles).
Even though flexibility is not related to the proportion of human foods eaten, females (n=9) with a higher 𝜆 (less flexible) have smaller average distances to human food sources, while there is no relationship for males (n=26) or for 𝜙 or latency in both sexes (𝜙 females: mean=-0.11, sd=0.28, 89%CI=-0.55-0.33; males: mean=0.11, sd=0.27, 89%CI=-0.32-0.55; 𝜆 females: mean=-1.07, sd=0.28, 89%CI=-1.51 - -0.60; males: mean=-0.20, sd=0.26, 89%CI=-0.61-0.21; latency: females: mean=0.47, sd=0.53, 89%CI=-0.41-1.28; males: mean=0.10, sd=0.28, 89%CI=-0.35-0.56; Figure 6).
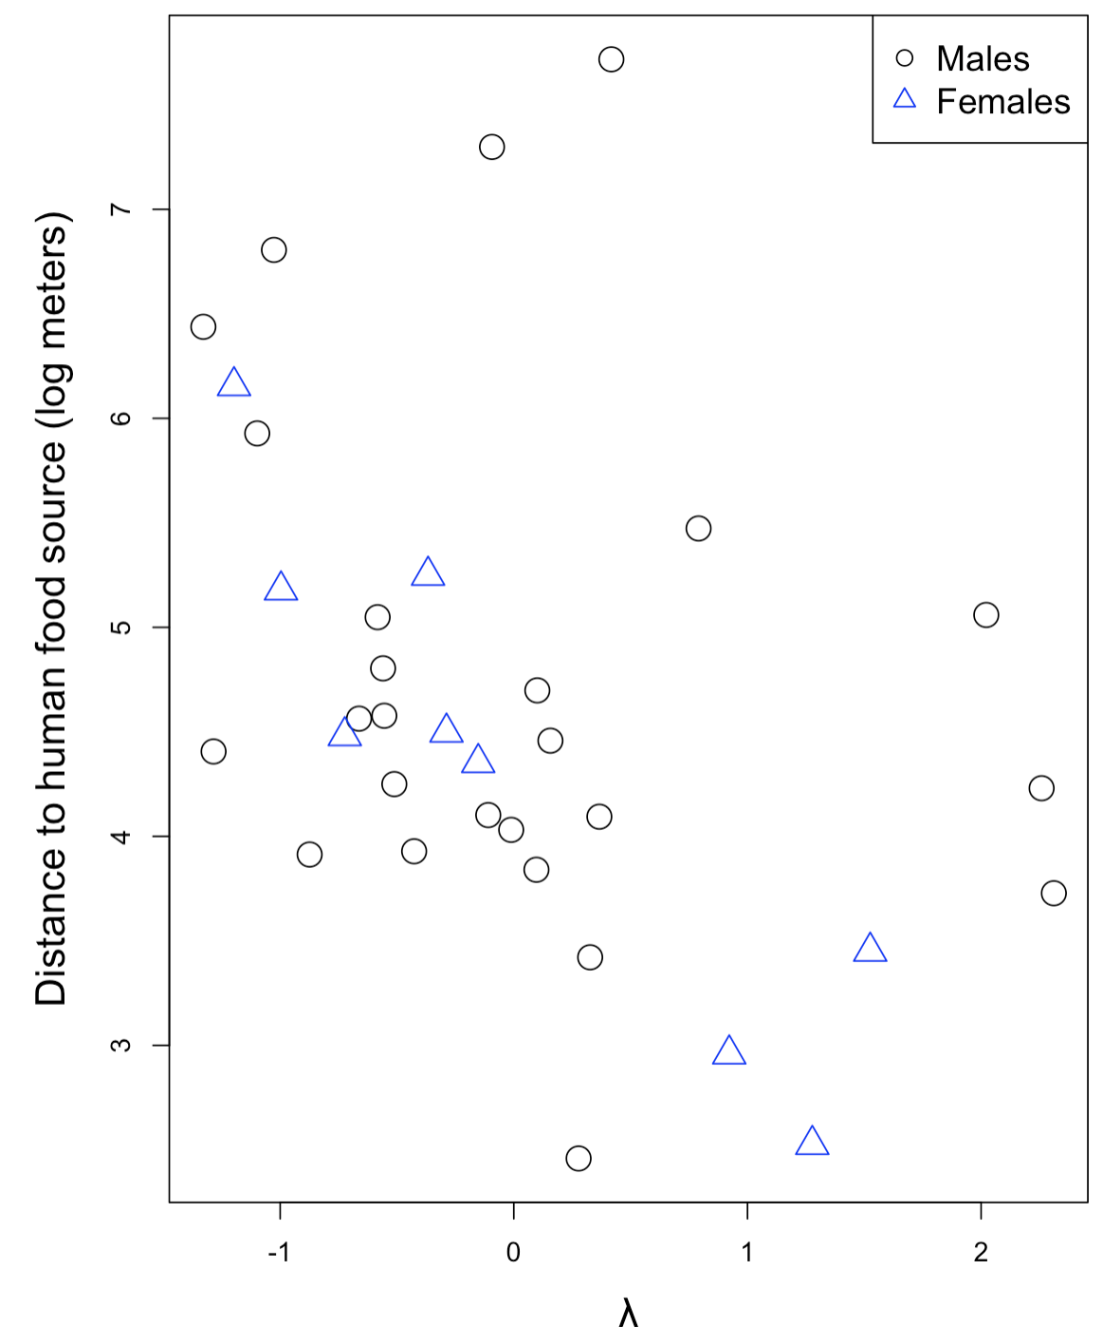
Figure 6 - Distance (log meters) to a human food source and its association with 𝜆 (standardized so it is centered on zero) in females (blue triangles), but not males (black circles).
Females (n=6) that have higher 𝜆 (less flexible) and males (n=21) that have higher 𝜆 (less flexible) and 𝜙 (more flexible) have a higher number of human food sources in their home ranges, whereas there is no relationship with 𝜙 in females (𝜙 females: mean=0.47, sd=0.31, 89%CI=-0.02-0.98; males: mean=0.23, sd=0.08, 89%CI=0.10-0.36; 𝜆 females: mean=0.80, sd=0.26, 89%CI=0.39-1.23; males: mean=0.70, sd=0.08, 89%CI=0.58-0.83; Figure 7). Males (n=16) that are faster to switch between options on the multiaccess box (more flexible) have a lower number of human food sources in their home ranges, but there was no strong relationship in females (n=4) (females: mean=-0.04, sd=0.34, 89%CI=-0.58-0.50; males: mean=0.40, sd=0.08, 89%CI=0.28-0.53).
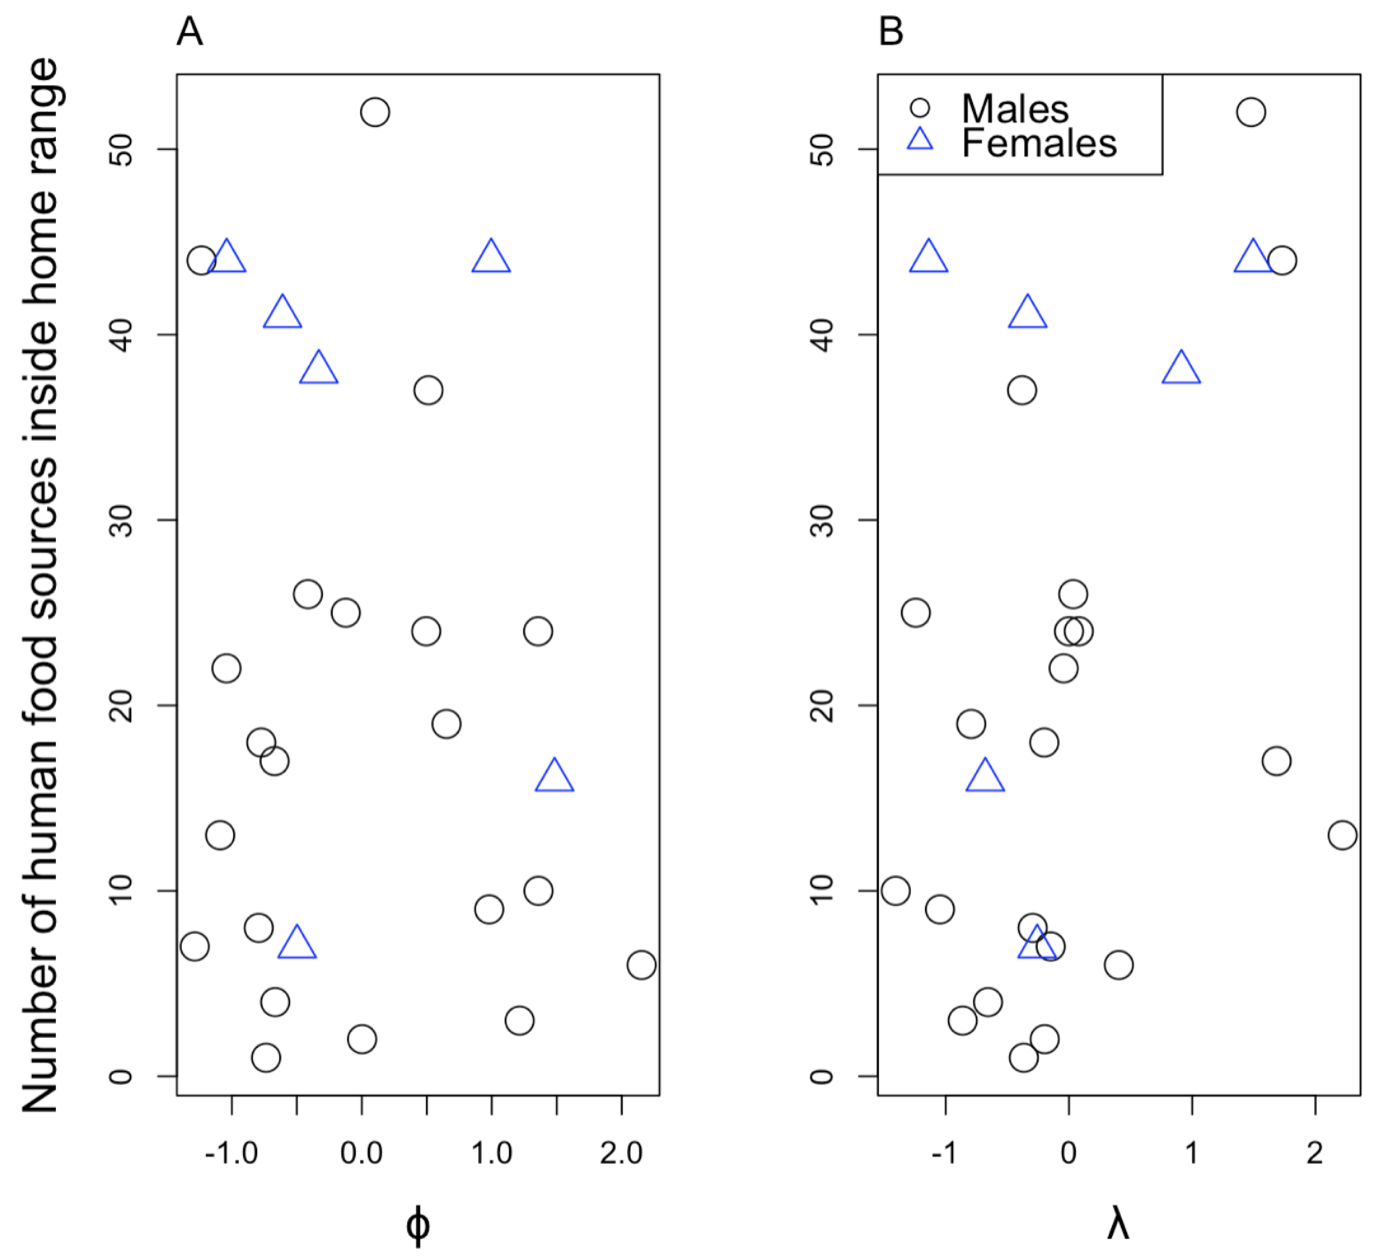
Figure 7 - The number of human food sources inside the home range and its association with A) 𝜙 and B) 𝜆 (standardized so they are centered on zero) in females (blue triangles) and males (black circles).
P4: Flexibility and Social Bonds
We obtained social data between banded grackles (Figure 8), as well as banded and unbanded grackles in both populations. The sample sizes for our analyses were limited to those individuals for whom we had flexibility data.
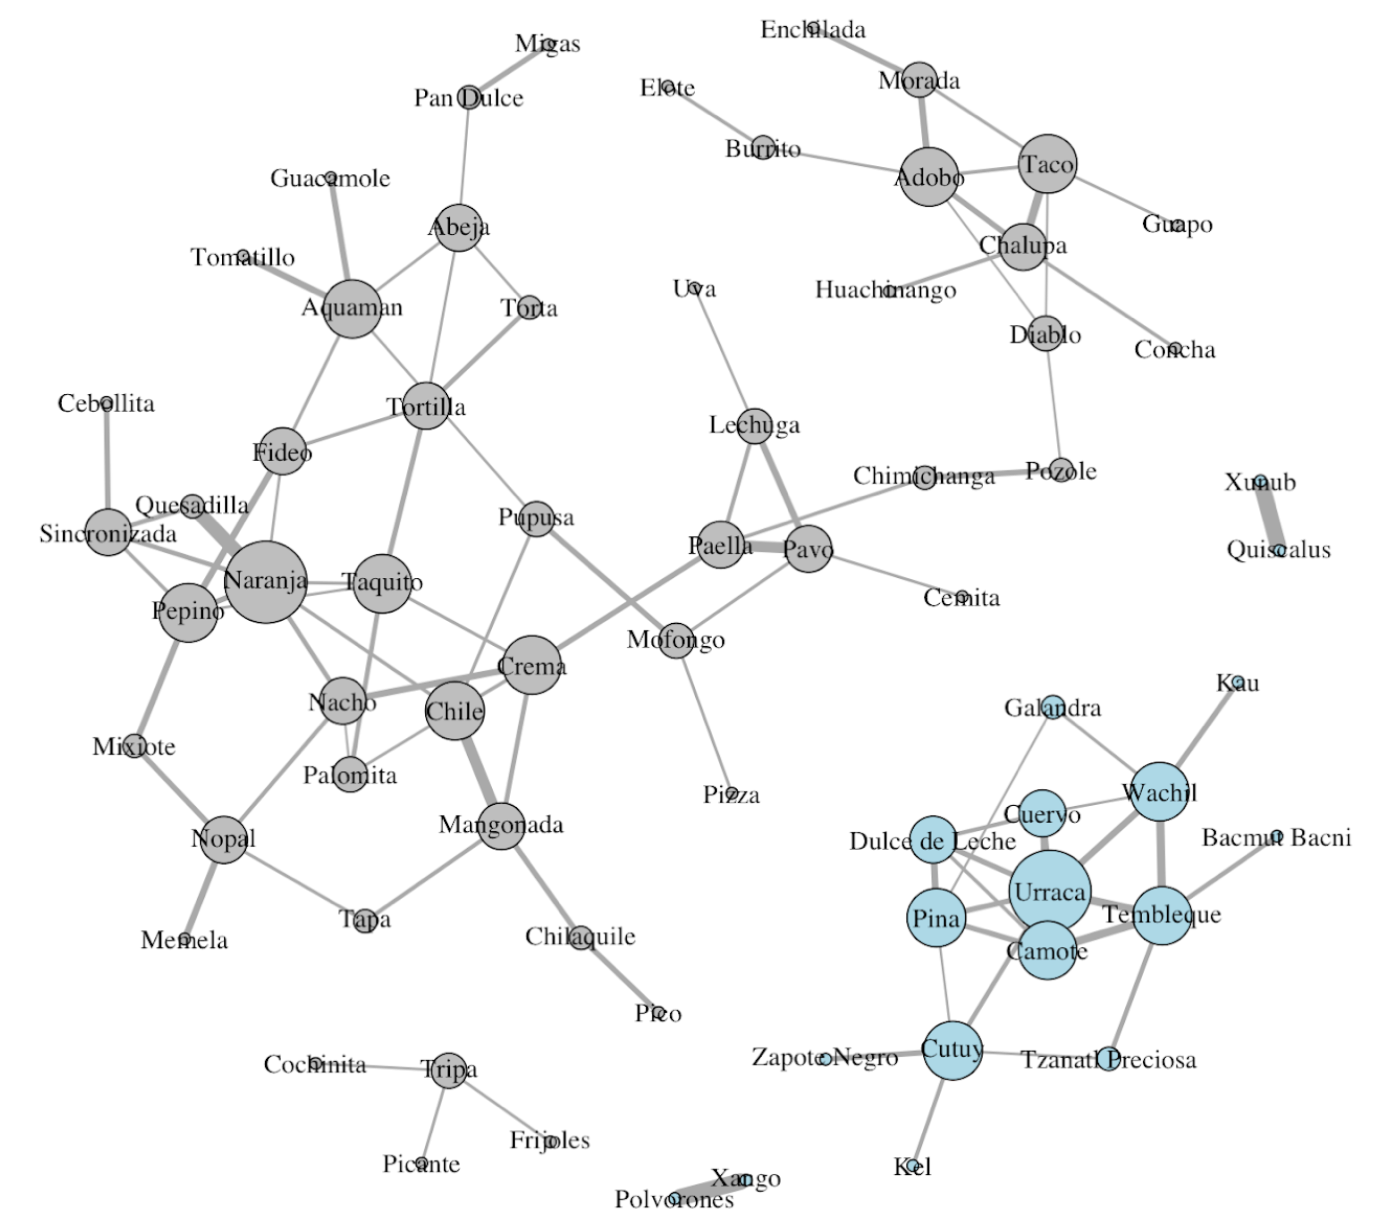
Figure 8 - Illustration of the social networks for the Arizona (gray, left) and California (blue, bottom right) grackles. Each circle (node) represents an individual and the thickness of the line (edge) connecting two nodes is the strength of the social association, calculated using the half-weight index. The arrangement of nodes and edges in the plot does not represent geographic distance.
There were no strong relationships between flexibility and the strength of the strongest bond, which supports prediction 4 alternative 1 (𝜙: mean=0.00, sd=0.02, 89%CI=-0.03-0.03; 𝜆: mean=-0.02, sd=0.02, 89%CI=-0.05-0.01; n=13 males, n=6 females; latency: mean=-0.01, sd=0.70, 89%CI=-1.12-1.10; n=11 males, n=5 females).
The more flexible individuals that were faster to switch between options on the multiaccess box had stronger individual strength (the sum of the strengths of all of the bonds they have), which supports prediction 4, while there were no strong relationships with 𝜙 or 𝜆, which supports prediction 4 alternative 1 (𝜙: mean=-0.01, sd=0.06, 89%CI=-0.10-0.09; 𝜆: mean=0.01, sd=0.06, 89%CI=-0.08-0.12; n=13 males, n=6 females; latency: mean=-0.10, sd=0.05, 89%CI=-0.17 - -0.02; n=11 males, n=5 females).
The more flexible individuals that were faster to switch on the multiaccess box had a higher degree (the total number of affiliates an individual has) in the analyses where degree was the maximum group size at the end of a focal follow as a proxy for degree, which supports prediction 4, while there were no strong relationships with 𝜙 or 𝜆 or the other measures of degree, which supports prediction 4 alternative 1 (banded to banded interactions only: 𝜙: mean=0.02, sd=0.18, 89%CI=-0.28-0.30; 𝜆: mean=0.23, sd=0.17, 89%CI=-0.04-0.51; n=13 males, n=6 females; latency: mean=-0.10, sd=0.16, 89%CI=-0.36-0.14; n=11 males, n=5 females; group size as a proxy for degree: 𝜙: mean=-0.15, sd=0.11, 89%CI=-0.32-0.02; 𝜆: mean=-0.03, sd=0.10, 89%CI=-0.18-0.13; n=7 females, n=15 males; latency: mean=-0.19, sd=0.11, 89%CI=-0.37 - -0.01; n=6 females, n=13 males). In contrast, the less flexible individuals that had higher 𝜆 values had a higher degree in the analysis where degree included interactions between banded and unbanded birds, which supports prediction 4 alternative 2, while there were no strong relationships with 𝜙 or latency, which supports prediction 4 alternative 1 (banded and unbanded interactions: 𝜙: mean=-0.01, sd=0.08, 89%CI=-0.14-0.11; 𝜆: mean=0.12, sd=0.07, 89%CI=0.00-0.23; n=8 females, n=17 males; latency: mean=-0.03, sd=0.07, 89%CI=-0.15-0.08; n=6 females, n=13 males).
All three measures of flexibility did not strongly relate with the relatedness with the individual with whom they had the strongest bond (𝜙: mean=0.02, sd=0.03, 89%CI=-0.02-0.07; 𝜆: mean=0.01, sd=0.03, 89% CI=-0.04-0.06; n=7 females, n=15 males; latency: mean=-0.01, sd=0.03, 89% CI=-0.06-0.04; n=6 females, n=13 males), or the percentage of territory a male shares with another male, which supports prediction 4 alternative 1 (𝜙: mean=0.05, sd=0.06, 89%CI=-0.06-0.15; 𝜆: mean=-0.01, sd=0.07, 89% CI=-0.12-0.10; n=26 males; latency: mean=0.03, sd=0.03, 89% CI=-0.02-0.07; n=21 males).
P5: Flexibility and Immigration
We found no association between the probability that an individual might be an immigrant, measured as their average relatedness to the remaining members of their population, and any of our measures of flexibility (𝜙: mean=0.01, sd=0.01, 89% CI=-0.01-0.03, n=38 individuals; 𝜆: mean=0.01, sd=0.01, 89% CI=-0.01-0.03, n=38 individuals; latency: mean=0.01, sd=0.01, 89% CI=-0.02-0.03, n=28 individuals).
P6: Flexibility and Microhabitat Diversity
For both sexes, the Shannon Diversity Index, a measure of the proportion of time spent in each habitat, does not have a strong relationship (as indicated by the compatibility interval crossing zero) with 𝜙 or 𝜆 (n=9 females, average follows=4.2, range=1-6; n=26 males, average follows=4.6, range=1-8; 𝜙 females: mean=-0.26, sd=0.64, 89%CI=-1.37-0.65; males: mean=0.15, sd=0.63, 89%CI=-0.85-1.13; 𝜆 females: mean=-0.32, sd=0.63, 89%CI=-1.34-0.71; males: mean=0.06, sd=0.55, 89%CI=-0.88-0.87), or with latency (females: n=7 birds, mean=0.35, sd=0.66, 89%CI=-0.81-1.34; males: n=21 birds, mean=0.11, sd=0.49, 89%CI=-0.74-0.79; Figure 9). As such, prediction 6 (the more flexible individuals have a higher diversity index) and prediction 6 alternative (the more flexible individuals have a low diversity index indicating that they are specialists) are not supported.
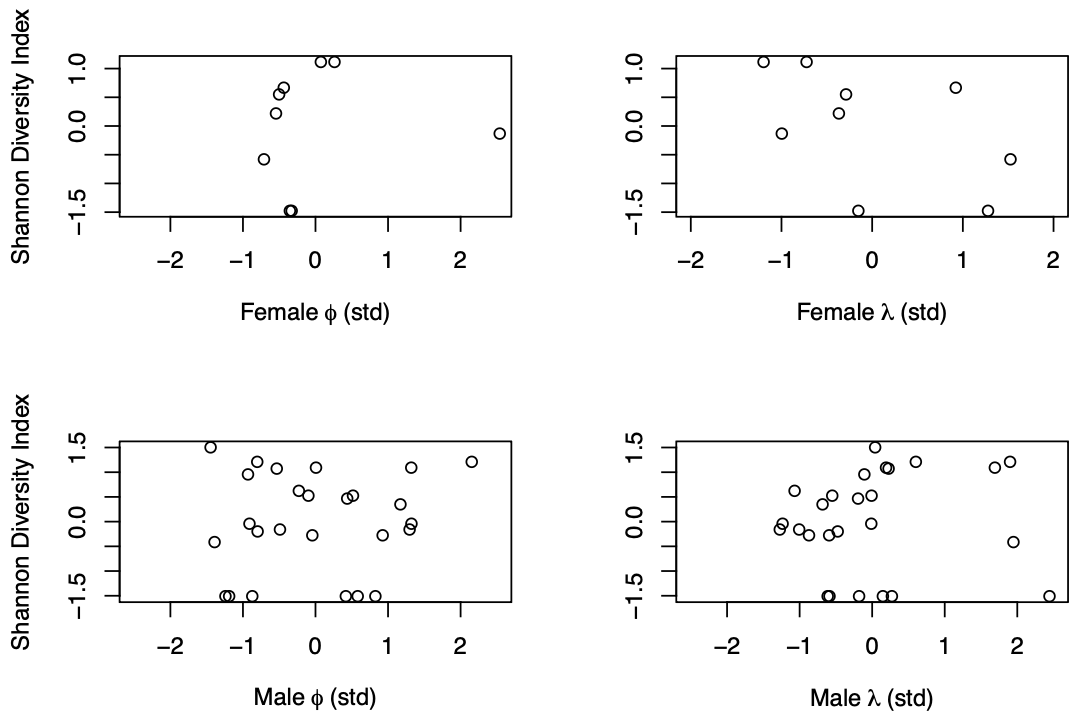
Figure 9 - Scatterplots showing the lack of relationship between the Shannon DIversity Index (microhabitat diversity) and 𝜙 (learning rate of attraction) and 𝜆 (rate of deviating from learned attractions) for both sexes. Variables are standardized (std), meaning that the mean is centered on zero.
P7: Human Population Density Across Sites
Human population density (population per square mile) is higher in Sacramento, California (mean=4,895, sd=185) than in Tempe, Arizona (mean=4,283, sd=187), and the latter is higher than Woodland, California (mean=3,710, sd=140) (Table 3).
Table 3 - Contrasts showing that the human population density at each trap site is different from the others.
Comparison | Mean | Standard deviation | Lower 89 percentile compatibility interval (5.5%) | Upper 89 percentile compatibility interval (94.5%) |
Sacramento-Woodland | 1185.28 | 37.53 | 1124.43 | 1245.74 |
Sacramento-Tempe | 612.48 | 36.32 | 555.64 | 670.52 |
Woodland-Tempe | 572.79 | 39.02 | 510.76 | 634.85 |
P8: Flexibility and Microhabitat Types
Females with the higher 𝜙 values (more flexible) had fewer focal follows in the tree microhabitat. Outside of this, there is not a strong relationship between 𝜙, 𝜆 (n=7 females; n=26 males), or the latency to switch between options on a multiaccess box (n=5 females; n=21 males) (all measures of flexibility) and the proportion of focal follows in a given microhabitat type: the compatibility intervals for the slopes cross zero (Figure 10, Table SM3; Logan, 2025).
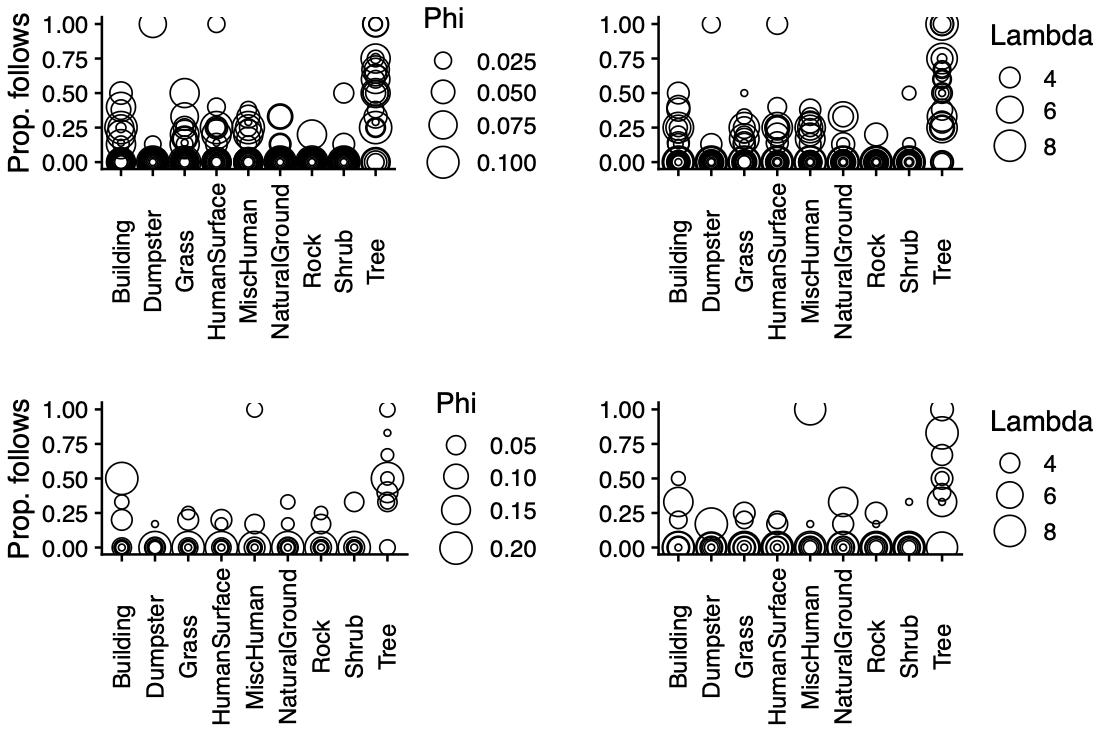
Figure 10 - Scatterplots for females (top row) and males (bottom row) showing the relationship between the proportion of follows in a particular microhabitat and 𝜙 (learning rate of attraction; left column) or 𝜆 (rate of deviating from learned attractions; right column). Larger diameter circles indicate a larger 𝜙 or 𝜆.
Discussion
We investigated the relationships between flexibility, measured as performance in a reversal learning task and the latency to switch options on a multiaccess box, and foraging, social, and habitat use behaviors in two populations of grackles. In the following, we discuss whether our predictions are generally supported or not by looking at the combined evidence across the different analyses we used to assess each prediction.
Flexibility did not relate to foraging habits when using data from all individuals from both populations. We found support for an even number of negative, positive, and no relationships between flexibility (reversal 1) and the number of food types taken and foraging techniques used depending on the sex of the bird and the flexibility measure (Prediction 1). For the flexible individuals who used fewer food types, this was not due to their being selective of higher value food types (indicated by more calories; Prediction 1 alternative 2). Note that, while calories are a common measure of the energy value of food (Merrill & Watt, 1955), other measures of value might be interesting to investigate in the future, for example nutrient content. However, when comparing the individuals who underwent a flexibility manipulation using serial reversal learning with the control group, there was an effect (Prediction 2). The more flexible manipulated individuals used more food types and foraging techniques than control individuals, indicating that manipulating flexibility had a causal effect on foraging habits. This pattern parallels previous findings in this species that showed flexibility is not strongly related to innovativeness (measured as innovating stick tool use and string pulling; Logan, 2016c). However, after undergoing a flexibility manipulation using serial reversal learning, manipulated individuals solved more loci on a puzzlebox than the control individuals, indicating that an increase in flexibility was related to a subsequent increase in innovativeness (Logan et al., 2023). Indeed, grackle flexibility is itself flexible - it changes across multiple color reversals to match the reliability and stability of the environment they experience (Lukas et al., 2022). Taken together, these results suggest that it requires a manipulative experiment to be able to reduce the noise from correlational studies enough to make robust conclusions about the relationship between flexibility and foraging/foraging technique breadth. Such studies could capitalize on natural experiments as a manipulator of flexibility. For example, Chaby et al. (2015) found that rats who grew up in a stressful environment were more flexible (measured as reversal learning) than those who grew up in a less stressful environment. If this was validated in other systems and in the wild, it would be a useful way to use a natural experimental design. Future studies could also manipulate flexibility in the wild, which makes logistics potentially more feasible for more researchers. See the replicable research program, ManyIndividuals (Logan et al., 2022), for two different study designs, analysis plans, and R code for how to conduct such a study.
We found support for eight negative relationships, one positive relationship, and nine instances of no strong relationship between flexibility (reversal 1) and the proportion of the diet that was human food, and negative or no relationships with distance to a human food source or number of human food sources within their home range depending on the sex of the bird and the flexibility measure used (Prediction 3). Because of this mixed support, we conducted an unregistered analysis to evaluate whether, overall, the prediction was supported or not and, if so, in which direction. Overall, results indicate that human foods are disproportionately used more by the less flexible individuals. This is consistent with the result above that the flexibility manipulated individuals ate more food types, thus having a more diverse diet than the less flexible individuals. We originally thought that the more flexible individuals would use more human foods because they might stay near their parent’s home range or move around to seek out new opportunities. We found that individuals in the Arizona population did not disperse very far (Sevchik et al., 2022), and individuals in the California population moved large distances across daily and annual time periods (McCune et al., 2020 Stage 1 and the Stage 2 is in prep.). Despite this, flexibility was overall negatively related to the proportion of human foods taken and the number of human food sources within a home range, potentially because the less flexible individuals might specialize on human foods. Because this species is highly associated with human modified landscapes going back as far as we have records for (e.g. Christensen, 2000; Haemig, 2011), we predicted they would likely rely on human foods as part of the reason for this association. However, an alternative possibility is that this species’ shift toward using more urban and arid environments (Summers et al., 2023) might not be due to grackles relying more heavily on human foods, but rather urban water sources. Grackles eat a variety of natural foods (e.g., insects, worms, fruit), which are present in urban and non-urban habitats. The water available in an urban area via fountains, sprinklers, human-made ponds, lakes, and waterways can provide a stark contrast to the surrounding natural areas, which might be dominated by deserts (as in both grackle populations), forests, or agriculture (as in the California population).
We found support for one negative relationship, four positive relationships, and 18 instances of no strong relationship between flexibility (reversal 1) and the sociality variables in Predictions 4 and 5. Overall, we did not find support for a strong relationship between flexibility and strength of the strongest bond, average bond strength, degree (the number of individuals one associates with), whether a male shares his territory with another male, relatedness of the strongest bond (Prediction 4), or the probability of being an immigrant (Prediction 5). This is perhaps because all individuals, not only the flexible ones, are able to form bonds with a variety of individuals. Even though 94 individuals in Arizona and 35 individuals in California were banded, they did not often exhibit affiliative behaviors with other individuals in their focal follows, which means that there was not much social data. It was also difficult to meet the two focal follows in the non-breeding season minimum criterion despite the thousands of hours spent searching for banded individuals (many of whom had radio tags). Perhaps these difficulties are why there is a lack of literature on empirical studies of flexibility as it relates to social behaviors. This topic will become more accessible when technology becomes functional enough to track individuals throughout their home ranges. However, the technology we have tried so far does not have the capacity to collect data at this scale. Additionally, selecting species that exhibit more affiliative behaviors than grackles would help in terms of collecting more data per unit of time.
Aside from the more flexible females using trees less than other habitat types, there were no strong relationships between flexibility as measured in the aviaries and microhabitat diversity measured after their release back to the wild (Predictions 6 and 8). This suggests that flexibility is not associated with foraging strategy specialization or generalization at the microhabitat level. In contrast, a cross-species meta-analysis by MacLean & Beissinger (2017) found that habitat breadth, but not diet breadth, was associated with geographic range shifts. Even if our habitat categories were at too small of a resolution to be able to detect differences, grackles exist almost exclusively in human-modified habitats. Therefore there would likely not be enough variation at the individual or population level to evaluate hypotheses about variation in habitats as it relates to other variables. Human population density varied within and between the grackle populations: it was the highest and lowest at the Woodland trap sites (both trap sites were experienced by some of the same individuals), which were different from each other and from Tempe (Prediction 7). This confirmed our prediction that grackle populations are highly associated with human modified landscapes. The wide variation in human population densities at the Woodland site leads us to wonder if there is a lower threshold of human population density below which is too small to attract grackles. It would be interesting to explore differences and similarities between cities above and below this threshold to identify which urban features are more attractive for grackles.
We found relationships between flexibility and foraging, but not social or habitat use behaviors. This could suggest that social and habitat use behaviors are potentially formed early in life and individuals are less likely to change these behaviors when circumstances change. Another explanation is that we did not have enough power to detect potentially weak relationships. With our sample sizes for the social and habitat use behaviors, we had the power to detect large effects and sometimes also medium effects. Even if relationships do exist, they would be so weak that the social and habitat use behaviors could not serve as reliable proxies for flexibility.
The finding that the manipulated birds used more foraging techniques led us to conduct an unregistered analysis, which showed that the manipulated individuals switched among the various food types and foraging techniques at higher rates - an effect that continued for at least eight months after the manipulation occurred. This discovery was unexpected and has some implications. We can use this as a new measure of flexibility because it involves switching behaviors in response to environmental change. This flexibility measure is much more feasible to collect than measuring flexibility in a controlled experiment like reversal learning because this data is easily extracted from focal follows, which involve the observation of identifiable individuals in the wild. The different measures that can be collected from foraging focal follow data are similar to the innovativeness and flexibility tests on the multiaccess puzzle box where the total number of loci solved is the measure of innovativeness and is similar to the total number of foraging techniques used in focal follows (Logan et al., 2023). Whereas the latency to switch to attempting to solve a new locus on the multiaccess box is the measure of flexibility and is similar to switching among different foraging techniques in focal follows. Therefore, where we previously only used this kind of foraging data to measure innovativeness (i.e., number of food types and foraging techniques), we can now also use this data to measure flexibility (i.e., number of switches among food types and foraging techniques per minute).
To understand whether flexibility is directly involved in facilitating adaptations to new environments, manipulative experiments are needed. Manipulating one variable of interest is crucial to determining whether it has an effect on one or more other variables because it reduces the noise in correlations enough to resolve relationships. We recently demonstrated this in McCune et al. (2025), which investigated relationships between flexibility and exploration, boldness, persistence, and motor diversity. Flexibility was found to only relate to exploration and only when comparing the control versus flexibility manipulated grackles: the manipulated grackles were more exploratory. We demonstrate this principle again here with the finding that flexibility and foraging behavior are related only when comparing control versus flexibility manipulated grackles: the manipulated grackles have more foraging behaviors. The accumulating evidence from our manipulative investigations implicates flexibility as a facilitator of exploratory behavior (McCune et al., 2025), which likely leads to discovering more foraging behaviors. These features could contribute to the rapid geographic range expansion this species is undergoing. This evidence also indicates that, to arrive at robust conclusions about how behaviors relate to each other, the variables of interest must not only be measured directly at the individual level, rather than via proxies (Logan et al., 2018), but also investigated in an experimental context where the key behavior can be manipulated. This reveals that using proxies of behaviors (i.e., not directly testing behavior) at the individual and cross-species levels to investigate correlations between flexibility and foraging, social, and habitat use behaviors result in a high degree of uncertainty and an insufficient ability to draw conclusions. Similar conclusions have been reached in research on flexibility in clinical psychology, where unclear definitions and issues of measurement have hindered the understanding of ecological and construct validity (Uddin, 2021).
In conclusion, grackles who were manipulated to be more flexible used a wider variety of foods and foraging techniques. Given that this species is rapidly expanding its geographic range (Wehtje, 2003) and shifting more toward urban and arid environments (Summers et al., 2023), our finding could suggest that foraging breadth is a factor in facilitating such an expansion. Our findings highlight the importance of directly testing the causal effects of increasing flexibility and the subsequent changes in other behaviors that are potentially involved in the range expansion and how individuals adapt to changing environments. Additionally, in humans, researchers have argued that, to fully understand cognitive and behavioral flexibility, interventions are required to reveal the relevance and transferability of the increased flexibility to daily life (Conesa & Duñabeitia, 2021). Until recently, it was unknown how to manipulate flexibility effectively and, even if there was such an intervention, it was unlikely to be possible to implement it in the wild outside of a lab context. Our approaches solved these problems and have opened up the field to investigating the causal role of flexibility in the wild (Logan et al., 2022, 2023).
Ethics
This research is carried out in accordance with permits from the:
US Fish and Wildlife Service (scientific collecting permit number MB76700A-0,1,2)
US Geological Survey Bird Banding Laboratory (federal bird banding permit number 23872)
Arizona Game and Fish Department (scientific collecting license number SP594338 [2017], SP606267 [2018], and SP639866 [2019])
California Department of Fish and Wildlife (scientific collecting permit number S‐192100001‐19210‐001)
Institutional Animal Care and Use Committee at Arizona State University (protocol number 17-1594R)
Institutional Animal Care and Use Committee at the University of California Santa Barbara (protocol number 958)
University of Cambridge ethical review process (non-regulated use of animals in scientific procedures: zoo4/17 [2017])
RegionalSan access permit (number AP 2021-01)
Author Contributions
Logan: Hypothesis development, study design, materials, data collection, data analysis and interpretation, write up, funding.
Lukas: Hypothesis development, study design, data analysis and interpretation, write up, revising/editing.
Geng: ddRADseq, revising/editing.
Hardy: ddRADseq, revising/editing.
LeGrande: Data collection, data analysis and interpretation, revising/editing
Marfori: Data collection, revising/editing.
MacPherson: Data collection, revising/editing.
Rowney: Data collection, revising/editing.
Smith: DNA extraction to prepare samples for ddRADseq, revising/editing.
McCune: Hypothesis development, study design, data collection, data analysis, data interpretation, revising/editing.
Appendices
Supplementary Materials 1-4 and A-D are available at https://doi.org/10.17605/OSF.IO/T3NQ7 (Logan, 2025).
Acknowledgements
Preprint version 3 of this article has been peer-reviewed and recommended by Peer Community in Ecology (https://doi.org/10.24072/pci.ecology.100703; Sebastián González & Astegiano, 2025). We thank our pre- and post-study manuscript PCI Ecology recommenders, Esther Sebastián González and Julia Astegiano, reviewers Esther Sebastián González and Pizza Ka Yee Chow for their beneficial feedback before the study began, and three anonymous reviewers of the post-study article for their wonderful feedback that greatly improved the manuscripts. We are grateful to Ben Trumble for providing us with a wet lab at Arizona State University and Angela Bond for lab support; Melissa Wilson for sponsoring our affiliations at Arizona State University and lending lab equipment; Kevin Langergraber for serving as local PI on the ASU IACUC; Kristine Johnson for technical advice on great-tailed grackles; Arizona State University School of Life Sciences Department Animal Care and Technologies for providing space for our aviaries and for their excellent support of our daily activities; Julia Cissewski and Sophie Kaube for tirelessly solving problems involving financial transactions and contracts; Richard McElreath for tremendous project support and analysis assistance; Aaron Blackwell and Ken Kosik for being the UCSB sponsors of the Cooperation Agreement with the Max Planck Institute for Evolutionary Anthropology; Aaron Blackwell and Maryam Edrisi for conducting DNA extractions and shipping samples to Cornell; Bronwyn Butcher at Cornell University, and Kristin Hardy and Xin Yi He at the University of Rochester for conducting ddRADseq on the DNA to obtain the relatedness measure; Ann Brice for hosting the California aviary and lab space; Tim Busch at the Woodland-Davis Clean Water Agency, Bryan Young and Chris Conard at RegionalSan, and Conaway Ranch for hosting the California field research on their land; Dr. Rhonda Oates and the vet team at UC Davis for veterinary consultations; Luisa Bergeron, Zoe Johnson-Ulrich, and Melissa Folsom for conducting focal follows and field research, August Sevchik for helping in the field and in the aviaries, and Sawyer Lung for field support in Arizona; Alexis Breen for assistance with data transcription; our California research assistant, Josephine Hubbard, and our Arizona research assistants: Aelin Mayer, Nancy Rodriguez, Brianna Thomas, Aldora Messinger, Elysia Mamola, Michael Guillen, Rita Barakat, Adriana Boderash, Olateju Ojekunle, August Sevchik, Justin Huynh, Jennifer Berens, Amanda Overholt, Michael Pickett, Sam Munoz, Sam Bowser, Emily Blackwell, Kaylee Delcid, Sofija Savic, Brynna Hood, Sierra Planck, and Elise Lange. We are forever grateful to the grackles who participated in this research.
Funding
This research was funded by the Department of Human Behavior, Ecology and Culture at the Max Planck Institute for Evolutionary Anthropology, and by a Leverhulme Early Career Research Fellowship to Logan (2017-2018).
Conflict of interest disclosure
The authors declare that they comply with the PCI rule of having no financial conflicts of interest in relation to the content of the article. The authors declare the following non-financial conflict of interest: Logan and Lukas are Recommenders at PCI Ecology and PCI Registered Reports, and Logan was on the Managing Board at PCI Ecology (2018-2022) and is on the Managing Board at PCI Registered Reports (2021-current).
Data, scripts, code, and supplementary information availability
Data and code are available online: https://doi.org/10.5063/F1DF6PP5 (Logan & McCune, 2025). Supplementary information is available online: https://doi.org/10.17605/OSF.IO/T3NQ7 (Logan, 2025).