
 CC-BY 4.0
Introduction
Carbon uptake by vegetation is the main carbon sink on Earth, fixing an estimated 3.4 Gt of C per year from the atmosphere (Friedlingstein et al., 2021). However, the uncertainty affecting this estimation is high (Brienen et al., 2015; Lovenduski & Bonan, 2017). Various international efforts have been initiated recently to develop space-based missions dedicated to AGB monitoring, which should reduce the large uncertainties around carbon stock and flux estimates on a global scale. Among the most prominent are GEDI (Global Ecosystem Dynamics Investigation; Duncanson et al., 2020), NASA-ISRO (NISAR) and the European Space Agency (ESA) BIOMASS (Carreiras et al., 2017). Since the availability of dedicated global remote sensing products has increased and will continue to increase, ground truth reference data is becoming the limiting factor in mapping carbon on a global scale (Duncanson et al., 2019, 2021). There is a particular deficit of accurate ground data in the tropics, where forest inventories cover only a tiny fraction of the total area of natural forests (Chave et al., 2019). The problem is not only the limited coverage but also the quality of data. Indeed, estimating plot-level AGB from tropical forest inventories faces challenges from the diversity of tree species and the density of the canopy (Marvin et al., 2014; Réjou-Méchain et al., 2019; Duncanson et al., 2021).
Monitoring AGB from plot inventory data typically involves the use of allometric models to infer individual trees’ above-ground biomass (AGB) from their dimensions (height and diameter) and wood density (Chave et al., 2005, 2009; Vincent et al., 2014; Xu et al., 2018). Two types of allometric models are used sequentially: 1/ Since tree height (H) is rarely measured directly in forest inventories, an allometric model is first required to estimate H from stem diameter, 2/ an allometric model to infer tree AGB from a combination of H, stem diameter and wood density. Due to the extremely high species diversity in tropical forests and the paucity of available data, non-species-specific pantropical allometries have been built and applied across the tropics (Feldpausch et al., 2011; Chave et al., 2014; Duncanson et al., 2022).
Various studies have highlighted the uncertainty stemming from using pantropical H-DBH allometries in biomass estimates (Feldpausch et al., 2011; Loubota Panzou et al., 2018) and have refined them, e.g. at continental scales (Loubota Panzou et al., 2021). But even when continental-scale differences or bioclimatic factors are considered in pantropical models, they only cover coarse spatial scales and cannot account for within- or between-site variation below that scale. The latter may arise from differences in local fertility, local drainage (Ferry et al., 2010), disturbance history (Rutishauser et al., 2016), or floristic composition. The extreme floristic richness of tropical forests has precluded the development of species-specific allometries, a difficulty compounded by tree height estimation with field instruments (hypsometers and laser meters), which are prone to bias in tall dense forests. In such environments, field measurements of tree height result in data of questionable quality (Larjavaara & Muller-Landau, 2013; Hunter et al., 2013; Lima et al., 2021; Terryn et al., 2024). In addition, the high cost of field data collection constrains the sampling effort (Colgan et al., 2013; Sullivan et al., 2018), further reducing the accuracy of local allometries as lower sampling intensity increases estimate uncertainty.
LiDAR (Light Detection and Ranging) technology offers an opportunity to improve the accuracy of individual tree height estimates. Airborne laser scanning (ALS) and terrestrial laser scanning (TLS) can characterize the 3D structure of forests with high precision, both vertically (Vincent et al., 2010; Dassot et al., 2011) and horizontally (Aubry-Kientz et al., 2021). TLS has the potential to directly estimate the volume of individual trees (and the AGB as product of the volume and the wood density), thus allowing the refinement of existing allometric models or theoretically even circumventing the need for H-DBH and AGB allometries (Momo Takoudjou et al., 2018; Stovall et al., 2018) . However, to date, accurate individual tree AGB estimation is error-prone due to inaccuracies in tree segmentation and may require clearing the understory and neighboring trees prior to scanning (Momo Takoudjou et al., 2018). Additionally, it involves time-consuming manual segmentation of scans into individual trees. The applicability of TLS for estimating AGB at the plot level in dense forests on an operational basis has not yet been established (Wilkes et al., 2017; Gonzalez de Tanago et al., 2018; Martin-Ducup et al., 2021).
ALS, on the other hand, does not directly measure wood volume, but provides accurate descriptions of canopy surface (so-called canopy height models, or CHMs) at a much larger scale. Therefore, ALS is often used to upscale plot data via statistical models that relate metrics extracted from the canopy height model to plot-based AGB estimates (Asner et al., 2010; Coomes et al., 2017; Labriere et al., 2018; Rodda et al., 2024). ALS-derived data can also directly improve the accuracy of plot-level AGB estimates by matching information from ground inventories to information on canopy height, implicitly developing allometric models for the H-DBH relationship (e.g. Fischer et al., 2020). This fitting of H-DBH relationships from a combination of inventory and ALS data can be carried out at larger scales than field-based height estimates and is less time-consuming than TLS-based work. It thus provides a unique opportunity to refine pantropical or site-specific allometric relationships by including species identity or relevant local environmental factors. Furthermore, through its 3D reconstructions of entire landscapes, ALS also provides the opportunity to explore how tree height varies along topographic and hydrographic gradients. Local terrain features may indeed influence local forest structure (Detto et al., 2013; Zhang et al., 2025) and, by extension, allometries (Molto et al., 2013).
The present study uses ground inventory data from a site in French Guiana with a vast network of permanent sample plots (total area of 118.75 ha) and merges it with ALS data in two ways: 1/ The first approach relies on 3,304 (with stem diameters varying from 10 cm to 150 cm) tree height and diameter estimates obtained by manually matching ALS-derived crown heights to DBH measurements from ground plots (dataset 1). These data, representing easily discernible crowns, correspond to an average of 8% of individuals over 10 cm stem diameter (based on four plots that were segmented in their entirety) from the permanent sample plots inventory. 2/ The second approach relies on the Canopy Constructor, an individual-based model that automatically merges ALS-derived CHMs with field inventories (Fischer et al., 2020). Using the site-specific allometry from the first approach as a prior and iteratively minimizing the difference between the observed and the simulated CHMs through the second approach, the inference of tree dimensions could thus be extended to all trees and species in the site’s large plot network (29,444 stems with stem diameter>20 cm, dataset 2).
In this study we address four different questions (testable hypotheses) related to H-DBH allometry variability and its importance in AGB estimates derived from plot inventories (Figure 1).
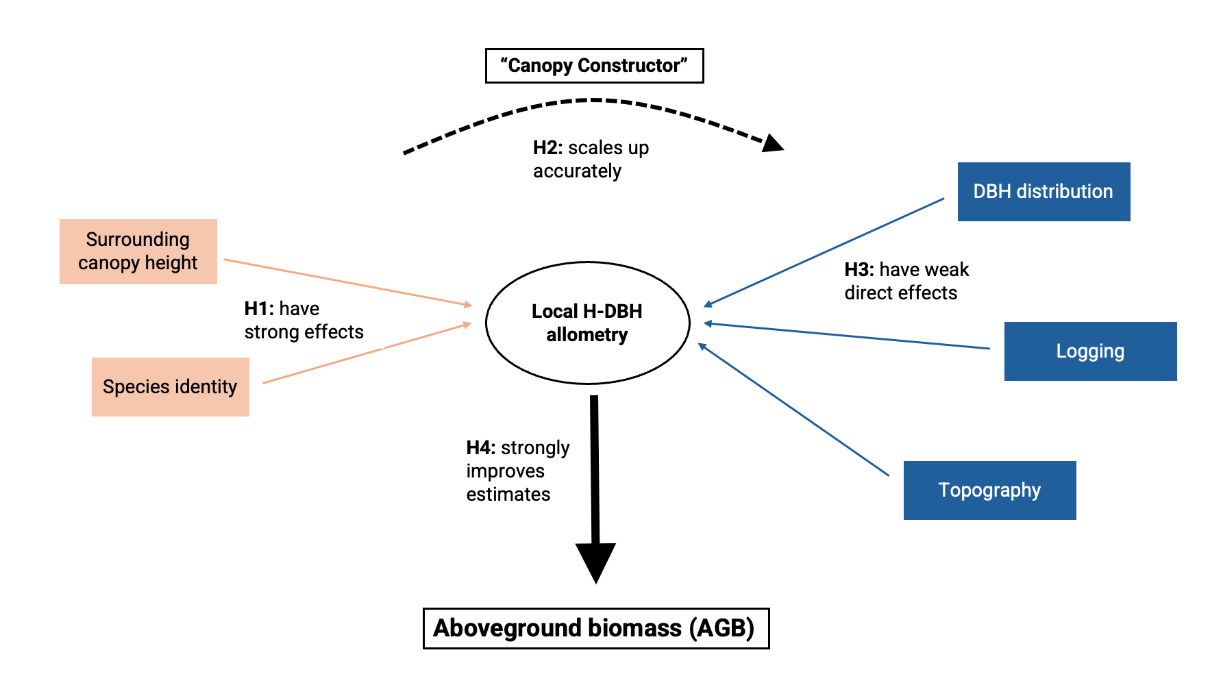
Figure 1- Schematic diagram illustrating the central research focus of our study, highlighting the fundamental hypotheses and key factors guiding our exploration of H-DBH allometry variability and its impact on accurate AGB estimates.
1/ How do species identity and the surrounding canopy height shape allometries locally? To answer this question, we use dataset 1 to model H-DBH relationships within a nested Bayesian modeling framework. We start with a single allometry for the entire site, refine the model to include a covariate for the canopy height in a local neighborhood, and finally, develop a full model considering species identity.
2/ Can we reliably extend data records beyond manually derived H-DBH data using an automated procedure such as Canopy Constructor (CC)? To evaluate the reliability of the tree heights inferred from the Canopy Constructor (dataset 2), we examine how accurately they match manual measurements (dataset 1). In particular, we compare Canopy Constructor estimates to predictions from allometric models in 1/ and to species-specific allometries.
3/ Do topography, logging history or tree diameter distribution modify allometries locally? Unlike dataset 1, the Canopy Constructor-generated dataset 2 provides estimates of tree dimensions for all trees in an inventory. Thereby it offers spatially dense information on tree size, which we use to explore subtle variations in height allometries with topography/drainage regime, logging history and forest structure characteristics (basal area and quadratic mean diameter).
4/ How large are the effects of ignoring local H-DBH variations on AGB estimates? Considering dataset 2 as the best estimate of tree dimensions across the inventory, we compare the derived AGB estimates from that dataset to those obtained with pantropical allometry, as well as gradually refined models from dataset 1.
Materials & methods
Study site
The study was conducted at the Paracou experimental station (5° 18’N - 52° 53’W) in French Guiana. This lowland rainforest is dominated by the tree families Lecythidaceae, Fabaceae and Chrysobalanaceae; 700 species are registered on the site, 18% of which are species with a single observation. The climate is influenced by the Intertropical Convergence Zone, with an average annual temperature of 26°C and a pluviometry characterized by long periods of precipitation (annual average of 3,113 mm during 1980–2023), interrupted by a short dry season in March and a longer dry season from mid-August to mid-November (station Savane Combi - Météo France, data accessible at https://donneespubliques.meteofrance.fr/). A slightly undulating topography characterizes the site, resulting in a dense hydrographic network that forms seasonally flooded bottomlands and a succession of small hills with often steep slopes and flat tops (Schmitt, 1984). The dominant soil type is shallow ferralitic, typical of the eroded soil covers in northern French Guiana (Sabatier et al., 1997; Guitet et al., 2015), but deeper, well-drained ferrallitic soils also occur in some interfluves. Low-permeability acrisols are found on slopes up to hilltops and plateaus, leading to superficial drainage during intense rainfall (Barthès, 1989; Gourlet-Fleury et al., 2004).
At the site in the plots managed by the Centre de Coopération Internationale en Recherche Agronomique pour le Développement (CIRAD), four hydromorphological units have been identified by Ferry et al. (2010) and Morneau (2007) and delimited according to the degree of waterlogging and the terrain slope angle: hilltop (flat to gentle slope, low soil waterlogging, occupying 24% of the plots area), slope (medium to steep slope, low-intensity waterlogging, 37%), downslope (flat to gentle slope, medium intensity waterlogging, 30%) and bottomland (flat, high-intensity waterlogging, 9%).
Inventory data
A network of large permanent sample plots totaling 118.75 ha is maintained on the site by the Centre International de Recherches pour le Développement (CIRAD), including intact and logged-over forest (Huertas et al., 2022). Nine plots of 6.25ha were logged between 1986 and 1988 following three silvicultural treatment modalities (increasing intensity from T1 to T3 – Figure 2). Another six 6.25ha plots and a 25ha plot are undisturbed forest plots. The 25ha plot has a higher mean canopy height than the other control plots (30.3m vs. 28.2m) and is referred to as Tall Undisturbed Forests (TUF), while the other controls are referred to as Short Undisturbed Forests (SUF) (Figure 2 and Huertas et al., 2022). In addition to the CIRAD network, smaller plots have been set up close to the Eddy flux tower (Figure 2, black cross). Ten plots (totalling 5.5 ha) are managed by the Institut National de Recherche pour l’Agriculture, l’Alimentation et l’Environnement (INRAe) and 1ha forest plot by the Institut de Recherche pour le Développement (IRD).
In each inventory, the same measurement protocol is applied. The stem diameter – measured at breast height (DBH, measured at 130 cm from the ground or 50 cm above buttresses) is recorded at each census. All new recruits (stem diameter >= 10 cm) are identified by taxonomists to species level whenever possible or higher taxonomic level when species cannot be ascertained, and located using a meter tape. Species names in the field database were homogenized using the library “Leipzig Catalogue of Vascular Plants” (LCVP) in R - (Freiberg et al., 2020), and species- (or higher) level wood density (WD) extracted from the global wood density database (Chave et al., 2009) - WD in g/cm3 according to standard protocols. Here, we use inventory data from 2015 (25ha TUF plot) and 2016 (15 6.25ha plots), ensuring that all mentioned plots are included in this study. The TUF plot is measured every five years, while the majority of the 6.25 ha plots are measured at intervals of two years or less. The years 2015 and 2016 were chosen because they are the closest to the airborne LiDAR acquisitions (cf. next section). No physical specimens (e.g., voucher specimens) were deposited in a herbarium or biological repository. However, all tree identifications and measurements are part of the long-term forest monitoring program at Paracou, managed by CIRAD. Taxonomic determinations were conducted in the field by expert botanists, and all data (including species names, stem coordinates, and DBH measurements) are stored in CIRAD’s institutional database. These data are available upon reasonable request (https://paracou.cirad.fr/).
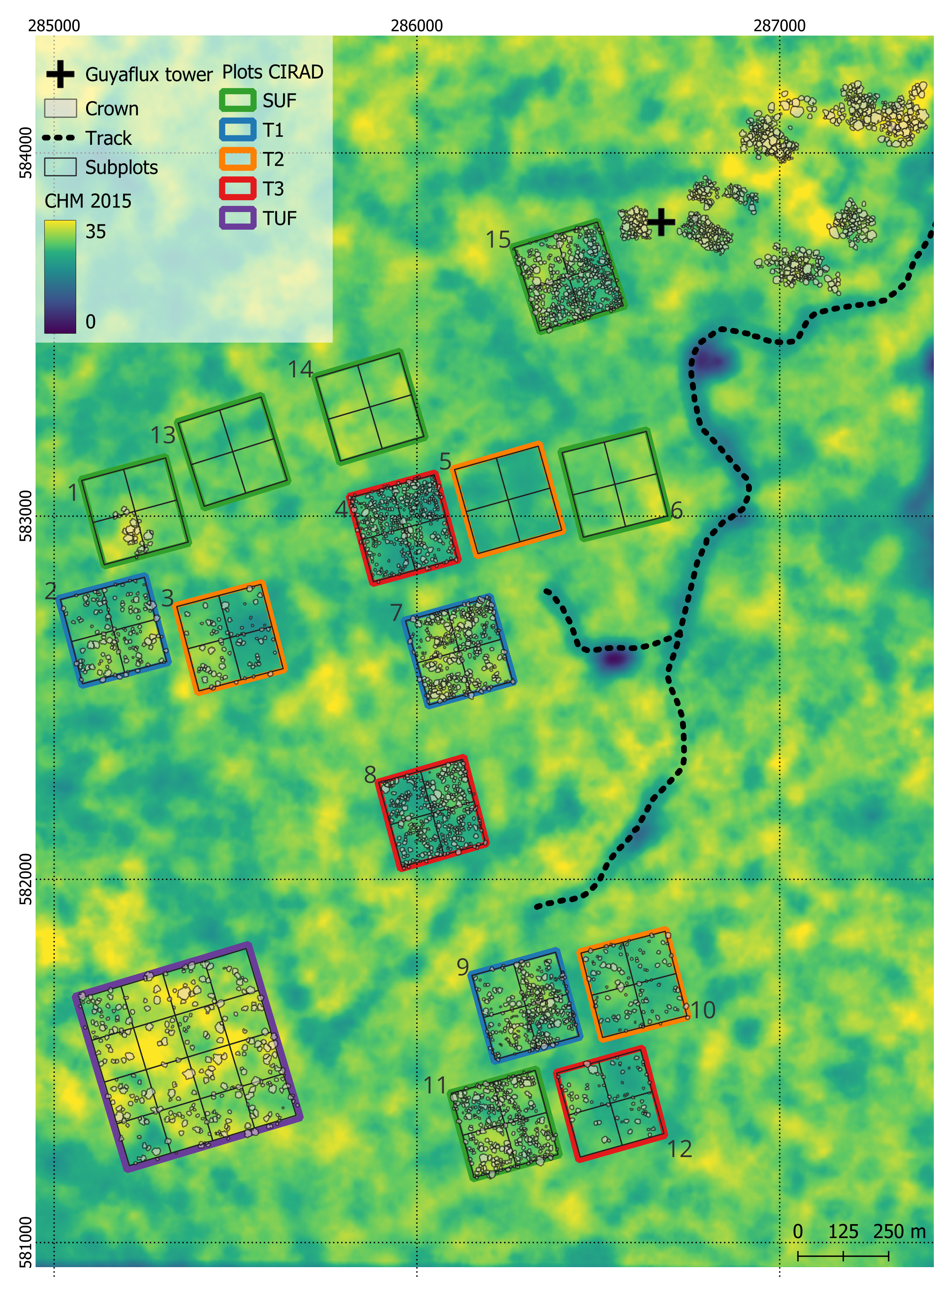
Figure 2 - Distribution of the tree crowns in dataset 1 (n=3,304). Also shown are the outlines of the CIRAD inventory plots, colored according to treatment types: SUF in green, T1 in blue, T2 in orange, T3 in red, and TUF in purple. The numbers of the plots are positioned outside their respective borders. These plots were used to create dataset 2, i.e., a tree crown dataset based on 3D reconstructions with the Canopy Constructor algorithm (~77,200 stems abov 10 cm diameter). Notably, the ‘Eddy Flux Tower’ is marked with a black cross. The canopy height model (CHM), smoothed by averaging at a resolution of 30m, is shown in the background.
LiDAR data
ALS data was acquired in 2016 by the private company Altoa (http://www.altoa.fr/) with an LMS-Q780 RIEGL LiDAR; the average altitude of the flights was 800m, the scan angle ± 20° and the mean footprint size at the ground level 20 cm. The average density was 25 pulses m-2. During scanning, an optical camera also collected imagery at 10 cm resolution, which was later orthorectified.
The point cloud data were processed with LAStools software (version 210128) and the lidR package (version 3.2.1, Roussel et al., 2020). Ground points were classified using the lasground function in LAStools, and a 1 m2 resolution digital terrain model was produced via las2dem function in LAStools. Finally, we normalized point height by subtracting the terrain height via LAStool’s lasheight function and derived a Canopy Height Model (CHM) by taking the highest first return per 1-m2 cell.
Creation of matched height-DBH datasets
To assess the allometric relationship between stem diameter and tree height, we matched the inventory data to ALS-derived tree height estimates in two ways: a manual delineation and matching procedure with ground truthing (dataset 1) and an automatic matching procedure via the Canopy Constructor algorithm (dataset 2, cf. Figure 2).
Manual crown delineation and stem-crown matching (dataset 1)
For dataset 1, we manually delineated individual tree crowns in the 1m-resolution CHMs and the coincident 10 cm-resolution RGB airborne imagery and saved them as polygon features. Except for a few dozen crowns, we chose trees exclusively within previously established inventory plots and prioritized the most visible crowns.
To obtain tree height estimates, we retrieved the 95th percentile of the CHM values within each crown polygon (H_p95). The 95th percentile was preferred to the maximum height as it minimized the impact of noisy pixels and possible segmentation errors, such as including pixels from a higher neighboring crown. The slope between H_p95 and maximum height was 0.99 (robust linear regression, no intercept). The mean (resp. median) difference between maximum and 95th percentile of height was 30 cm (resp. 19 cm). Therefore, using the 95th percentile probably introduced an negative bias of 20-30 cm.
In a final step, we linked each manually delineated crown to field-measured stems by returning to the field and determining the most likely match. Stem diameters were taken from the relevant inventories or remeasured for the few trees collected outside the plots. We also used ground truthing as an opportunity to correct crown delineations through direct visual assessments conducted in the field, by revisiting and reviewing the corresponding individual trees. Each crown was given two confidence scores: one assessing the segmentation reliability and the other assessing the stem identification reliability. Those confidence scores were based on the imagery analysis and the ground truthing. Any crown flagged as unreliable in any respect was excluded from the analysis.
In total, of the manually measured 3372 trees (median stem diameter 42 cm), we kept 3304 for further analysis (Figure 2) with the median DBH remaining consistent at 42 cm, excluding 68 potential outliers through non-linear quantile regression (quantreg package in R; Koenker, 2024) assuming a 2-parameter Weibull allometry. Observations were considered outliers if they fell outside the envelope defined by the median regression line + 5 times the Inter Quartile Range for the entire population. In addition, species-specific regressions were considered for sufficiently abundant species (n > 10). For those species, observations beyond the median ± 3 times the interquartile range (IQR) threshold were excluded.
For additional validation, we chose a subset of 21 trees, with heights ranging from 25 to 45 meters (Figure S2, Supplementary Material), for which tree height estimates obtained from terrestrial laser scanning (Bossoukpe, 2020) were available and compared them to our ALS-derived estimates. We found that both methods produced consistent results (R2=0.96, residual standard error = 1.2m Figure S2, Supplementary Material), and no bias was detected.
Automatic stem-crown matching using the Canopy Constructor (dataset 2)
Individual-based models are an alternative approach to linking ALS data with field-based inventories (Taubert et al., 2015; Shugart et al., 2018). Here we used the Canopy Constructor approach (Fischer et al., 2020). The Canopy Constructor is an individual-based forest model that combines field inventories and airborne laser scanning (ALS) to reconstruct 3D canopies tree by tree. The code is available at: https://doi.org/10.5281/zenodo.17175117 (Huertas et al., 2025).
At its core, the Canopy Constructor is an algorithm that simulates virtual stands of trees that provide an optimal and spatially explicit fit of the ALS-derived CHM. In doing so, it also estimates the height and crown dimensions of each reconstructed tree. The algorithm uses inventory data and prior knowledge of stand-level allometries to create initial estimates of each tree’s height and crown diameter, with residual variation around the allometries randomly distributed in space. The initial guess is then iteratively improved by swapping allometric residuals between trees of similar size. Swaps are only accepted if they result in a simulated CHM closer to the empirical CHM. This is repeated until improvements become negligible (Fischer et al., 2020). The resulting 3D reconstructions can infer tree-level biometric properties, map fine-scale forest structures such as spatial distributions in above-ground biomass or analyze large-scale patterns such as gap size-frequency distributions (Jucker, 2022)
If little prior knowledge on local allometries is available, allometric parameters can also be inferred by running the Canopy Constructor with an Approximate Bayesian Computation procedure (Fischer et al., 2020). This requires many, computationally costly simulations, but was not necessary here: in dataset 1, we had an extensive, ground-validated set of tree dimensions that could be directly used as a strong prior for plot-level allometries of tree height and crown radius.
We added a few improvements to the Canopy Constructor code for our analysis. Briefly, improvements encompass the following changes: 1. “Mirror trees”: trees at plot edges and corners, whose crowns reach beyond the simulated area, are mirrored back into the simulated forest at another plot edge or corner with a similar canopy height structure. This removes edge effects and their substantial impact on canopy structure (Mascaro et al., 2011; Knapp et al., 2021). Given that the crowns of tropical trees can reach up to 25 m in radius, this method requires a minimum boundary layer of 25 m for each plot, so can be applied to inventory plots as small as 50 m x 50 m (0.25 ha). 2. Species-level allometries: species identity is now considered explicitly in the fitting procedure so that crown swapping concomitantly optimizes canopy fit and improves the allometric relationships for height-diameter and crown radius-diameter at the species level. This is done by fitting allometric relationships between stem diameter and crown radius/height for each species separately, updating them after every crown swap and accepting the fit only when the overall error of the species-specific models decreases compared to the previous configuration. 3. Empirical parameterization of crown shapes: crown shapes resemble empirically delineated crowns more closely and can now be parameterized simply as a distribution of height pixels within the crown polygon. Further details and more technical improvements will be provided as part of a Canopy Constructor R package that is currently under development (For further details cf. code: https://doi.org/10.5281/zenodo.17175117; Huertas et al., 2025).
To fit the Canopy Constructor at the Paracou site, we relied exclusively on CIRAD inventory plots, i.e., 72325 stem diameter measurements >= 10 cm (29444 stem diameter measurements >= 20 cm, dataset 2). Tree height was estimated using H_p95, as described above, while crown radius was derived by assigning each tree crown the radius of a disk whose area matched that of its projected convex hull. As functional forms we chose the Canopy Constructor’s default allometries: a 2-parameter Michaelis Menten function
-
\(\widehat{H}\)=a x DBH/(b+DBH)
for the height-diameter allometry and a power-law allometry for the crown radius-diameter allometries
-
\(\widehat{CR}\)=a x DBHb,
both with multiplicative error structure (Molto et al., 2014). To initialize the Canopy Constructor, both functions were first fitted to the empirical measurements in dataset 1 via the brms library/STAN (brms R package version 4.1.0; Gelman et al., 2015; Bürkner, 2017), with weakly informative priors for all random parameters (gamma distribution with parameters 1.5, 0.01). We then drew five random parameter combinations from the brms posteriors for each model and re-used them as priors for five Canopy Constructor runs, fully propagating covariation between height and crown residuals. For all subsequent analyses, we summarized the average height and average crown radius across the 5 simulations, thus obtaining a single height and crown radius estimate for each tree.
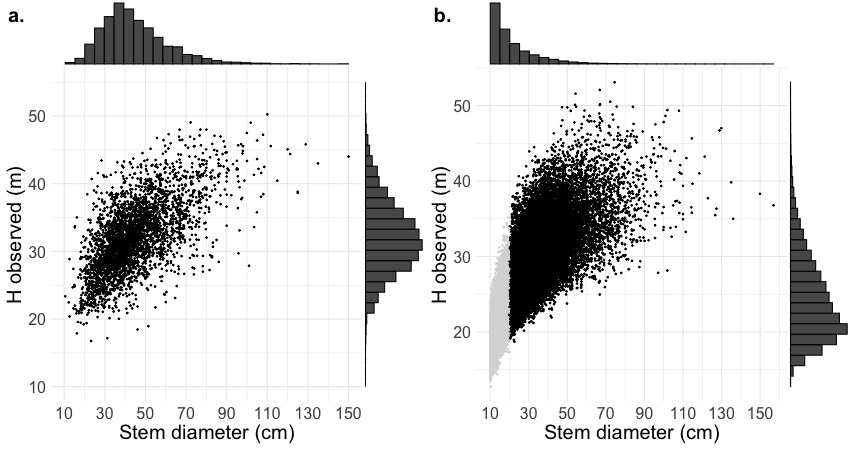
Figure 3 - Height vs. stem diameter scatterplot of dataset 1 (a) and The Canopy Constructor predictions for dataset 2 (b).Canopy Constructor predictions represent the mean height across five simulations. Observations with a stem diameter less than 20 cm (light grey) are excluded from subsequent analyses, as they are likely understory trees. Boxplots show the marginal distribution of the two variables for both populations.
Sources of variation in H-DBH allometries and its effect on biomass estimation
The effects of species identity and local canopy height on allometries
To model local H-DBH allometries, we compared the efficacy of three common equations (equations 3, 4, 5) proposed in the literature: a power law (PW) ,
-
\(\widehat{H}\)=a x DBHb,
a Michaelis-Menten type equation (MM),
-
\(\widehat{H}\)=a x DBH/(b+DBH)
and a two-parameter Weibull equation (W2; Feldpausch et al., 2011; Scaranello et al., 2012; Molto et al., 2014; Martínez Cano et al., 2019).
-
\(\widehat{H}\) = a x (1-exp(-DBH/b))
To investigate the drivers of local H-DBH allometries, we combined each of the three equations (equations 3, 4, 5) with two factors whose influence could be directly investigated through manually measured tree crowns (dataset 1, see Figure 4). These were a) species identity and b) the local canopy height in each tree’s neighborhood (LCH). The former shapes ecological strategies and trait-trait tradeoffs and should thus have large effects on tree growth, while the latter is directly linked to competition for light: trees growing among taller trees likely allocate more carbon to height growth to remain competitive (Harja et al., 2012; Laurans et al., 2014). As this comes at the expense of stem diameter growth, LCH should be linked to tree slenderness, with good evidence already available at the study site (Vincent et al., 2012). We investigated these factors with each of the three equations in a 4-step modeling procedure:
Model 1: A simple allometric equation (PW, MM or W2) across all trees without any covariates.
Model 2: Same as Model 1, but with the parameter a in each allometric equation (PW, MM or W2) multiplied by local canopy height (LCH). LCH was defined as the median canopy height in a circular buffer. In a preliminary analysis, we tested buffer sizes of 30-60 m radius and selected 30 m based on the smallest AIC value of the allometric model. The minimum buffer radius was set to twice the radius of the largest crowns in the dataset. Pixels from the target tree itself were excluded from the local canopy height calculations to avoid a circular relationship with predicted height. We used the median rather than mean height to be less sensitive to small canopy gaps (transient openings in the canopy) close to our target tree.
Model 3: Same as Model 1, but including species identity as a random effect influencing the a and b parameters of all candidate H–DBH allometric equations (PW, MM, or W2; cf. Figure 3). Singletons (species with a unique observation; ca. 6% of all dataset 1) were pooled into a singleton-species class. This pooling of the rarest species proved effective in reducing model prediction uncertainty.
Model 4: Full model, combining both LCH (Model 2) and species identity (Model 3), with the same methodological choices. All adjustments were performed using a Bayesian multilevel modeling framework based on the brms library (brms R package version 4.1.0 (Bürkner, 2017) with weakly informative priors. Models and goodness of fit statistics are provided in Table S1. The code is accessible at https://doi.org/10.5281/zenodo.17175117 (Huertas et al., 2025). The equation of the final full model is provided in Equation S8 (Supplementary Data), and the complete model and related files are available in the Zenodo repository cited above. Canopy Constructor simulations take 1-2 minutes per 10 ha on macOS and 2-3 minutes on Windows, while the five simulations of 120 ha took ~1 hour and are parallelizable, optimizing processing time. For initial model fitting, less precision is required, reducing computation time to 1-10 minutes. In contrast, the Bayesian MM-4 model has a significantly longer processing time, averaging 7 hours on Windows.
All models (1-4) were compared to the universal H-DBH relationship for pantropical forests developed by Chave et al. (2014).
-
\(\ln(H) = 0.893 \cdot E + 0.760\ln(DBH) - 0.0340\lbrack\ln(DBH)\rbrack\),
which we will refer to as Model 0.
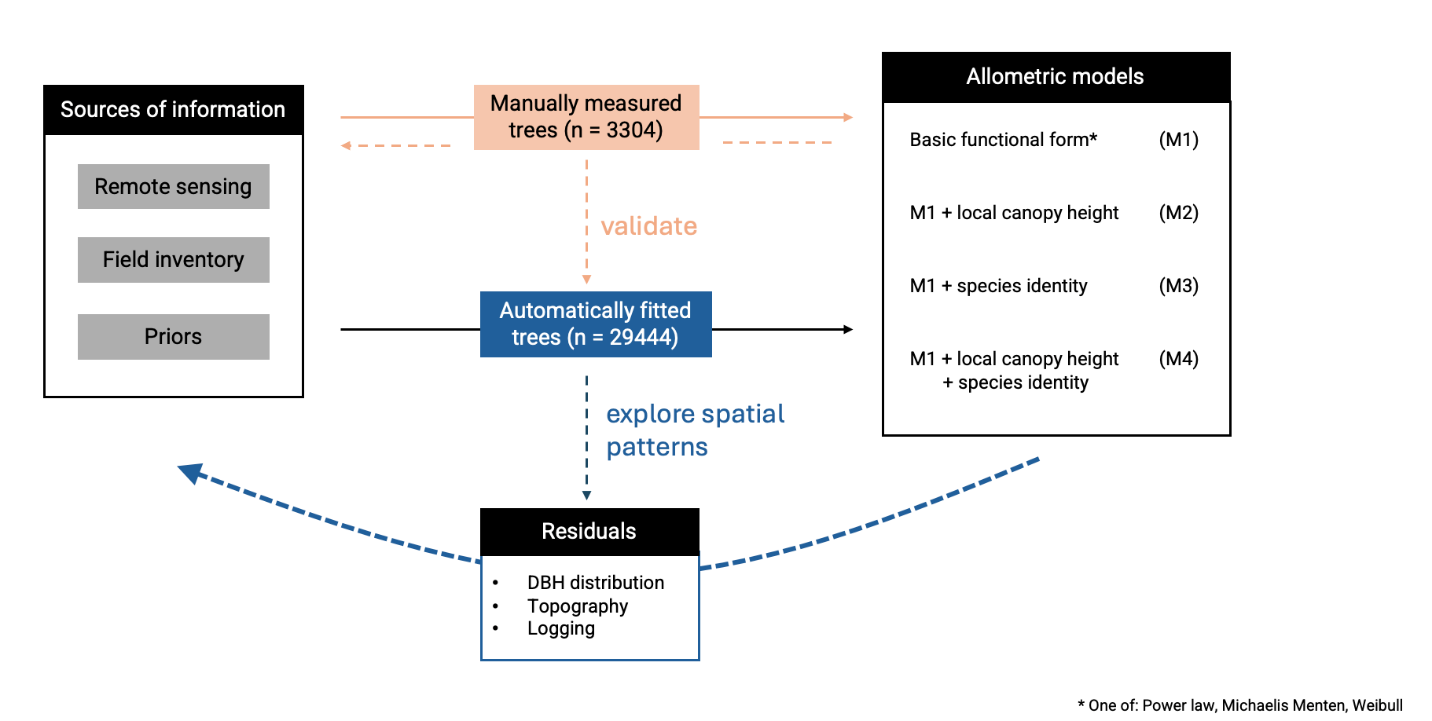
Figure 4 - Schematic diagram showing the modeling workflow for tree height estimation applied to both datasets. Each of the four models (M1 to M4) was fitted using three alternative H–DBH allometric equations (equations 3, 4, 5): power law (PW), Michaelis–Menten (MM), and two-parameter Weibull (W2). For comparison, a universal model (M0) based on Chave et al. (2014) was also tested but is not illustrated here.
Evaluating Canopy Constructor predictions against observations
Correlation of Canopy Constructor predicted heights of trees in dataset 1 for the five separate runs (different random seeds) with observed heights ranged from 0.85 to 0.86 while the correlation between the mean of five Canopy Constructor runs and observations was 0.90. Therefore, we systematically used the mean of the five Canopy Constructor runs to build our reference dataset of predicted heights.
We first compared tree heights by grouping them per plot, considering different forest types and logging treatments. For the most abundant species, we then analyzed species-specific height-diameter (H-DBH) relationships, using either field-measured heights or Canopy Constructor predictions for the same trees. To evaluate the agreement between both sources of height data, we computed the root mean square difference
-
\(RMSD = \sqrt{\frac{1}{n}\sum_{i = 1}^{n}\left( H_{CC,i} - H_{field,i} \right)^{2}}\)
and mean difference
-
\(\text{Mean~Difference} = \frac{1}{n}\sum_{i = 1}^{n}\left( H_{CC,i} - H_{field,i} \right)\)
of height data.
The influence of topography, forest type and logging history on allometries
The Canopy Constructor generated dataset provides estimates of tree dimensions for all trees in an inventory. Thereby it offers spatially dense information on tree height variation. Like most tropical stem diameter distributions (Muller‐Landau et al., 2006), forests at Paracou are characterized by an abundance of small stems (median stem diameter 17.35 cm, Figure 3b). Since most small trees are in the understory and not visible in the CHM, there is inherently high uncertainty in the height estimates inferred by the Canopy Constructor. However, the combination of CHMs and field inventories provides indirect constraints on understory tree heights through (a) direct upper limits imposed by the CHM, (b) species-specific allometric relationships inferred from conspecifics visible in canopy gaps or regenerating forests, and (c) prior information. These constraints help reject unrealistic spatial configurations, such as systematic overestimation of understory tree height—where too many small trees reach the canopy, biasing the CHM upwards or eliminating gaps—or strong deviations from typical species allometries. Despite these constraints, a wide range of understory tree heights remains plausible, leading to high residual uncertainty. Moreover, this variation is largely random and carries little environmental or ecological signal (except in areas of very low canopy), yet significantly increases model complexity and computational effort due to the sheer number of data points and species-level grouping variables. An initial test with the full dataset 2 resulted in convergence problems for the more complex models (e.g., 4-MM) even after grouping singletons to reduce the number of species considered. Therefore, we only considered trees within dataset 2 with a diameter at breast height (DBH) ≥ 20 cm for these analyses.This still provided an almost ten times larger dataset than the manually delineated dataset (29,944 vs. 3,034) and a much broader and consistent spatial coverage. To assess the robustness of our filtering choice, we also ran the same analysis by selecting only stems whose crowns were deemed visible from above (visibility >25%, n=29,965). Crown visibility was estimated as the proportion of each crown polygon overlapping with non-zero values in the 1 m² Canopy Height Model (CHM), serving as a proxy for how much of the crown was not occluded by neighboring trees. Results didnot differ in a meaningful way (not presented). Similar results were obtained due to the significant correlation between stem diameter and crown exposure (r=0.57). Notably 88% of the non-visible trees had a diameter below 20 cm (Table S6, Supplementary Material).
To explore variations in height allometries with topography/drainage regime and local forest structure we analyzed the difference between predictions of models 1-MM to 4-MM which had been fitted to Canopy Constructor predictions with the direct Canopy Constructor predictions for all trees with stem diameter > 20 cm (residuals). We calculated the mean height residual per treatment or hydromorphological units (as described in the Study site section). We also explored if the tree height residuals and basal area and Quadratic Mean Diameter (QMD) were correlated as covariation between allometries and forest structure was previously reported (Banin et al., 2012; Molto et al., 2014). Mean residual error was computed for each of the 76 1.56 ha plots for the four models MM1 to MM4. The mean residual error was then regressed against either plot basal area (BA, m2 per ha) or plot Quadratic Mean Diameter (QMD, cm). Only trees with stem diameter> 20 cm were considered when computing BA and QMD.
Propagation of biases and uncertainties from H-DBH allometries to AGB estimates.
Error propagation from different components of biomass estimation models has been widely recognized and studied (Chave et al., 2004; Molto et al., 2013; Réjou‐Méchain et al., 2017). We used the Canopy Constructor estimates (all trees >= 10 cm) as reference AGB model due to its unbiased coverage of the entire inventory and estimated AGB for all 76 1.56ha plots of main permanent sample plot network (outlined in Figure 1). We used the AGB model presented in Chave et al. (2014)
-
\(AGB = 0.0673 \times \left( WD \times H \times D^{2} \right)^{0.976}\)
using estimated tree heights from the different models with E value of -0.1074988 computed using the Biomass R package (Réjou‐Méchain et al., 2017). An exception was made for palm trees, for which we used either a Euterpe-specific allometry (Miranda et al., 2012; Réjou-Méchain et al., 2015) or the generic allometry for all other genera of Arecaceae (Sullivan et al., 2020).
All tested models, as well as derived biomass estimates, were compared via a number of standardized metrics. These included the root mean squared error (RMSE), the variance of the residuals, and the mean of residuals (bias), we calculated the bias as the mean of the residual errors.
-
\(\text{Bias} = \frac{1}{n}\sum_{i = 1}^{n}\left( H_{\text{pred},i} - H_{\text{ref},i} \right)\)
We calculated the Widely Applicable Information Criterion (WAIC) for Bayesian models based on the posterior probability with the loo library in R (Yao et al., 2018). WAIC is a fully Bayesian model comparison criterion that estimates the model’s expected out-of-sample predictive performance. It is computed from the pointwise log-likelihood across posterior draws and adjusts for model complexity via the effective number of parameters (Vehtari et al., 2015).
Results
Prediction of individual tree heights: sources of variation in H-DBH allometries
Local canopy height had a positive effect on height irrespective of allometric equation and model, i.e. higher surrounding canopy was linked to an increase in target tree height. All three functional forms (power law, Michaelis Menten, Weibull) provided similarly good fits, with differences in RMSE never exceeding 15 cm for a given model type (Figure S3, Supplementary Material). Nominally, the power-law allometric equation was the best fit for the simpler models (lowest WAIC, Table S1), but the best model using all predictors was the Michaelis Menten equation (4-MM).
Models with covariates (LCH and species identity) showed notable improvements over simpler models, with lower WAIC and RMSE values (cf. Table 1). This was the case irrespective of whether the two covariates were considered separately (models 2-3) or in a single model (model 4). The best combination (lowest WAIC) was achieved using a Michaelis-Menten equation, including both covariates (Model 4;Table 1). The impact on performance from adding or removing a predictor was generally greater than the variations observed when switching between allometric equations. (Table S1, Supplementary Material).
Table 1 - WAIC, WAIC Standard Error and RMSE for local allometric equations fitted to predict mean height (H; in m) as a function of stem diameter (in cm), using the Michaelis–Menten (MM) equation. Results for all models (M1–M4) combined with the three alternative functional forms (MM, PW, and W2) are presented in Table S1. Data input corresponds to Dataset 1 (n = 3,304).
|
Predictors |
WAIC |
WAIC (SE) |
RMSE |
|
|---|---|---|---|---|
|
model 1 - MM |
----- |
18,574.06 |
89.64 |
4.02 |
|
model 2 - MM |
Local canopy height (LCH) |
17,781.97 |
102.10 |
3.56 |
|
model 3 - MM |
Species |
17,485.29 |
94.00 |
3.26 |
|
model 4 - MM |
LCH + Species |
16,627.92 |
112.01 |
2.78 |
Validating the Canopy Constructor at tree- and species-level
To assess how well the Canopy Constructor predicts individual tree height given a known mean allometry of the stand, and to evaluate its applicability across space, we compared inferred heights (average of 5 runs) against manually measured heights of trees with stem diameter ≥ 20 cm (n = 2,567). We found a small positive bias of 0.48 m, and an overall RMSE of 2.39 m. This small positive bias likely reflects the negative bias affecting the reference data that uses 95th percentile of height instead of maximum tree height (see Material & Methods section). The Canopy Constructor thus widely outperformed a pantropical model and had the same predictive power as the best and most complex allometric model (RMSE = 2.41 m, model 4 – MM, Table 2)., While Model 4-MM had the lowest absolute bias (-0.10, Table 2 ), Canopy Constructor achieved the lowest RMSE (2.39 m) and lower standard deviation (SD = 2.34) in most forest types (Table S7).
Table 2 - Individual tree height estimation error for the different models, including the H-DBH pantropical (model 0), model 4 (reference model) and Canopy Constructor simulation. The error of the different models was computed on 2567 individual trees common to dataset 1 (used to adjust model 1-MM and model 4-MM) and dataset 2 (used for model Canopy Constructor).
|
Model |
Individual tree height |
|||
|---|---|---|---|---|
|
BIAS |
SD |
RMSE |
||
|
Model 0 |
-1.79 |
3.89 |
4.22 |
|
|
Model 1-MM |
0.12 |
3.61 |
3.61 |
|
|
Model 4-MM |
-0.10 |
2.41 |
2.41 |
|
|
Model Canopy Constructor * |
0.48 |
2.34 |
2.39 |
|
* The mean of five simulations was used
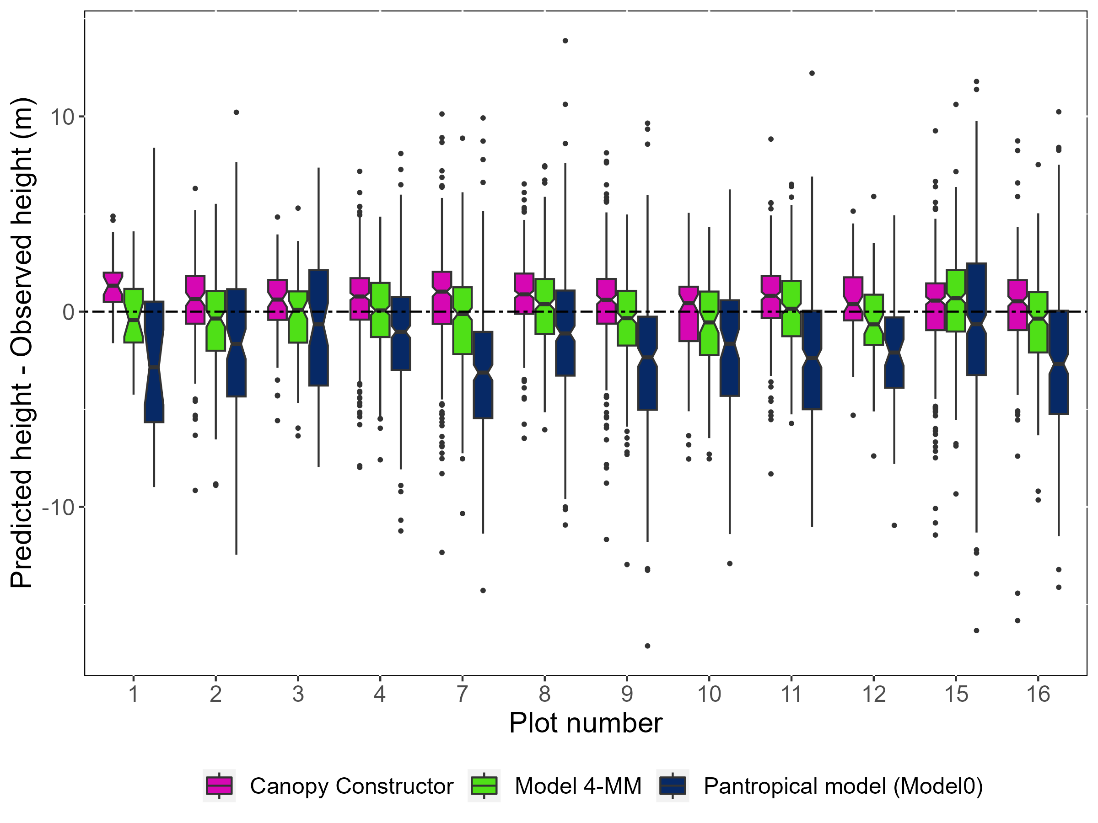
Figure 5 - Boxplot of individual tree height estimation error in meters per plot using a pantropical H-DBH equation (Model 0) (Chave et al. 2014), the reference model 4-MM and the Canopy Constructor predictions (mean of 5 runs). The dotted line represents the 0 error. Number of trees n = 2,567.
Second, we assessed the Canopy Constructor’s ability to replicate species-specific allometries between height and diameter. To model these relationships with minimal assumptions about functional forms, we applied a non-parametric loess smoother to both Canopy Constructor-derived estimates of height and stem diameter, as well as manually measured values (Figure 6) and found very strong agreement [RMSD = 2.08 and R2 = 0.85]. This established that Canopy Constructor -derived tree height estimates accurately represent heights of stems with diameter > 20 cm, making them a reliable extension of the manually derived dataset.
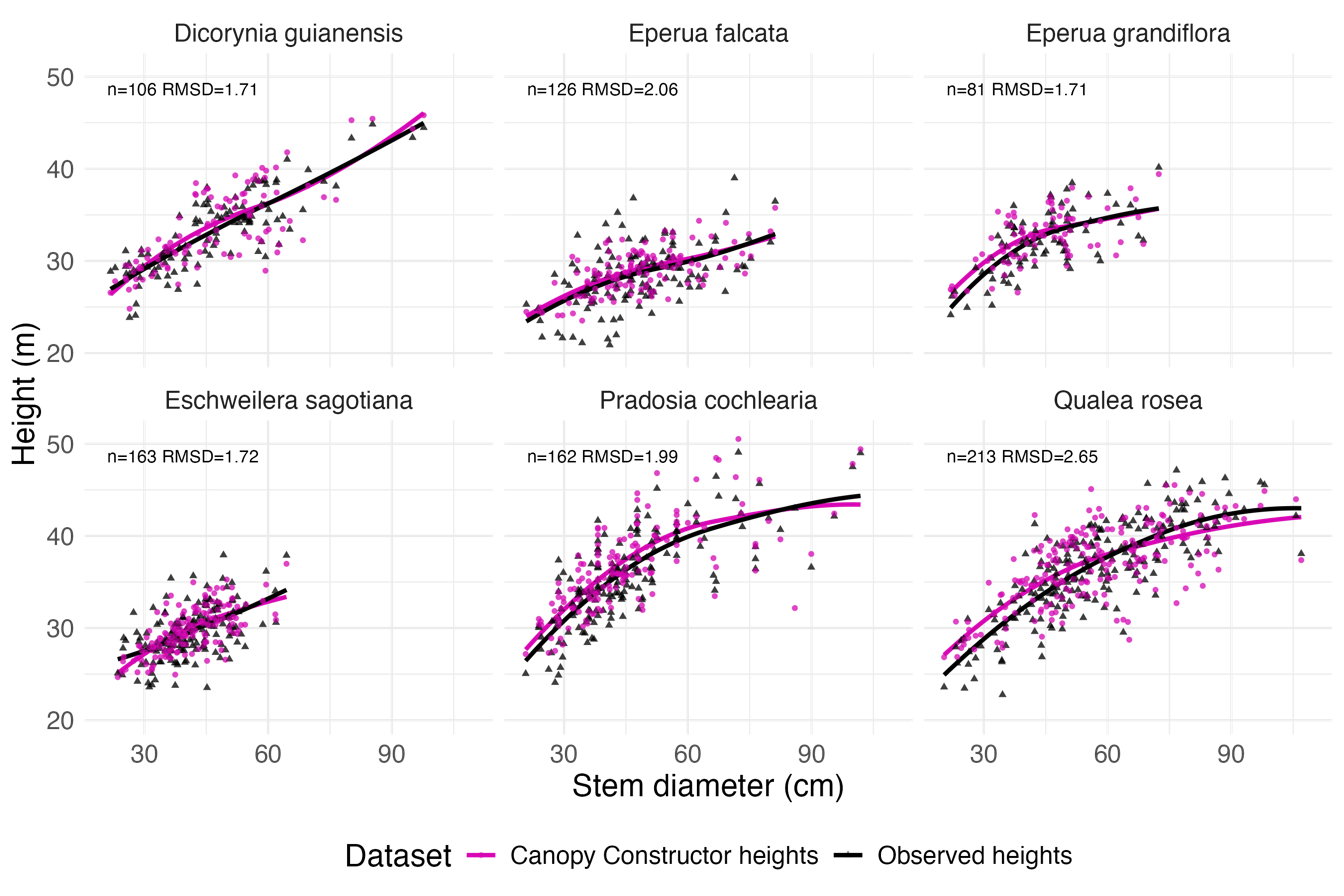
Figure 6 - Per species H-DBH relationships of trees with a stem diameter >20 cm belonging to the 6 most abundant species in dataset 1 (Observed heights, black line). The relationship is also plotted after replacing observed heights with Canopy Constructor \(\widehat{H}\), extracted from dataset 2, pink lines). Lines are based on a Generalized Additive Model (geom_smooth method=loess in ggplot2).
Figure S5 (Supplementary Material) shows scatterplots of Canopy Constructor-predicted height against stem diameter for the 60 most abundant species in dataset 2 (each with at least 100 stems), alongside height predictions from model 4-MM. Each plot includes Canopy Constructor-estimated tree heights (filled circles), model 4-MM predictions fitted to dataset 2 (filled triangles), and a GAM smoother with confidence intervals (geom_line function, ggplot2 R package).
Overall, we could estimate 109 species-specific allometries from dataset 2 (nobs> 50). Using a similar minimum number of observations, we could have only estimated 14 species-specific allometries from dataset 1.
Exploring the effects of hydromorphological units, previous logging and structural characteristics of the plot (BA, QMD) on allometry.
To analyze further factors that could shape allometry, we again fitted model 1-MM to 4-MM, but this time to the Canopy Constructor-inferred dataset 2, and then analyzed the residuals per habitat (hydromorphological units) and forest type (past disturbance and forest height) (Figure 7). A moderate bias (+0.59 m) affected tree height in bottomlands when fitting the simplest allometric model (1-MM), but this effect was much reduced after introducing species identity and LCH as covariates (Figure 7, upper row (a-d)). as reflected in the decrease in RMSE values across models. Specifically, RMSE improved from 3.33 in Model 1-MM to 3.05 in Model 2-MM (LCH), then to 2.38 in Model 3-MM (species), and finally to 2.08 in Model 4-MM (LCH + species). Similarly, the initially strong effect of forest type on tree height (from -1.19 m to + 1.14 m) was almost completely reabsorbed into local canopy height and species identity in the full model (Figure 7, lower row (e-h)). While the logging effect completely disappeared, a moderate overestimation bias (+0.39 m) persisted in Tall Undisturbed Forests (TUF) for the full model 4-MM.
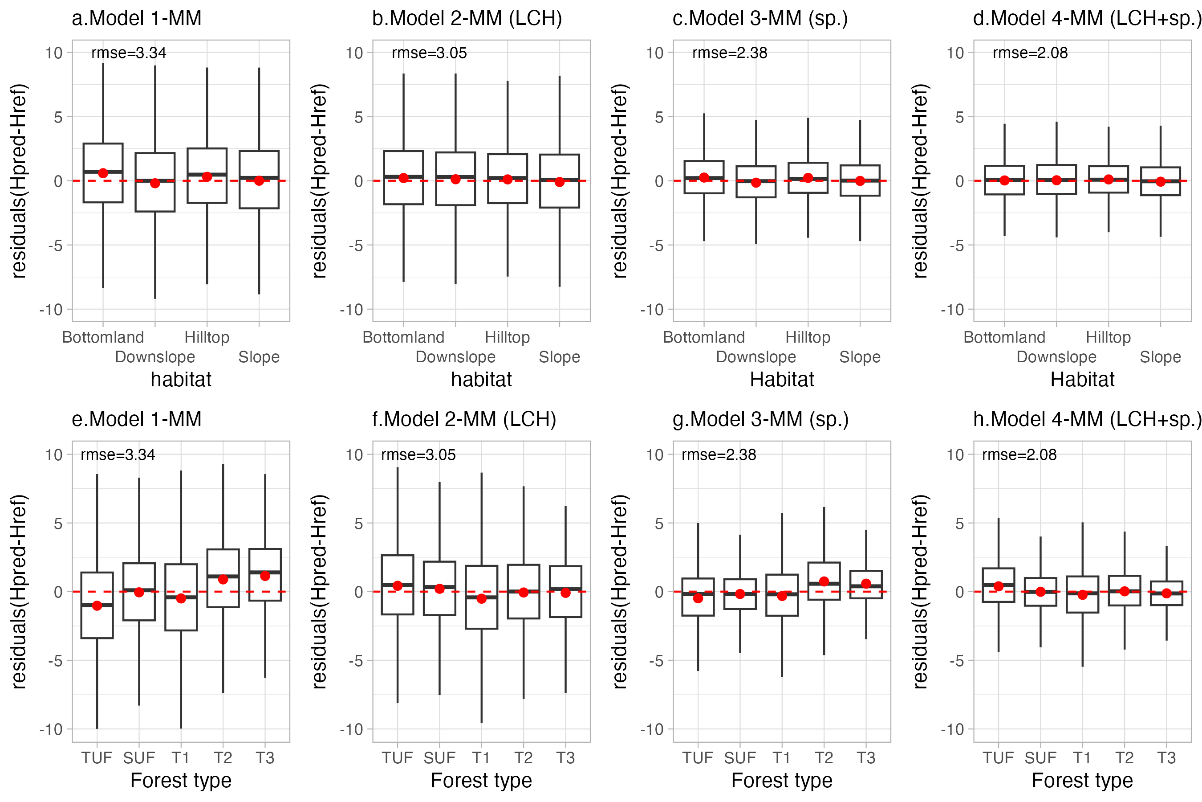
Figure 7 - Box plot of height residuals across habitat units (a-d) and forest types (e-h) for different models (1-MM to 4-MM) applied to Canopy Constructor predictions. Acronyms: LCH = Local Canopy Height; sp.=species ; TUF = Tall Undisturbed Forests; SUF = Short Undisturbed Forests; T1-T3 = Plots with treatment levels 1 to 3; Hpred = Predicted height; Href = Reference height.
Covariation of height residuals with forest structural parameters was significant in all four models, with correlations observed for BA (Models 1–4, p ≤ 0.01) and QMD (Models 1–4, p < 0.001). Models 1-MM and 3-MM, which did not include local canopy height, showed strong negative correlation between residuals and BA per plot. Conversely, models 2-MM and 4-MM which included local canopy height as covariate, showed lower (in absolute terms) positive correlation (Figure S4, Supplementary Material), and the slope of the regression line of model 4-MM was closer to 0 than any other model.
AGB error at plot level
The pantropical H-DBH model (Model 0) underestimated plot-level AGB values obtained using Canopy Constructor height predictions (Figure 8a) by 40 to 54 t/ha or 11 to 13% (Table 3). On the other hand, our reference model 4-MM (adjusted on dataset 1) produced plot level AGB, largely consistent with Canopy Constructor derived estimates, but 1 to 4% lower (Figura8c). Considering Canopy Constructor as the reference, the simpler model 1-MM (single allometry for all dicot trees) appeared to be moderately biased (Figure 8b), underestimating AGB in tall forest plots by 7%. Model 4-MM predictions were slightly lower (from approximately 1% to 4%.) than Canopy Constructor predictions (Figure 8a), as expected given the slightly lower predicted height observed on dataset 1 (Figure 5).
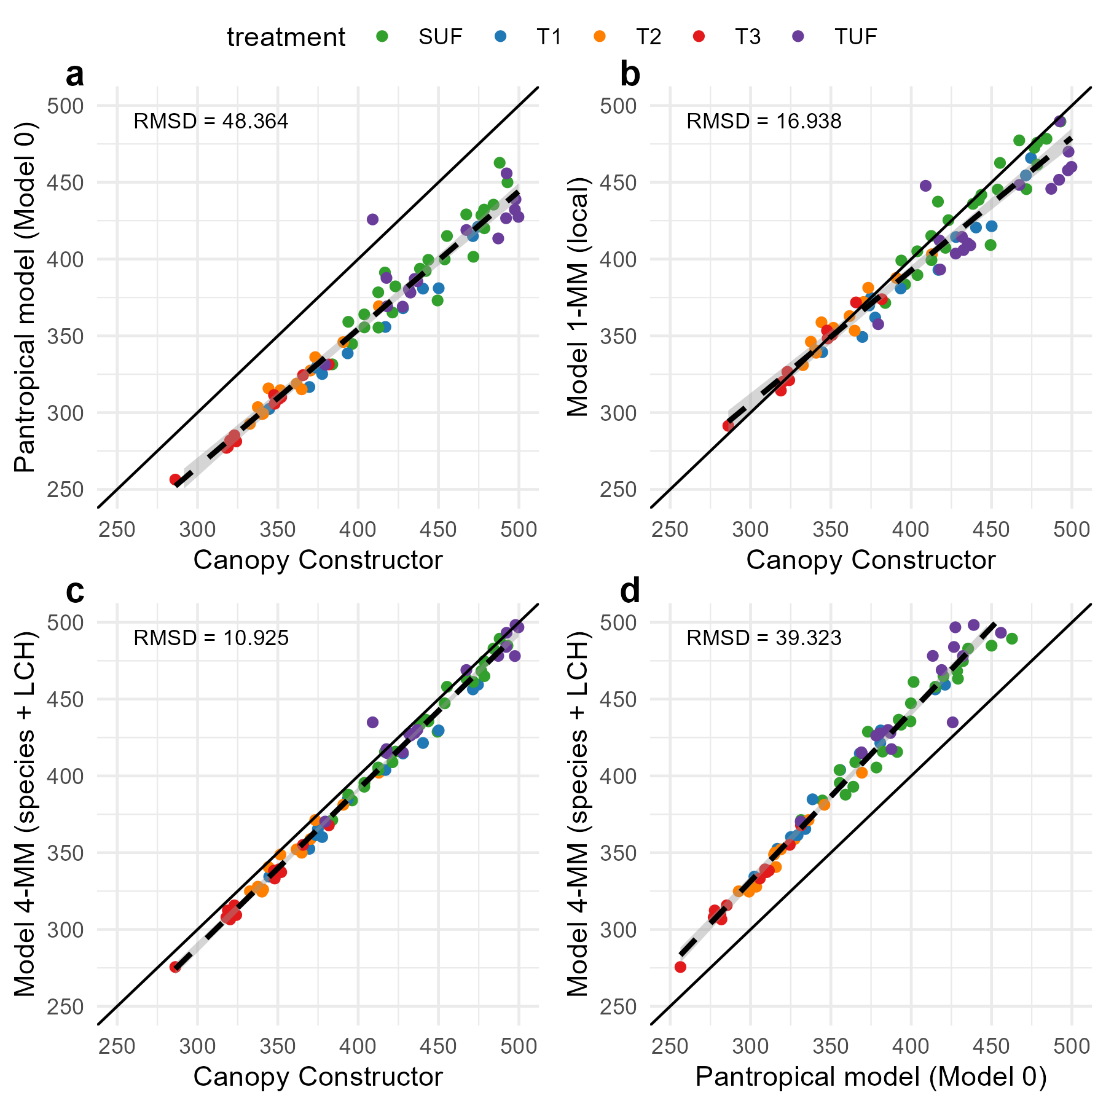
Figure 8 - This figure illustrates systematic differences between models in predicting above-ground biomass (AGB) in Mg·ha⁻¹ per 1.56 ha plot. The colors represent different treatments: Tall Undisturbed Forests (TUF), Short Undisturbed Forests (SUF), and managed forest plots with treatment levels T1 to T3, where T1 corresponds to the least intensive treatment and T3 to the most intensive one. The solid black line represents the 1:1 reference line, while the dashed black line represents the linear regression fit.
Table 3 - Above-ground biomass (AGB in Mg·ha⁻¹) per treatment category. Pantropical H-DBH model (Model 0) does not use measured tree height but relies on a pantropical allometry, model 1-MM considers a single H-DBH site allometry based on dataset1 (nobs=3304), model 4-MM adjusts allometry per species and includes a covariate for local canopy height (nobs=3304), the Canopy Constructor model adjusts individual tree height globally to best match the CHM (producing dataset 2).
|
TUF |
SUF |
T1 |
T2 |
T3 |
|
|---|---|---|---|---|---|
|
Pantropical model (Model 0) |
401 |
394 |
355 |
319 |
295 |
|
Model 1-MM (local) |
429 |
436 |
395 |
360 |
336 |
|
Model 4-MM (species + LCH) |
447 |
433 |
395 |
350 |
324 |
|
Canopy Constructor |
451 |
440 |
409 |
359 |
336 |
Discussion
We tested two complementary ALS–inventory approaches to derive tree heights, build species-specific H–DBH allometries, and evaluate their effect on plot-level aboveground biomass (AGB) relative to the pantropical model of Chave et al. (2014; Model 0). Approach 1 manually matched orthophoto-delineated crowns to field stems (dataset 1), whereas Approach 2 employed the automated Canopy Constructor to infer tree dimensions across entire plots (dataset 2). Both methods achieved low RMSEs (down to 2.4 m) and biases within the range of uncertainty due to tree top height definition (< 0.5 m), and increased biomass estimates by 29 - 46 t.ha⁻¹ (Model 4-MM adjusted on dataset 1) and 40 - 54 t.ha⁻¹ (Canopy Constructor) over Model 0. The close agreement between Canopy Constructor and manual crowns underscores its promise for rapid, high-resolution biomass mapping and satellite product validation.
Effects of Species Identity and Local Canopy Height on Allometries (H1)
Species identity emerged as the most important factor in reducing model error across all models. For instance, in a Michaelis–Menten allometric model, its inclusion reduced errors from 4.02 m to 3.26 m, regardless of the allometric function used (Table 1; Table S1, Supplementary Material). This finding aligns with results from other tropical sites (Martínez Cano et al., 2019) and reflects strong cross-species variability in H–DBH allometry (Figure 6; Figure S5), also influencing structural differences between forest types and habitats (Figure 7). At the plot scale, excluding species identity increased estimation errors, as shown in RMSD comparisons between Model 1-MM and Canopy Constructor versus Model 4-MM and Canopy Constructor (Figure 8).
Although asymptotic forms such as Michaelis–Menten and Weibull typically outperform power laws in tropical forests (Molto et al., 2014; Sullivan et al., 2018; Martínez Cano et al., 2019), we observed only minor error differences between functional forms (Table S1), likely due to the dominance of large canopy trees in our dataset. Power laws may still serve as useful approximations in large-scale studies (Feldpausch et al., 2011; Jucker et al., 2022). Recent work suggests that hierarchical modeling based on functional groups may help further reduce biomass model biases, especially in younger secondary forests (Liu et al., 2023).
A major limitation for including species identity in allometries is the scarcity of species-level crown measurements. While global databases like TALLO (Jucker et al., 2022) provide valuable data, coverage is limited in hyperdiverse forests and subject to methodological variation.
A promising solution involved modifying the Canopy Constructor to constrain species-specific relationships during reconstruction. This allowed inferring 109 species-level allometries, compared to only 14 with manually verified heights (dataset 1). Predicted species-specific heights showed RMSE/ME between 1.71/0.36 m and 2.65/0.41 m (Figure 6). This demonstrates the potential for using ALS and inventory data—if co-registered in time—to yield spatially explicit and taxonomically resolved allometries. To minimize bias due to growth or mortality, ALS and inventory data should ideally be collected within a narrow time window.
Local Canopy Height and Forest Structure as Modulators of Allometric Variation (H1, H3)
To assess whether topography, logging history, or forest structure influence allometric variation (H3), we used dataset 2 to evaluate how local forest conditions affect H–DBH relationships. Local canopy height (LCH) emerged as the second most influential variable after species identity. Including LCH reduced RMSEs by \~50 cm, either alone or combined with species identity (Table 1). LCH likely reflects ecological signals from shared neighborhood conditions—such as similar resource availability or disturbance regimes—and growth plasticity. Trees may grow taller when surrounded by tall neighbors to maintain access to light , but remain shorter in lower-stature surroundings to avoid wind damage.
Notably, LCH remained a strong predictor even after adjusting for species, and performed better than topography or disturbance history in explaining allometric variation. Our results align with earlier work showing correlations between LCH and tree slenderness (Vincent et al., 2012; Rutishauser et al., 2016). In our data, excluding LCH led to overestimated heights in the most intensively logged plots, an error corrected by including LCH (Figure 7).
We found no consistent topographic pattern in H-DBH at large scale, though bottomland trees appeared more stunted. The general pattern between H-DBH and topographic class, noted by Ferry et al. (2010) in more limited areas, was not significant at broader scale.
LCH also mediated structural effects—like basal area (BA) and quadratic mean diameter (QMD) on allometries. Model 4-MM largely absorbed structural variation, while Model 2-MM (with LCH alone) also mitigated these effects (Figure S4). Previous findings (Vincent et al., 2010) support that LCH covaries with forest structure, but a full conceptual model linking forest structure, canopy height, and allometry is still lacking. In other forest types, such as plantations and temperate systems, structural variables like stem density or stocking have also been found to influence H–DBH relationships (Vanclay & Henry, 1988; Wang et al., 1998; Zeide & Vanderschaaf, 2002). 3D simulation tools (Vincent & Harja, 2007; Maréchaux & Chave, 2017) may help clarify these mechanisms and test hypotheses on growth plasticity and mechanical constraints.
Evaluating the Canopy Constructor for Allometric Inference (H2)
The Canopy Constructor provided predictive accuracies comparable to nested Bayesian models with manual crown delineation (dataset 1), despite relying on priors without explicit modeling of species or LCH. Using stronger priors based on field observations, we accurately recovered species-specific H–DBH variation in six well-sampled taxa (>50 trees). This enabled extrapolation to 109 species using Canopy Constructor (dataset 2), far exceeding field-only estimates.
However, uncertainty remains high for small or subcanopy trees, due to limited ALS penetration. While visible crown fitting and species constraints limit error propagation, validation via targeted field or TLS measurements remains essential. TLS, despite processing challenges like segmentation and cloud alignment, is especially valuable for smaller trees (Dassot et al., 2011; Seidel et al., 2021; Terryn et al., 2024), whereas ALS scales more efficiently over large areas.
The Canopy Constructor’s use of idealized crown shapes and CHMs introduces error for smaller trees. While unrealistic allometries are filtered out during simulation, indirect inference leads to residual uncertainty, especially in tall, closed-canopy forests where limited gap availability constrains signal. Improvements such as higher-resolution ALS or fitting to vegetation density profiles (Vincent et al., 2017), and sequential model fitting, may help reduce these uncertainties.
Geolocation mismatch is another key limitation (Lamprecht et al., 2017; Fadili et al., 2019). Errors in co-registration between field and ALS data impact convergence. Future versions of Canopy Constructor could use Approximate Bayesian Computation (Fischer et al., 2020) to incorporate spatial uncertainty by testing small coordinate shifts (\~5–10 m) to optimize fit.
In our tests, Canopy Constructor achieved marginally lower RMSE than the best allometric models (Table 2), though with a small positive bias (0.5 m), possibly due to negative bias in reference heights. It underestimated large trees and overestimated small ones (Figure S3), yet preserved consistent mean trends in H–DBH (Figure S5).
Notably, these results highlight that the Canopy Constructor performs well even in the absence of prescribed H–DBH functional forms. By using non-parametric smoothing approaches such as loess, we captured species-specific allometric trends with high accuracy (Figure 6), suggesting that the method retains predictive power without relying on predefined allometric equations. This flexibility strengthens its value as a tool for exploratory allometric analysis and supports its use under varying data constraints.
Implications for AGB Estimation and Forest Monitoring (H4)
To reduce bias in biomass estimation, locally calibrated H–DBH models are essential (Duncanson et al., 2021), but often unavailable. Traditional height measurements are imprecise (Burt et al., 2020), and TLS, though accurate (Terryn et al., 2024), is demanding. Allometries fitted without species identity yield high uncertainty, due to strong taxonomic variation.
One earlier studies (Fayolle et al., 2013) found little support for species-specific allometries, likely due to low replication across diverse taxa. More recent studies, however, have highlighted the benefits of using species-specific empirical models or machine learning for AGB prediction in tropical forests (Dutta Roy & Debbarma, 2024). While these methods differ from lidar-based approaches, they reflect a broader consensus on the importance of tailoring allometric models to species- and site-specific conditions.
Our results suggest that ALS-inventory integration greatly improves height and biomass estimates, reducing AGB bias by >10% across forest types compared to pantropical allometries (e.g., Chave et al., 2014; Duncanson et al., 2020).
The approach tested here is readily transferable to other sites and may substantially improve the reference data used in global forest monitoring programs and satellite product validation. Simulation models such as Canopy Constructor are particularly promising in this context, as they can incorporate uncertainty into prior distributions and propagate it through allometric inference—an advantage over conventional techniques. Furthermore, even weakly informative priors from global allometric databases can be useful for model initialization when local data are lacking.
Conclusions
The combination of ALS and inventory data effectively reduced the uncertainty in predicting height (H-DBH) and, consequently AGB in a dense tropical forest. Automatic stem-crown matching produced results that compared well to field-based matching. Predictions of individual tree heights were similar and plot-level AGB estimates were consistent. In both cases (Canopy Constructor and Model 4-MM), AGB predictions were higher than those obtained by the reference pantropical allometry, the difference ranging from 29 to 54 Mg.ha-1 depending on forest type and model (Table 3). The root mean squared error on height was reduced almost by half when replacing the pantropical allometry with the optimal local model. The optimal model included local canopy height in individual tree neighborhoods and species identity as covariates in height prediction. Automatic stem-crown matching produced by the Canopy Constructor allowed to increase the sample size per species massively. The sampling bias toward larger trees is the most important limitation to the wide development of species-specific allometries from the combination of ALS data and field inventory. To mitigate this bias, including smaller stems in the calibration dataset is recommended, using other technologies such as TLS, which may be the best currently available alternative. TLS provides precise measurements of understory trees and serves as a complementary tool to ALS, enhancing the accuracy of allometric models while maintaining the scalability of ALS for larger-scale applications.
Author Statement
Claudia Huertas: Conceptualization, Investigation, Formal analysis, Writing - Original Draft.
Fabian Jörg Fischer: Conceptualization, Methodology, Formal analysis, Writing - Review & Editing.
Mélaine Aubry-Kientz: Methodology, Conceptualization, Writing - Review & Editing.
James Ball: Resources, Validation.
Geraldine Derroire: Data, Reviewing and Editing
James Ball: Data, Reviewing and Editing
Grégoire Vincent: Conceptualization, Investigation, Data, Writing - Original Draft, Supervision.
Acknowledgments
Thanks to Jérôme Chave, Adeline Fayolle and David Coomes for their critical comments on an earlier draft of the manuscript. A preprint version 2 of this article has been peer-reviewed and recommended by Peer Community in Ecology (https://doi.org/10.24072/pci.ecology.100743; Munoz, 2025).
Funding
We gratefully acknowledge funding by “Investissement d’Avenir” programs managed by Agence Nationale de la Recherche [CEBA, ref. ANR‐10‐LABX‐25‐01]. Claudia Huertas was supported by a “Make Our Planet Great Again – MOPGA” program doctoral grant co-funded by IRD (the French Research Institute for Sustainable Development).
Conflict of interest disclosure
The authors declare they have no conflict of interest relating to the content of this article.
Data, scripts, code, and supplementary information availability
The datasets (data.zip), the models used, the analysis code (scripts.zip), and the supplementary materials (Supplementary_information.pdf) are all available online (https://doi.org/10.5281/zenodo.17175117; Huertas et al., 2025).