
 CC-BY 4.0
Introduction
The late Neolithic landscape of the area of Đakovština in Eastern Slavonija has in recent years been intensively studied through various research projects. A vast network of settlements situated 3-5 kilometers apart was uncovered thanks to aerial archaeology (Kalafatić et al., 2020; Šošić Klindžić et al., 2019). The most striking common characteristic that all of these site’s share is the presence of at least one, but usually double or multiple circular ditches that encompasses part of the settlement and are 80-180 m in diameter (Šošić Klindžić et al., 2019). The sites were further confirmed and chronologically determined by magnetometry, excavations and field surveys. These sites are attributed to the Sopot culture, a part of wider late Neolithic group in the Balkans, present in eastern Croatia with most C14 dates placing it between 5200 and 4400 cal BC. By using an integrative approach, new patterns were identified while previous research as well as observed phenomena at selected sites was re-evaluated. The attribution to the late Neolithic period was confirmed by archaeological excavations on the sites of Gorjani Kremenjača, Gorjani Topole, Preslatinci – Ugljara and the site, which is the subject of this paper, Tomašanci Dubrava. On other sites, the presence of late Neolithic artifacts was confirmed by field surveys (Šošić Klindžić et al., 2019). Due to the large number of potential settlements some of the sites were studied in more detail than the others, and the geophysical surveys with a magnetometer proved crucial in providing an additional layer of detail to the archaeological interpretation of the individual “sites”. Suddenly the overlaying datasets revealed not only vast settlement areas but also individual features within the data which could potentially be attributed to ditches, houses, pits and multiple other undefined features. The data presented in this paper concerns one of the sites from this vast late Neolithic settlement network, the site of Tomašanci – Dubrava.
Methods
Aerial reconnaissance
The site Tomašanci Dubrava was first observed as a part of an aerial survey project of Eastern Slavonia conducted in 2015 using an aeroplane and a UAV (Unmanned aerial vehicle) (Šiljeg & Kalafatić, 2016). After the initial observation (Figure 1), the analysis of the available satellite images from Google Earth and orthophotos from the Croatian State Geodetic Administration showed that the Enclosure 1 is visible on almost all available images and is even recorded as a slight elevation on the Croatian topographic map 1:5000. Additional analysis of images confirmed the presence of two additional enclosures. The typical late Neolithic pottery and lithic artifacts collected during the archaeological field survey confirmed the attribution of the site to the late Neolithic period (Šošić Klindžić et al., 2019).
Magnetic survey
The aim of the magnetic survey was to confirm the presence of the enclosures as well as to collect data on the internal structure and organization of this late Neolithic site. The company Cmp prospection from Berlin in cooperation with Archeologická Agentúra s.r.o., Bratislava conducted the magnetic prospection of the site in February 2021 and May 2022. The first survey in Tomašanci included an area of 10.8 ha using the 10-probe fluxgate gradiometer array LEA MAX combined with a GNSS-RTK positioning system and moved by an ATV. The Förster FEREX CON650 fluxgate gradiometer probes register the vertical gradient of the vertical component of the Earth’s magnetic field with an accuracy of 0.1 nT (Nanotesla) (Meyer, 2021; Šošić Klindžić et al., 2021). The survey in 2022 continued with a 7-probe fluxgate gradiometer mounted on a cart and moved by the operator. The magnetic surveys successfully confirmed the presence of the two enclosures (TD1 & TD3) and multiple other features, such as pits, postholes, houses and even a large ellipsoidal ditch stretching across one of the enclosures (Figure 2). Further work should include a GPR survey, as work on similar structures in lower Austria has shown promising results (Wallner et al., 2022).
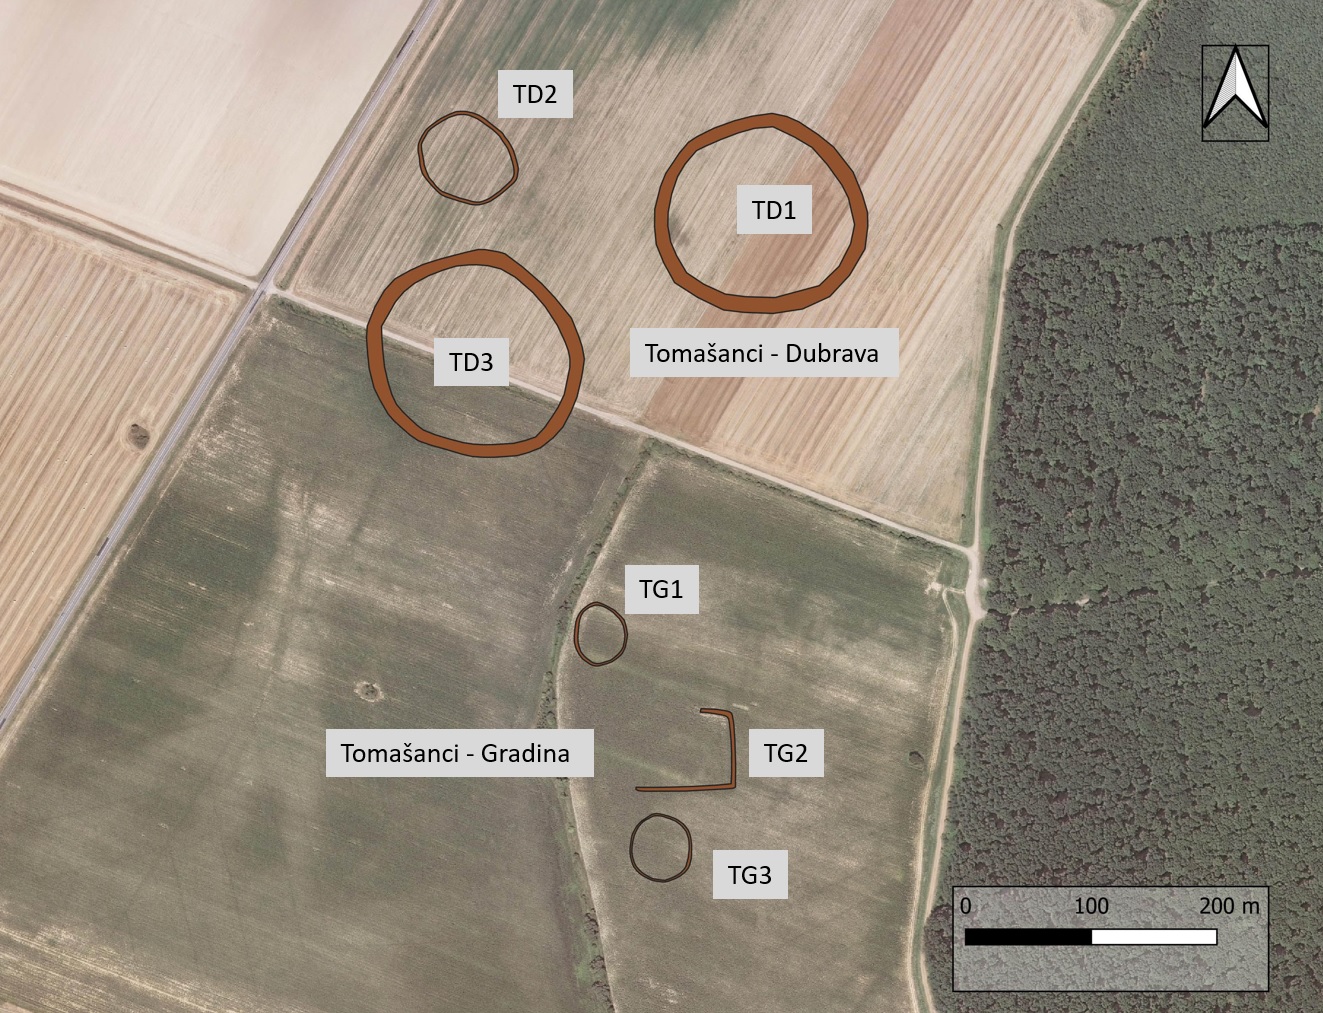
Figure 1 - Archaeological features visible as cropmarks and soilmarks in the area of Tomašanci – Dubrava and Tomašanci – Gradina; Interpretation: Šiljeg & Kalafatić, 2016; Šošić Klindžić et al., 2019)
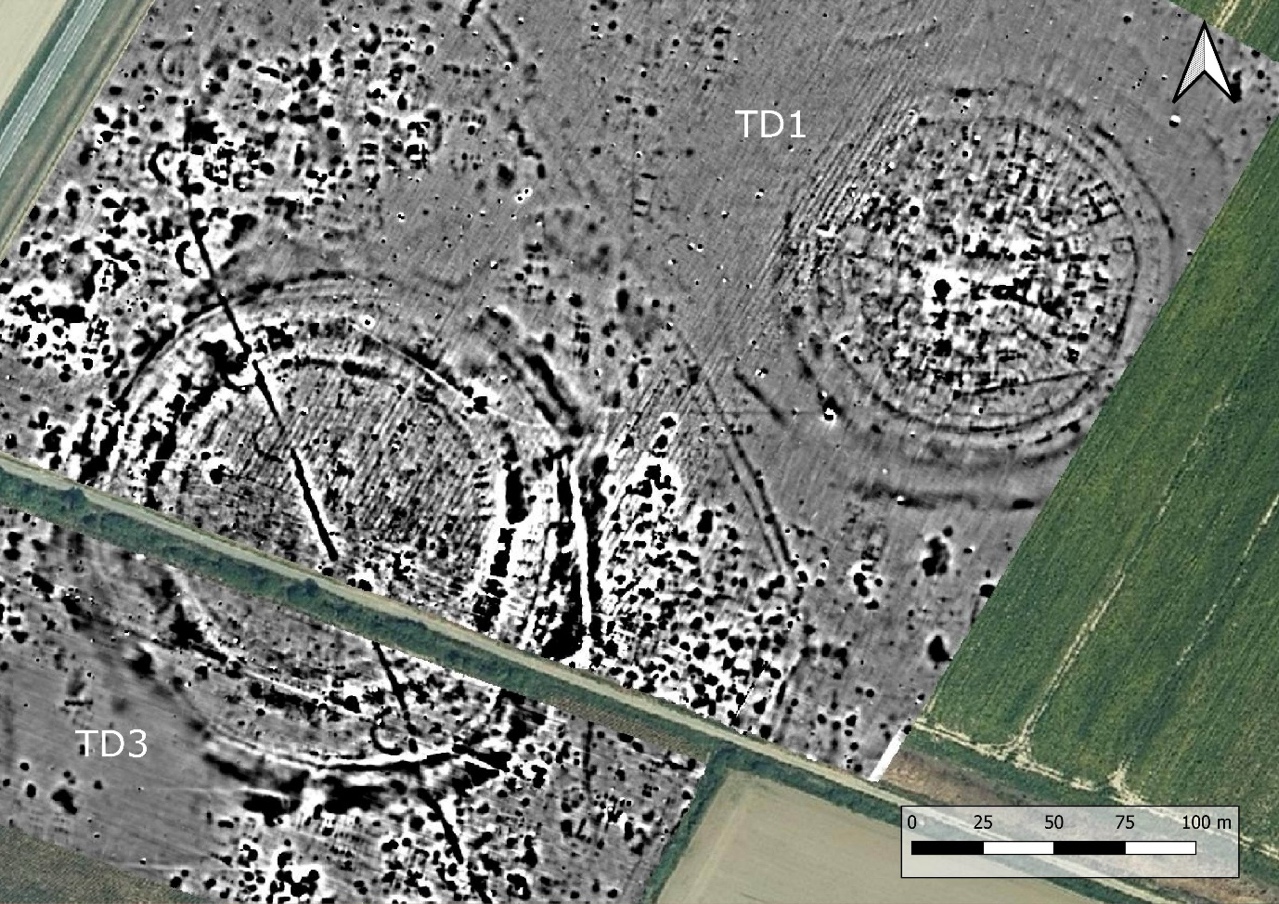
Figure 2 - Interpretation of the magnetometer survey on the site of Tomašanci Dubrava
Archaeological excavation
The large ellipsoidal ditch raised suspicions about its attribution to the late Neolithic period because it was cutting through one of the enclosures, and its shape resembled features common in later periods and usually attributed to Roman times. To provide precise chronological attribution, a small-scale test excavation was conducted in May 2022 on a segment of the ellipsoidal ditch. The V-shaped ditch feature was confirmed through excavations, and the material recovered from the ground was exclusively from the late Neolithic period. Although the larger ditch feature appears to be superimposed over the circular enclosures (Figure 2), the nature of the magnetometer surveys makes it hard to differentiate features stratigraphically (Fassbinder, 2016), and this fact should be considered in future research.
UAV Ortophoto
During recent field work conducted in the first half of 2022 on the site Tomašanci- Dubrava we aimed to get a more detailed aerial view of the area and the archaeological features identified by previous aerial archaeology interpretations. A drone was engaged to acquire a set of vertical photographs over a large area where two distinct Neolithic enclosures were visible. The goal was to capture a detailed orthophoto of the feature in a maturing crop, since the area was targeted for further geomagnetic surveys later in the season.
Results
DSM 2022
A DJI Mavic 2 Pro was used to acquire 595 vertical photographs (5472x3648 pix) from a flight altitude of 260m, the overlap between images was 90% and the final 3D model was georeferenced using a GNSS device on the ground. The images were processed in Agisoft Metashape Professional using the Reference preselection mode in the Alignment phase, and the generated DSM (digital surface model) has a resolution of 14.8 cm/pix. The captured data revealed the targeted feature as a cropmark in a field of maturing industrial peas, but the model’s surface revealed small differences in the height of the growing crops. The different levels of plant growth correspond to subsurface archaeological features, which in turn perfectly correspond to the archaeological features recognized previously on different aerial photographs (as shown in Figure 3). The data was acquired in May 2022 (Supplement 1 – Agisoft Report_DSM_22.pdf).
DTM 2023
A second drone survey and a DTM (digital terrain model) generation was conducted in early March 2023. The crops were at this point removed from the fields. The goal was to get a good orthophoto of the soil mark for the enclosures. Because of the potential photo orientation problems due to the fact that in some cases images with no distinct features can yield poor results, we decided to sacrifice some of the resolution for a good result. The soil marks visible on the orthophoto are one of the best representations of the enclosures at Tomašanci – Dubrava on aerial images. We used a DJI Mavic 2 Pro to acquire 354 photographs from a flight altitude of 340m, the overlap between images was 90% and the final 3D model was georeferenced using a GNSS device on the ground. The resulting DTM has a resolution of 18.5 cm/pix. The DTM of the fields without crops also revealed the distinct ditches surrounding the features TD1 and TD3, with the same slight elevations visible in the middle of the enclosures as was the case with the earlier DSM recorded when crops were present in the field (as shown in Figure 4) (Supplement 2 – Agisoft Report_DTM_23.pdf).
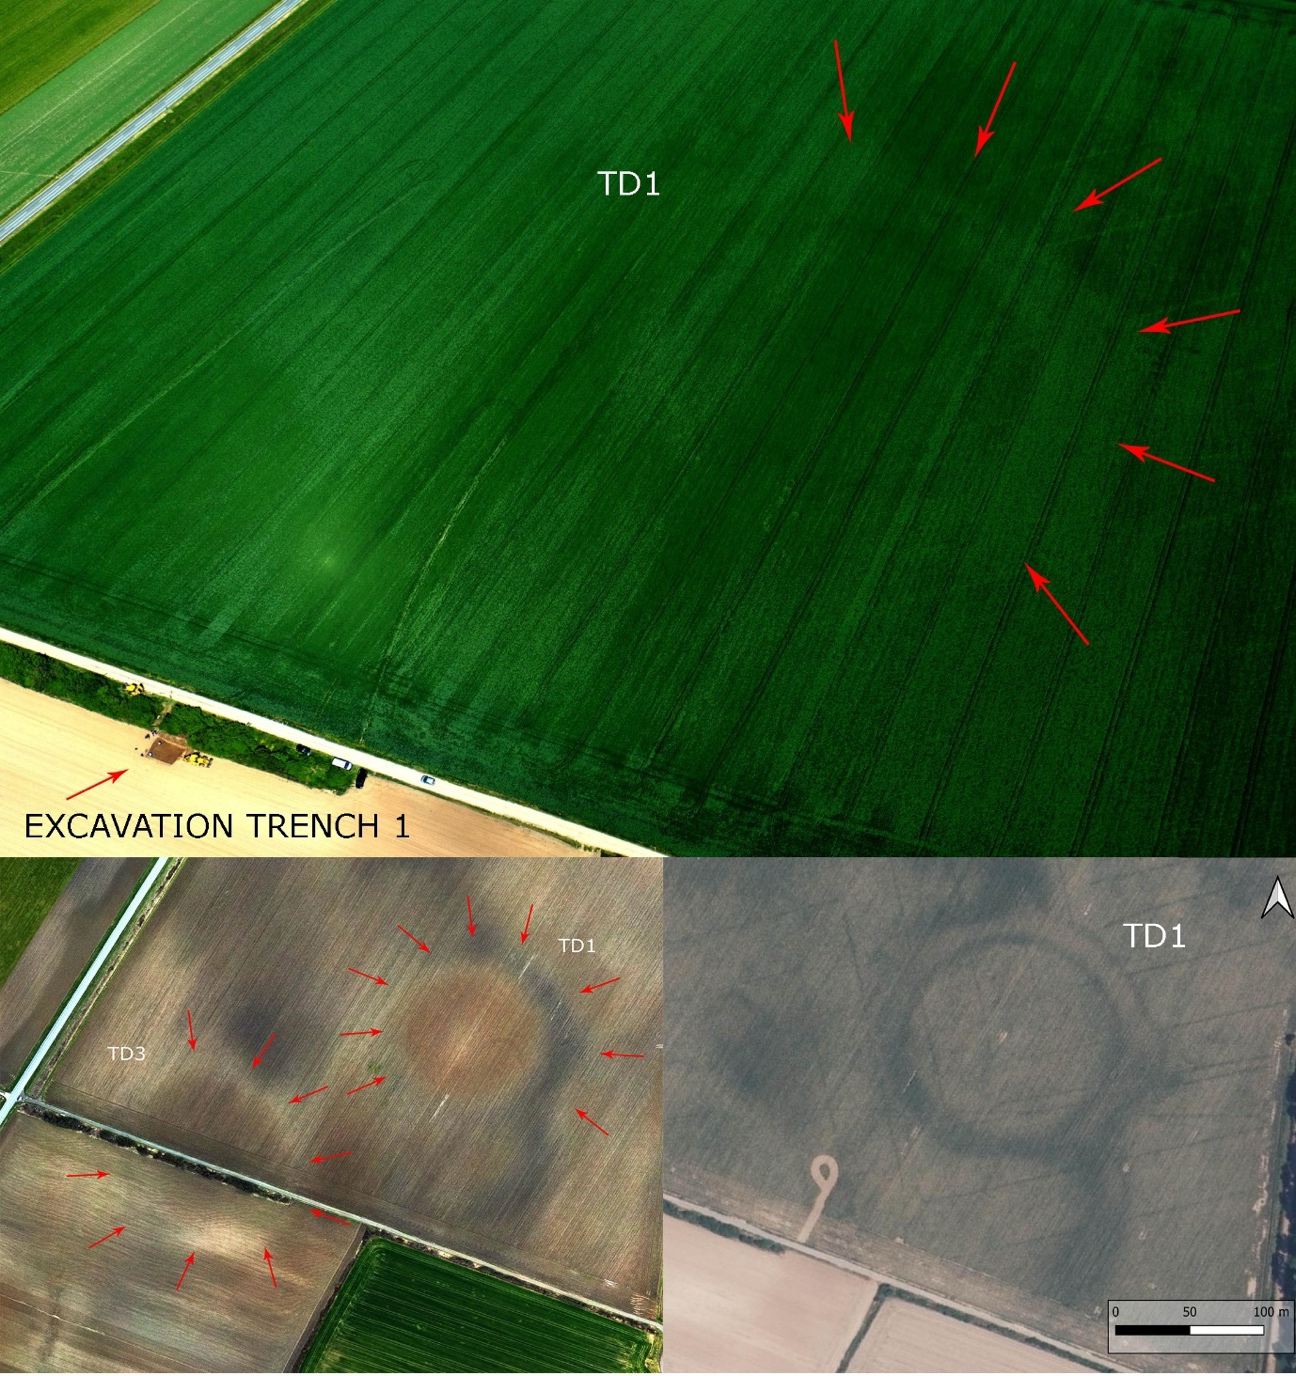
Figure 3 - Above: oblique aerial photo of the TD1 enclosure as a soilmark taken during the 2022 survey; below left: orthophoto of TD1 and TD3 soilmarks during the 2023 survey; below right: enclosure TD1 on a state geodesic archival photograph, taken in 2021.
Comparison DSM vs DTM
The data from both surveys was used to generate DEMs (digital elevation models), which were in turn exported from the Metashape software and subsequently imported to QGIS. This allowed us to superimpose both terrain models and extract an elevation profile in the same spot for both datasets, using the terrain profile tool. The comparison yielded interesting results, the cross-section of the DTM shows a clearly visible ditch (marked by A & C in Figure. 5). The ditch is less visible in the DSM cross-section, but it is still present. For the purpose of comparison, the height difference between the lowest points in the ditches (marked by A & C in Figure 5) and the highest point (marked by B in Figure. 5) at the centre of the settlement was calculated for both the DTM and DSM dataset. The height difference between these extreme points amounts to 0.902m for the DSM (between the lowest point in ditch A and highest point B), and 0.809m for the DTM (between the lowest point in ditch A and highest point B). The resulting difference of almost 10cm clearly shows that the relief (ditches) play a significant role in the final height of the crops.
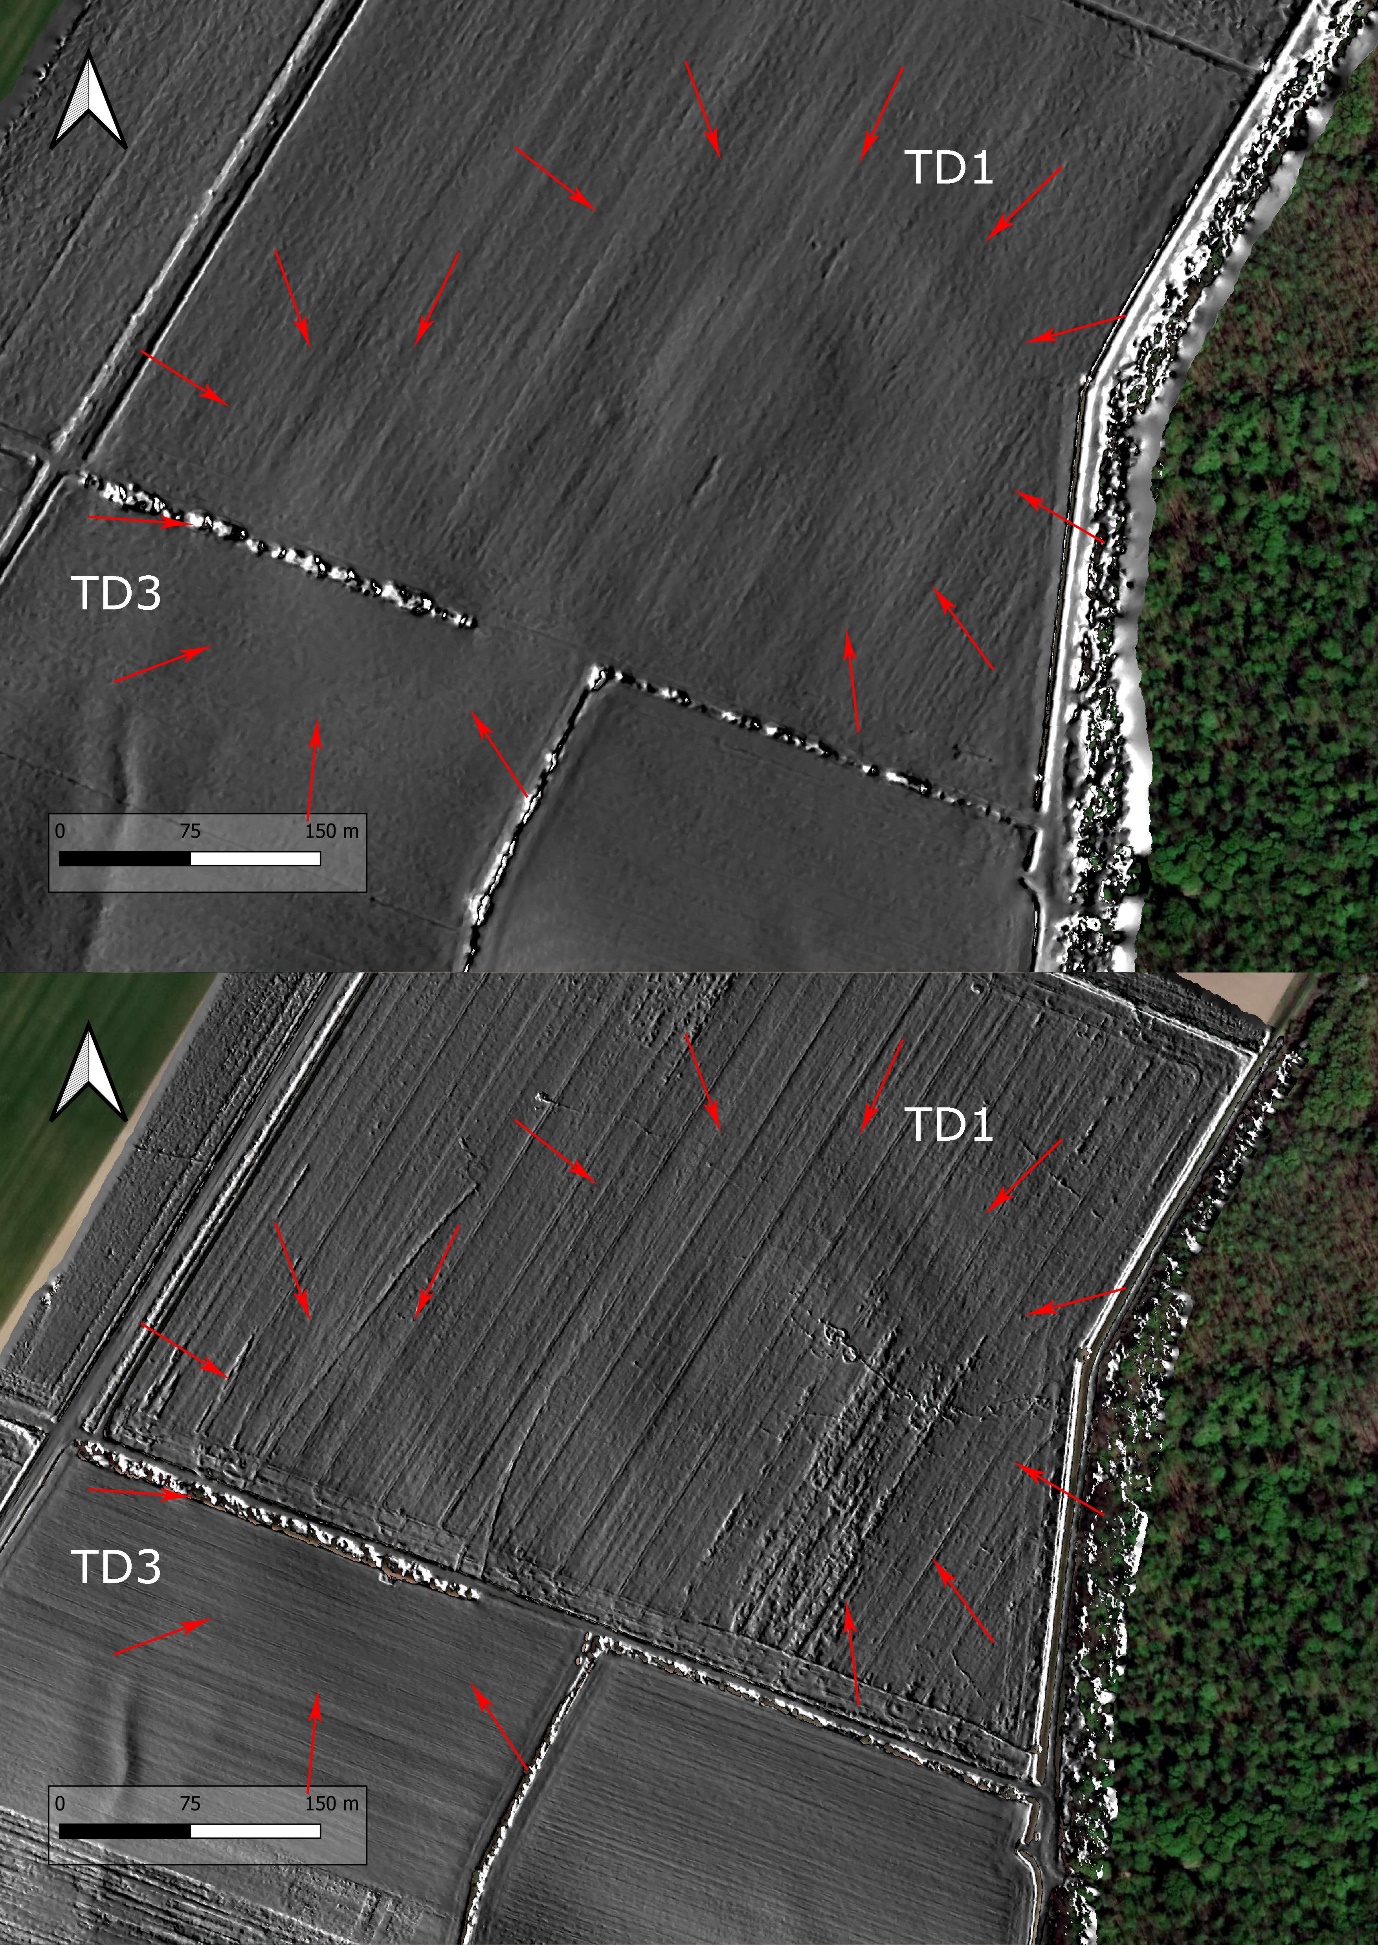
Figure 4 - Above: DTM 2023, enclosures TD1 and TD3 visible as slight elevations and ditches as depressions in the soil on the digital terrain model; below: DSM 2022, enclosures TD1 and TD3 visible as slight elevations and ditches as depressions in the crops on the digital surface model
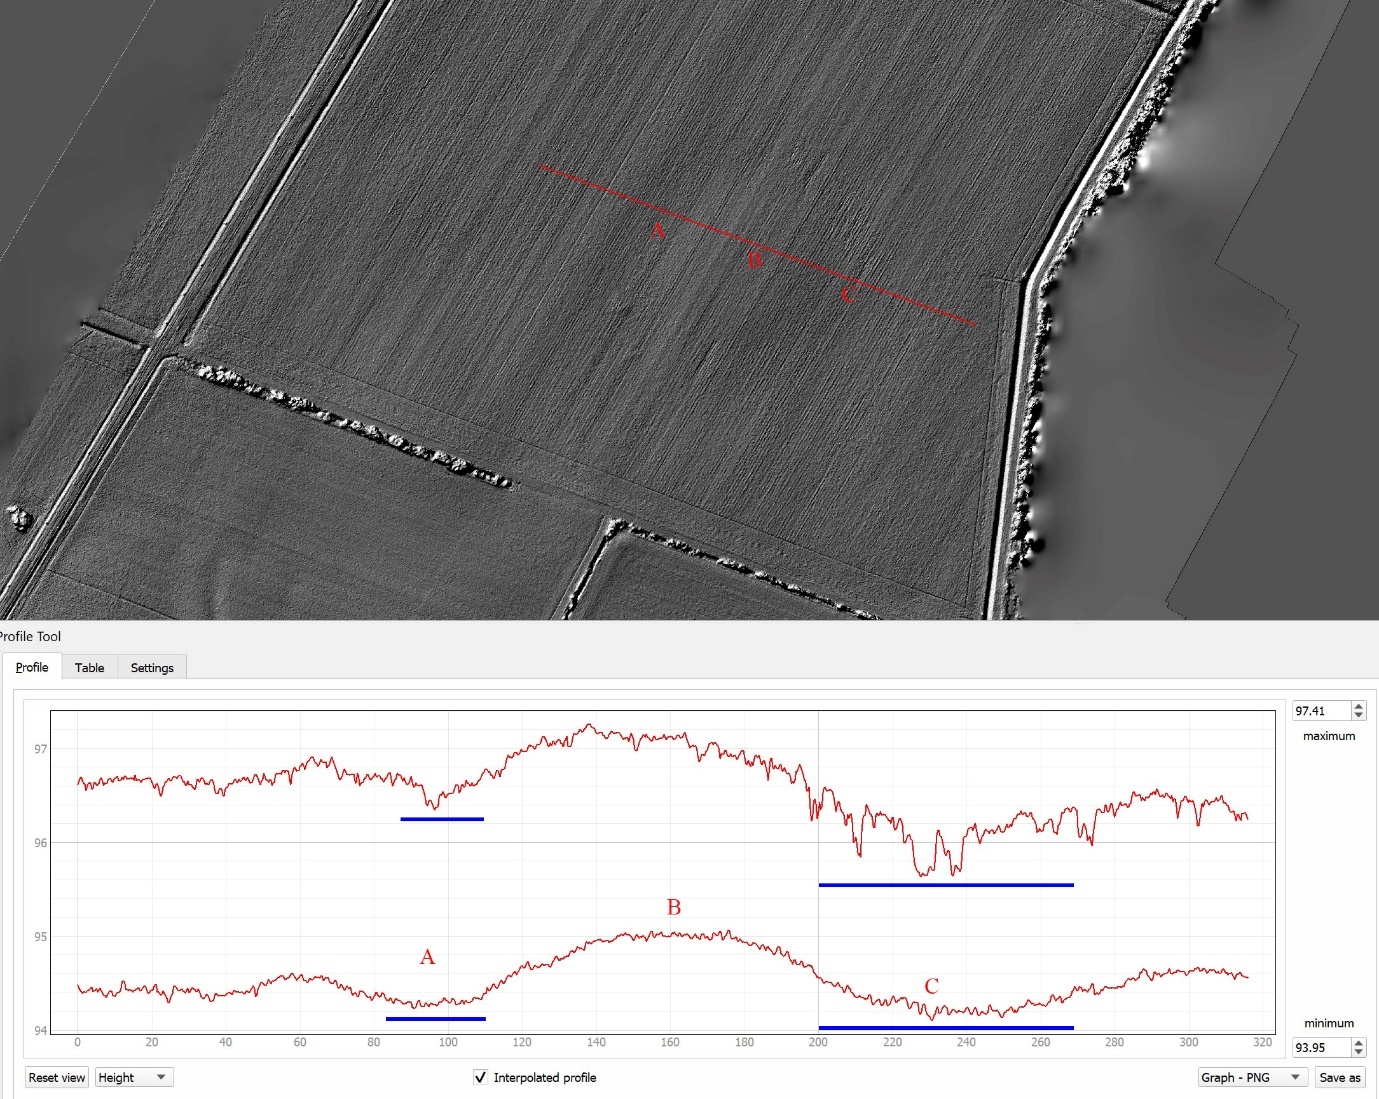
Figure 5 - The cross-section through the settlement on DTM and DSM with the ditch marked by A & C and the top of the settlement marked by a B; top cross-section – DSM, lower cross-section - DTM
Discussion
The DTM and the DSM models generated at the Tomašanci – Dubrava site revealed that although the archaeological features are situated in ploughed fields the microtopography is not entirely wiped out. The slight differences in ground elevation (20 – 60 cm) reflect the big earthwork and building activities of the Neolithic society which dwelled in the area roughly 6000 years ago. Cropmarks are commonly explained as inconsistent plant growth affected by buried archaeological features and they have been one of the most successful methods of archaeological feature detection (Renfrew & Bahn 2016, p.85). They are usually used as a method of detection in cultivated levelled fields where subsurface features such as ditches positively affect the plant growth while features such as ramparts of buried walls negatively affect the growth of the plant (Renfrew & Bahn 2016, p.84). In periods of drought the plants experience a stress-related decay of chlorophyll which effects the colour of the plants, but previous research has indicated that the height of the plants can also be affected (Verhoeven & Vermeulen, 2016, p.2). An example from Montarice in Italy demonstrated that plants growing over a large ditch feature grew more than the surrounding vegetation (Verhoeven & Vermeulen, 2016, p.9). In our example the height of the plants in the DSM consistently follows the relief of the soil beneath it, which is different from the previously mentioned example from Monatrice. This could be explained by the fact that we did not conduct the survey during drought conditions, and it seems that the local microtopography could also be a factor. Our example demonstrated that the plants that grew higher were situated in higher terrain, with shorter plants were growing over lower terrain (ditches). We conclude that detailed terrain models can be used to detect extensive archaeological features such as enclosure ditches and other large earthworks associated with prehistoric communities. Outside of archaeology authors studied three-dimensional point clouds of crops, and in some cases even referred to it as Crop Surface Models (CSM) (Bendig et al., 2013) or in some archaeological publications as Canopy Height Model (CHM) (Stott et al., 2015). Although not widely known, the use of crop canopy height variations was previously successfully used in archaeological interpretations and has been demonstrated as a useful technique for intra site feature detection (Verhoeven & Vermeulen, 2016). Our example and other research such as the Montarice (Verhoeven & Vermeulen, 2016) example clearly demonstrate that there is more valuable information in the canopy of the crops and the height of the plants than that was previously realized. This is also true in the case of the LiDAR data where canopy biomass was successfully used as a proxy for the detection of archaeological vegetation marks (Stott et al., 2015). It is a fact that magnetometric surveys are still the best method for mapping out these types of archaeological traces. However, one large setback in this area remains that magnetometers still cannot reliably be used in large aerial surveys, but LiDAR and aerial photography derived models can. A similar approach utilizing multiple archaeological prospection techniques and overlaying them to achieve the best result was recently completed on a similar feature from lower Austria (Wallner et al., 2022).
Detailed terrain models of extremely large areas can thus be used to detect new enclosures and help with the archaeological interpretation of these vast archaeological landscapes. This fact has broader implications because it can serve as a basis for future research in this area especially if we consider application on a wider level where ALS data or aerial photographs taken by the state geodesic service can be used to create DSM or DTM models.
Acknowledgements
We are grateful to Marin Mađerić who made the second drone survey, C. Meyer for the magnetic survey and all the participants in the 2022 excavation. Preprint version 4 of this article has been peer-reviewed and recommended by Peer Community In Archaeology (https://doi.org/10.24072/pci.archaeo.100407; Katsianis, 2024).
Data, scripts, code, and supplementary information availability
DEM from the first survey in 2022 (DSM) can be found at https://doi.org/10.5281/zenodo.10477777 (Vukovic, 2024a) and DEM from the second survey 2023 (DTM) can be found at https://doi.org/10.5281/zenodo.10477800 (Vukovic, 2024b). Supplementary information can be found at https://doi.org/10.5281/zenodo.10477812 (Vukovic, 2024c).
Conflict of interest disclosure
The authors declare that they comply with the PCI rule of having no financial conflicts of interest in relation to the content of the article.
Funding
This research is funded by the Croatian Science Foundation, IP-2019-04-5344 and IP-2024-05-1598.