
 CC-BY 4.0
Introduction
It is widely recognized that feeding management during the dry period influences feed intake, milk yield, energy balance, and health status at the beginning of the next lactation. Unfortunately, the recommendations of feeding strategies for dry cows are often contradictory. Numerous studies have recommended high energy prepartum diet to prevent the reduction of the surface area of rumen papillae and improve the absorption capacity of VFA in the rumen and therefore improve production and health in early lactation (Grummer, 1995; McNamara et al., 2003; Rabelo et al., 2003). It is worth noting that, most of the studies are based on restricted intakes to control the daily energy supply. Under these conditions, the evaluation of voluntary intake of cows is not necessary. However, this practice is not advisable on commercial dairy farms because it can lead to competition at the feed bunk and increased variablility in intake levels among cows (Mann et al., 2015). On the contrary, some authors have demonstrated negative effect on peripartal metabolism of higher energy diet in the dry period (Dann et al., 2006; Bjerre-Harpoth et al., 2014; Gruber et al., 2014). Moreover, restricted energy intake during the dry period could even be beneficial. A slight mobilization of adipose tissue caused by prepartum restriction could enhance the liver’s ability to process fatty acids postpartum, thus resulting in lower lipid content postpartum (Friggens et al., 2004).
Consequently, feeding the dry cows ad libitum with low energy and high fill value diet seems to be a relevant strategy for regulating easily the intake while limiting excessive energy consumption (Vickers et al., 2013; Mann et al., 2015; Salin et al., 2018). Accurate estimation of voluntary feed intake is therefore necessary to formulate an appropriate ration. However, the voluntary intake of dry cows has received little attention. Some of the existing feeding systems for ruminants in the world propose the direct prediction model of DMI. The French feeding system for ruminants (INRA 2018) considers the fill effect (by using the same fill unit to evaluate both intake capacity of cows and fill value of feeds, expressed in UEL – fill unit for lactation), and can generally better estimate the feed intake in response to varied diets. However, it was initially developed in lactating cows and has seldom been evaluated in dry cows, and may fail to capture the specific characteristics of dry cows, particularly regarding their milk yield potential. In the INRA feeding system (2018), intake capacity is predicted using an estimated fictitious milk yield to account for the effect of milk yield potential, assuming that lactation continued for dry cows. This assumption is conceptually difficult to justify given the non-lactating status of dry cows. Moreover, this estimated yield, derived from the standard 305-day lactation curve, progressively decreases as the dry period advances, further limiting its relevance. An overall parameter representing milk yield potential such as the peak milk yield potential could be more appropriate.
We therefore conducted this study to evaluate the voluntary intake of dairy cows receiving a TMR with high fill value, and assess it’s evolution throughout the dry period depending on cow’s characteristic. The objectives of the study were to i) describe the pattern of voluntary feed intake in dry cows during late gestation, ii) identify the main factors influencing voluntary intake, with a particular focus on milk yield potential, and iii) adjust the intake capacity prediction model of INRA (2018).
Material and methods
Ethics statement
This study did not require approval from an animal experimentation ethics committee, as all measurements were obtained from routine on-farm data recording without any invasive procedures. The animals were housed under conditions fully compliant with current regulations on animal housing (Directive 98/58/EC).
Animals and housing
The experiment was carried out during 3 consecutive years (2021, 2022 and 2023) in experimental farm Les Trinottières (Montreuil-sur-Loir, France). Sixty-two Holstein cows (26 primiparous and 36 multiparous) were enrolled in the experiment. The dry-off took place 8 weeks before the expected parturition. After a 1-week transition period, cows were fed a total mixed ration (TMR) until parturition. The last 6 weeks were considered for analysis. The ration consisted of 56.7% of maize silage, 31.0% of wheat straw, 11.4% of rapeseed meal and 0.9 % of mineral supplements (expressed as % DM; Table 1). The animals were fed by individual automatic feeding systems (Biocontrol AS, Rakkestad, Norway). The TMR were offered ad libitum with a target refusals level of 5%/cow. The distribution of TMR took place once a day at 10:00 am.
Table 1 - Composition and characteristics of TMR.
Composition (as % of dry matter) | |
Maize silage | 56.7 |
Wheat straw (chopped) | 31.0 |
Rapeseed meal | 11.4 |
Mineral premix | 0.6 |
Magnesium chloride | 0.3 |
Nutritional characteristics (INRA 2018) | |
UFL1 (/kg DM) | 0.72 |
PDI2 (% DM) | 6.5 |
CP (% DM) | 9.0 |
NDF (% DM) | 54.2 |
ADF (% DM) | 31.3 |
RPB3 (g/kg DM) | -23 |
UEL4 (/kg DM) | 0.98 |
1UFL (Unité fourragère lait) =1760 kcal of net energy; 2Protein truly digestible in the small intestine (INRA 2018); 3Rumen protein balance; 4UEL (Unité d’encombrement lait) : Lactating fill unit.
Measurements and calculation
The automatic feeding systems consisted of bins placed on weighing cells that automatically weighed the feed before and after each animal’s visit. Access to the feeding systems was controlled by gates that recognized individual animals via RFID (Radio Frequency Identification) ear tags and allowed only one animal at a time. The quantities of voluntary intake on an as-fed basis were recorded in dedicated software, and the dry matter intake (DMI) was calculated based on the DM content of the TMR measured daily. Body weight (BW) was measured weekly using an electronic scale. DMI as a percentage of body weight (DMI%BW) was calculated as the ratio between DMI and BW. Body condition score (BCS) was measured at dry-off and was measured fortnightly and interpolated on a weekly basis on a scale from 0 to 5 with 0.25-unit increments (Bazin, 1984). The BCS gain was calculated as the BCS during the week before calving minus the BCS at dry-off. Based on a study of Daros et al. (2021), and accounting the scale difference of BCS (from 1 to 5 used by Daros et al., 2021), the cows were categorized into thin (BCS at dry off ≤3, averaged 2.69, n=33,) and fat (BCS at dry off >3, averaged 3.50, n=29). Parity was categorized at the time of dry-off as either primiparous (i.e., cows that had completed their first lactation) or multiparous cows. Thus, 11 primiparous and 18 multiparous were classified as fat. The peak milk yield potential of each cow was calculated as the individual peak milk yield recorded during the completed lactation multiplied by 1.08 (INRA 2018).
The net energy supply (in UFL, 1 UFL=1760 kcal of net energy) permited by feed intake was calculated by using the INRAtion ®V5 software. The energy balance (expressed in UFL) was then calculated by the difference of daily energy supply of intake and energy requirements including maintenance, growth and gestation of each cow according to the INRA feeding system for ruminants (INRA 2018). The weekly average of DMI, DMI%BW, BW, BCS, and energy balance were calculated for each cow for statistical analysis. The weekly average fill value of TMR (expressed in UEL) was calculated for each cow by using INRAtion ®V5. The weekly observed intake capacity was then calculated by DMI× fill value of TMR for each cows. The weekly predicted intake capacity by existing model of INRA (2018) was also calculated by using INRAtion ®V5, according to the equation:
IC = [14.25 + (0.015 × (BW – 600)) + (0.11× Milk yield) + (2.5-BCS)] × Ind_ICgest × Ind_ICmat × Ind_ICPDI
with the coefficients of adjustment for:
the stage of gestation: Ind_ICgest = 0.8 + 0.2 × (1-exp (-0.25 × (40-week of gestation))),
the maturity of the cow: Ind_ICmat = - 0.1 + 1.1 × (1-exp (-0.08 × Age)),
the protein content of the diet: Ind_ICPDI = 0.91+0.115 / (1+exp (0.13 × (90-PDI/UFL)).
The “Milk yield” here refers to the “fictitious milk yield,” calculated according to the INRA (2018) prediction model, assuming that lactation continues during the dry period.
Thereafter, the difference between observed and predicted (INRA 2018) weekly intake capacity (∆ intake capacity) was also calculated for each cow.
Statistical analyses
Various statistical approaches have been developed to describe the role of specific animal characteristics on individual voluntary DMI, and to refine the INRA 2018 intake capacity model for pregnant dry cows. Statistical analyses were performed in R 4.2.2 (R Core Team, 2022).
Descriptive analysis
To describe the weekly evolution during the dry period, DMI, DMI (%BW), BW, BCS, and energy balance were analysed using linear mixed-effects models implemented in the nlme package (R software). For each response variable, the model included week relative to parturition as a fixed effect and cow as a random effect to account for repeated measurements. The general form of the model was:
Yij = μ + Weeki + Cowj + εij
where Yij is the response variable, μ is the overall intercept, Weeki is the fixed effect of week relative to parturition, Cowj is the random effect of cow, and εij is the residual error.The difference between fat and thin cows were analysed by linear mixed models by including the cow as random effect. The effect of week relative to parturition on ∆ intake capacity was also analysed by linear mixed models by including the cow as random effect.
Factors influencing voluntary intake during the dry period
A mixed linear model was built to explain the DMI, using parity, week relative to parturition and body condition class at dry-off as fixed effects, weekly BW and peak milk yield potential as covariates (nlme package of R software) . The interaction between parity and BW and that between parity and peak milk yield potential were also included. The cow was included as random effect.
Ajustment of INRA prediction model of intake capacity during the dry period
Considering the complexity of the model and the sparsity of data, we decided to partially adjust only the effect of milk yield potential in the intake capacity prediction model of INRA (2018), and retain all other terms to ensure the consistency of the prediction model between lactating and dry cows. For this purpose, the calculated values for other terms were removed from the observed weekly average intake capacity. The resulting residual value, which represented the portion of intake capacity attributable to milk yield potential, was then analyzed using a linear mixed model, with peak milk yield potential as a fixed effect and cow as a random effect (nlme package). This approach is based on the methodology described by Sauvant and Nozière (2016).The obtained coefficient of peak milk yield potential was then integrated in the prediction model. The predicted weekly intake capacity was calculated using the new prediction model for all cows and compared with the observed values using a linear model. The slope of the correlation was tested against 1 and the intercept against 0. The mean squared prediction error (MSPE), along with its three components (mean bias, slope bias, and unexplained random error), were calculated using R software to assess the accuracy of the predicted values from the model compared to the observed values (Bibby and Toutenburg, 1977).
Results
Descriptive analysis
The weekly evolution of DMI, DMI as a percentage of body weight (DMI%BW), intake capacity, body weight (BW), body condition score (BCS), and energy balance (in UFL) during the last 6 weeks of gestation in dairy cows are reported in Table 2.
Dry matter intake (DMI) averaged 16.9 kg, it showed a gradual decline from 17.4 kg at week -6 to 15.9 kg at week -1 (p < 0.001). DMI expressed as a percentage of body weight (DMI%BW) averaged 2.1%, and followed a similar decreasing trend, dropping from 2.24% to 1.98% (p < 0.001). The observed intake capacity averaged 16.7 UEL over the dry period, it decreased significantly from 17.1 UEL at week -6 to 15.5 UEL at week -1 (p < 0.001). Body weight (BW) increased progressively over the period, from 770 kg at week -6 to 805 kg at week -1 (p < 0.001), with significant differences across most weeks. Body condition score (BCS) also increased significantly, from 3.07 to 3.29 (p < 0.001), with stabilization in the last three weeks. Energy balance (in UFL) declined over time, from 2.40 UFL at week -6 to just 0.36 UFL at week -1 (p < 0.001).
Table 2 - Weekly evolution of performance during the last six weeks of gestation in dairy cows.
Week -6 | Week -5 | Week -4 | Week -3 | Week -2 | Week -1 | SEM | p-value | |
|---|---|---|---|---|---|---|---|---|
DMI (kg) | 17.4a | 17.4a | 17.3a | 17.2a | 16.6b | 15.9c | 0.213 | <0.001 |
DMI%BW | 2.23a | 2.22ab | 2.19ab | 2.16b | 2.07c | 1.97d | 0.030 | <0.001 |
Intake capacity (UEL) | 17.1 a | 17.1 a | 17.0 a | 16.9 a | 16.1 b | 15.5 c | 0.220 | <0.001 |
BW (kg) | 768a | 777ab | 787bc | 796cd | 801d | 804d | 10.2 | <0.001 |
BCS (pts) | 3.06a | 3.09ab | 3.18bc | 3.25c | 3.27c | 3.28c | 0.064 | <0.001 |
Energy balance (UFL) | 2.40a | 2.41a | 2.07ab | 1.81b | 1.08c | 0.36d | 0.159 | <0.001 |
*On the same row, two values without common letters are significantly different.
Cows that were fat at dry-off had significantly higher body condition scores than thin cows throughout the dry period (3.45 vs. 2.97, p < 0.001, Table 3). Their BCS gain was significantly lower than that of thin cows (0.07 vs. 0.35, p < 0.05). Indeed, the BCS of cows that were already fat at dry-off remained stable throughout the dry period (NS), whereas the BCS of cows that were thin increased (p < 0.001, Figure 1). Similarly, fat cows at dry-off had a lower accumulated energy balance than thin cows (54.0 vs. 85.2 UFL, p < 0.01).
Fat cows had higher DMI than thin cows (17.2 vs. 16.3 kg, p < 0.01). However, they tended to have lower intake relative to body weight (2.10% vs. 2.16%, p = 0.068). Indeed, fat cows also had significantly greater body weight (823 vs. 760 kg, p < 0.001), and higher peak milk potential (42.7 vs. 31.9 kg, p < 0.001).
Table 3 - Difference between fat and thin cows* in intake, body weight, energy balance, and milk yield.
Fat | Thin | SEM | p-value | |
|---|---|---|---|---|
DMI (kg) | 17.2 | 16.3 | 0.24 | <0.01 |
DMI%BW | 2.10 | 2.16 | 0.03 | 0.079 |
BW (kg) | 823 | 760 | 9.9 | <0.001 |
Average BCS | 3.44 | 2.98 | 0.05 | <0.001 |
BCS gain | 0.07 | 0.35 | 0.06 | <0.05 |
Accumulated energy balance (UFL) | 54.0 | 85.2 | 7.88 | <0.01 |
Peak milk potential (kg) | 42.7 | 31.9 | 1.38 | <0.001 |
*Cows were categorized into thin (BCS at dry off ≤3) and fat (BCS at dry off >3).
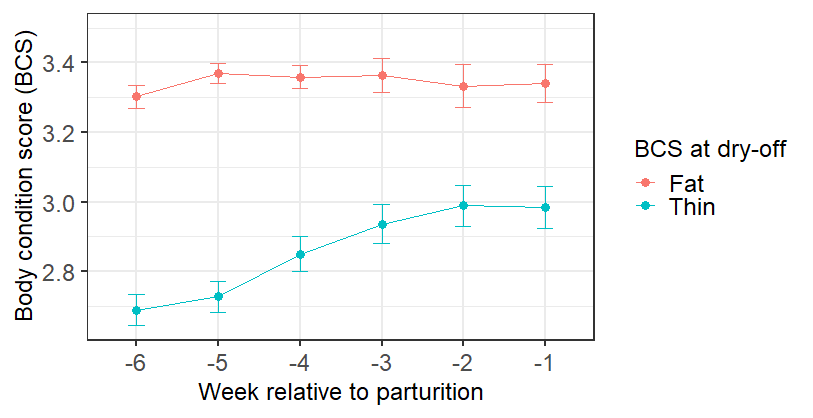
Figure 1 - Evolution of BCS of fat and thin cows during the dry period.
Factors influencing voluntary DMI during the dry period
The parity (p < 0.001), BW (p < 0.05), week relative to parturition (p < 0.001) and peak milk yield potential (p < 0.01) as well as the interaction between parity and BW and that between parity and peak milk yield potential significantly influenced DMI, the effect of BCS at dry-off was not significant (p = 0.835, Table 4). Primiparous cows showed significantly lower dry matter intake (DMI) compared to multiparous cows (17.0 vs. 17.7 kg, p < 0.001). For primiparous cows, DMI (kg/day) increased by 0.0109 per kg of body weight and by 0.125 per kg of peak milk yield potential. For multiparous cows, DMI (kg/day) did not vary with body weight and increased marginally by 0.007 kg for each additional kg of peak milk yield potential. The residual standard deviation of the model was 1.01.
Table 4 - Parameter estimates from the linear mixed-effects model explaining voluntary DMI.
Effect | Estimate | SE | p-value |
|---|---|---|---|
Intercept | 10.64 | 1.89 | <0.001 |
Parity (primiparous) | −6.89 | 1.64 | <0.001 |
Body weight | 0.005 | 0.002 | <0.05 |
Week -5 | 0.461 | 0.119 | <0.001 |
Week -4 | 0.344 | 0.116 | <0.01 |
Week -3 | 0.349 | 0.117 | <0.01 |
Week -2 | −0.323 | 0.119 | <0.01 |
Week -1 | −0.900 | 0.121 | <0.001 |
BCS at dry-off | −0.026 | 0.123 | 0.835 |
Peak milk yield potential | 0.066 | 0.027 | <0.05 |
Parity × Body weight | 0.006 | 0.002 | <0.01 |
Parity × Peak milk yield potential | 0.059 | 0.025 | <0.05 |
Ajustment of INRA prediction model of intake capacity
The comparison between observed and predicted (INRA 2018) values of intake capacity during the last 6 weeks of gestation are presented in Figure 2. The ∆ intake capacity averaged 1.81 ± 1.51 UEL (representing 10.8% of the observed value). The effect of week relative to parturition was significant on ∆ intake capacity (p < 0.01), it increased from 1.33 UEL in week -6 to 1.91 UEL in week -1.
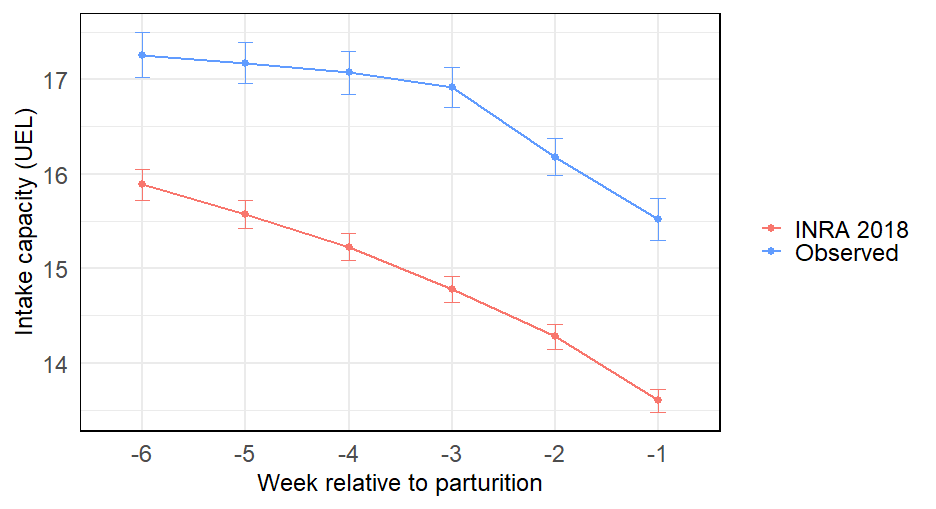
Figure 2 - Evolution of predicted (according to INRA 2018) and observed intake capacity during the dry period.
The effect of peak milk yield potential on the partial intake capacity values (after removing the calculated values for all other terms) was significant (p < 0.001), with a coefficient of 0.080 ± 0.005 and a residual standard deviation of 1.25.
Then the new equation proposed to describe the intake capacity of pregnant dry cow is :
IC= [14.25+ (0.015× (BW-600)) + (0.08× Peak milk yield potential) + (2.5-BCS)] × Ind_ICgest × Ind_ICmat × Ind_ICPDI
The intake capacity predicted by this new model is positively correlated to the observed value (R2 = 0.34, p < 0.001, Figure 3), with a slope of 0.58 (significantly different from 1, p < 0.001) and a RSE of 1.45. The intercept (7.11) is significantly different from 0 (p < 0.001). The mean and slope biases account for 1.2% and 21.4% of the MSPE respectively. A high proportion of the MSPE (77.4%) is attributed to random variation.
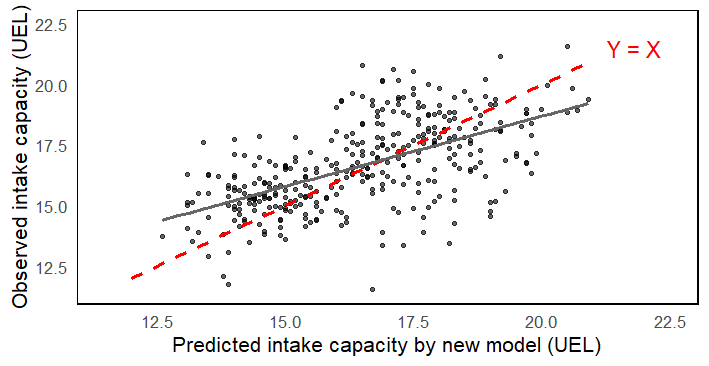
Figure 3 - Correlation between observed intake capacity and predicted value by the new model.
Discussion
Since high-energy but restricted-quantity prepartum diets have long been recommended, the voluntary intake capacity of dry cows has received little attention in the past. More recently, it has been demonstrated that feeding dry cows ad libitum with low-energy, high fill-value diets appears to be beneficial. Some recent studies have been conducted to evaluate the voluntary DMI of dry cows (Vickers et al., 2013; Mann et al., 2015; Salin et al., 2018). The present study confirmed a progressive but limited decrease in voluntary intake of dry cows during the last six weeks of gestation, while the progression of BW and BCS gains appeared to decelerate in the final weeks of the dry period. However, the average decline in DMI (7.6%) during the final 2 to 3 weeks before parturition observed in our study was considerably lower than that reported by Hayirli et al. (2002) (32.2%) and Marquardt et al. (1977) (25.0%). This could be explained by the hight fibre content of the diet. Indeed, Dewhurst et al. (2000), reported a smaller depression in DMI (16.0%) in cows fed a diet containing 40% barley straw and 60% grass silage, compared to those fed 100% grass silage (25.0%) or supplemented with 0.5 kg/day of prairie meal alongside grass silage (24.0%). The average DMI during the dry period (16.9 kg) was relatively higher than that reported in most published studies. This may be partly attributed to the greater body weight of the cows in our study, as well as the short chop length of straw (7-10 cm) included in the ration. This is supported by Havekes et al. (2020) who reported higher DMI (15.6 vs. 15.0 kg/d) in cows fed short straw (2.5 cm) diet than long straw (10.2 cm) diet.
Effect of BCS
Dairy cows display variations in body reserves depending on the gestation-lactation cycle. At the beginning of lactation, as the increase in energy intake is not as rapid as the increase in milk yield, a part of the milk is produced by mobilising body reserves. After 12 weeks of lactation, energy intake generally exceeds requirements, and the cow begins to reconstitute reserves until the next calving. Dairy cow should therefore reach the highest BCS just before calving. This is consistent with the lipostatic theory: after the change in body reserve, feed intake is modified until their equilibrium point is reached again (Faverdin et al., 2007). This occurs via a mechanism in which thin cows utilize lipogenic substrates more rapidly than fat cows, which prevents the excessive accumulation of these substrates in their blood (Bines and Morant 1983). In the prediction model of INRA (2018), the equilibrium point is set at BCS of 2.5 which represents the median value on the 0 to 5 scale. However, the equilibrium point may vary from one cow to another making it difficult to assess the influence of BCS on intake capacity among different cows. In the present study, cows that were already fat at dry-off retained their body condition throughout the dry period, suggesting that their equilibrium point was already reached whereas the thin cows did not. The effect of BCS at dry-off on DMI and BCS gain over the dry period is actually well documented (Bines and Morant 1983; Daros et al., 2021). These results could help locate the equilibrium point of BCS of individual cows, and contribute to development of a future dynamic and individualised prediction model for intake capacity in dairy cows during the peripartum period.
In the present study, fat cows at dry-off did not show lower DMI, likely due to confounding factors such as their higher body weight and peak milk yield potential. However, when DMI was expressed as a percentage of body weight, they exhibited lower DMI%BW than thin cows.
Effect of parity
Richards et al. (2020) suggested that the higher DMI in multiparous cows could be largely explained by their greater body weight. However, in our study, primiparous cows showed significantly lower DMI than multiparous cows, consistent with the significant effects of parity and body weight, as well as their interaction, indicating that parity affects DMI independently of body weight. Indeed, apart from the effects of body weight, BCS and milk yield potential, the INRA 2018 prediction model of intake capacity also included a maturity index (Ind_ICmat) which take into account the parity effect.
Effect of peak milk yield potential
In lactating cows, there is a strong correlation between milk yield potential and intake capacity, regardless of the source of variation—whether it be genetic potential, stage of lactation, or parity (Faverdin et al., 2007). Given that dry cows are non-lactating, the effect of milk yield potential has long been disregarded. The previous INRA system (Faverdin 1992, INRA 2007) recommended applying the same intake capacity prediction model used for lactating cows to dry cows, with the term of milk yield simply excluded. Similarly, NASEM (2021) does not consider milk yield potential in its prediction model of DMI. In INRA (2018), the model considered the effect of milk yield potential by using an estimated fictitious milk yield, assuming lactation continued. However, this estimated yield, drived from the standard 305-day lactation curve, could be markedly reduced as the dry period progresses, making it less applicable. Additionally, the milk yield prediction equation included a correction factor for the gestation stage, which further accentuates the reduction in predicted milk yield in the weeks approaching calving. This could explain the increasing difference between observed and predicted intake capacity by the INRA 2018 model as the dry period progresses. Indeed, genetic potential of milk yield may better explain the intake capacity during the dry period. The present study demonstrated that peak milk yield potential is a relevant parameter to explain the variation in DMI of dairy cows during this phase. This is in line with Daros et al. (2021) who also reported the effect of 305-day milk yield on DMI of cows during the dry period. Nonetheless, the actual 305-day milk yield could be altered by health issues or farming practices, thus the potential value used in the present study should be a better parameter to represent this effect.
Updated prediction model
In INRA (2018), peak milk yield potential is a common parameter used to estimate the milk yield according the lactation stage and can be easily calculated from 305-day milk yield. By replacing the estimated fictitious milk yield by peak milk yield potential in the prediction model of intake capacity, the present study obtained an adequate coefficient to estimate the effect of milk yield potential on intake capacity of cows during the dry period. Nevertheless, because the dataset comes from a single farm and primarily high milk potential cows fed only one specific ration, the current model should be considered a proof-of-concept rather than a final, broadly applicable prediction tool. These limitations influence both the inference and potential application of the proposed model update. Additional measured data on DMI in dry cows under various experimental conditions, including cows of different breeds, milk yield potentials, diets, and dry period durations, would be required to confirm the consistency of this term and the others (not change in our proposal) within the prediction model and to refine a more representative coefficient before proposing the final adjusted equation.
Conclusion
This study demonstrated a progressive but limited decrease in voluntary intake of dairy cows during the last six weeks of gestation, with decelerating body weight and body condition score gain. We confirmed the influence of existing factors in the INRA model, parity, body condition score, body weight, and gestation stage, on the voluntary intake of dry cows, and demonstrated the relevance of an additional factor: peak milk yield potential. By retaining all other terms and coefficients used in predicting intake capacity during lactation (INRA 2018), we replaced the fictitious milk yield by the peak milk yield potential and adjusted a new coefficient to better reflect intake capacity during the dry period. These findings provide a foundation for refining prediction models for intake capacity in dairy cows during the dry period, though further data are needed to confirm the consistency of these factors and to refine the prediction.
Acknowledgements
The authors gratefully acknowledge the staff of Les Trinottières experimental farm for their participation in this project.
Preprint version 5 of this article has been peer-reviewed and recommended by Peer Community In Animal Science (https://doi.org/10.24072/pci.animsci.100354; Yildirim, 2026).
Funding
This work was conducted with the financial support of the Région Pays de la Loire, France.
Conflict of interest disclosure
The authors declare that they comply with the PCI rule of having no financial conflicts of interest in relation to the content of the article.
Data, scripts, code, and supplementary information availability
Data are available online (https://doi.org/10.5281/zenodo.17158299; Huang et al., 2025). Scripts and code are available online (https://doi.org/10.5281/zenodo.17130456; Huang, 2025).