
 CC-BY 4.0
Introduction
Music and language are two human cultural universals found in all known societies: separately (e.g., instrumental music, speech), but also together in the form of songs with words (Greenberg, 1963; Brown, 1991; Fitch, 2011; Brown & Jordania, 2013; Mehr et al., 2019; Patel, 2008; Savage, 2026; Savage et al., 2015). Previous research in fields including musicology, linguistics, psychology, anthropology, and neuroscience has identified neural, acoustic, and behavioural relationships between song and speech (Feld & Fox, 1994; Patel, 2008; Ding et al., 2017; Hallam et al., 2016; Harris et al., 2023; Savage, 2026; Sammler, 2025). However, most previous research has been limited to speakers of English and other European languages, limiting the generality of conclusions that can be drawn (Blasi et al., 2022; Henrich et al., 2010; Patel, 2008).
A key question is what, if anything, consistently distinguishes song from speech across languages? Steven Pinker famously dismissed music as an evolutionarily “useless” byproduct of adaptative traits such as language (Pinker, 1997), while others have argued that the regular pitches and rhythms of music facilitate adaptative functions such as bonding individuals together or signaling group membership beyond the capacities of language (Mehr et al., 2021; Savage, 2026; Savage et al., 2021). However, these debates have mostly been conducted in the absence of direct cross-cultural comparisons of actual singing and speaking (Benítez-Burraco, 2021; Honing, 2021; Leivada, 2021; Pinker, 2021).
Recently, Ozaki et al. (2024) compared audio recordings of singing and speaking from 75 individuals speaking 55 languages, concluding that “Globally, songs and instrumental melodies are slower and higher and use more stable pitches than speech” and speculating that “the slower and more stable pitches may facilitate synchronization, harmonization, and ultimately bonding between multiple individuals” (Ozaki et al., 2024). However, these individuals were coauthors who were mostly researchers and professional musicians and were not representative of general speakers/singers of their languages, so the degree to which their findings would generalise to other speakers of their languages remains unclear (Sammler, 2024). While this limitation was mitigated by comparisons of singing and speaking recordings from separate cross-linguistic databases (Albouy et al., 2024; Anikin et al., 2023; Hilton et al., 2022; Ozaki et al., 2024), these databases did not include annotated segmentations into acoustic units (e.g., syllables/notes), meaning it was not possible to directly replicate Ozaki et al. (2024)‘s analyses. And because Ozaki et al. (2024) only included one or a few speakers of each language and averaged their results across many languages, it is possible that some of their results may display different effects within different languages. For example, tonal languages such as Mandarin or Yoruba could conceivably use more stable spoken pitches, while “mora-timed” languages such as Japanese could be faster (Steingo & Ghazanfar, 2025).
Another key limitation of previous datasets is that they included only solo singing/speaking, whereas most singing and speaking throughout the world tends to be done in groups (Dunbar, 1996; Savage et al., 2015; Shilton et al., 2023). To overcome this, we have designed a new study in collaboration with over 80 researchers aiming to collect data on group singing and speaking in diverse languages from 1,800 participants across 60 different sites around the world (Savage et al., 2025a). However, there remains the challenge of annotating all this data in an efficient and equitable way.
Equitable coauthorship in global collaboration
One factor underlying the annotation issue is the broader challenge in big team science of ensuring equitable credit and authorship for all collaborators at all locations, rather than only having them listed as middle authors in large coauthored publications (or not listed as coauthors at all) (Coles et al., 2022; Forscher et al., 2023; Savage et al., 2023; Urassa et al., 2021; Vaidis et al., 2024). High-quality segmentation of cross-cultural audio recording corpuses requires many different researchers who are speakers of diverse languages to spend substantial time manually annotating audio recordings (Ozaki et al., 2024). While one might hope that automated segmentation technology might reduce or eliminate this barrier, Ozaki et al. (2024)‘s analyses found that automated segmentation tools are not yet sufficiently reliable for our goals, and in fact could have led to incorrect conclusions:
While automatic segmentation can be effective for segmenting some musical instruments and animal songs (e.g., percussion instruments and bird song notes separated by microbreaths), we found that they did not provide satisfactory segmentation results compared to human manual annotation for the required task of segmenting continuous song/speech into discrete acoustic units such as notes or syllables…. For example, Mertens’ automated segmentation algorithm used by Hilton et al. (2022) mis-segmented two of the first three words “by a lonely” from the English song used in our pilot analyses (“The Fields of Athenry”), oversegmenting “by” into “b-y,” and undersegmenting “lonely” by failing to divide it into “lone-ly”...if we had used this automated method, then we would have mistakenly concluded that there is no meaningful difference in IOI [Inter-Onset Interval] rates of singing and speech…collaboration with native/heritage speakers who recorded and annotated their own speaking/singing relying on their own Indigenous/local knowledge of their language and culture allowed us to achieve annotations faithful to their perception of vocal/instrumental sound production that we could not have achieved using automated algorithms…This highlights that equitable collaboration is not only an issue of social justice but also an issue of scientific quality” (Ozaki et al., 2024).
Using the Programmatic Registered Report model (Chambers, 2022; Logan et al., 2022), we aim to overcome these challenges by enabling each local team to publish a first-authored article based on their segmentation and analysis of data from their own language/culture. We propose to create up to 27 Stage 2 Registered Reports (Table 1 & Figure 1) that all follow the basic protocol of this Stage 1 Registered Report. These teams represent a subset of all 26 interested teams from the 60 global teams that have agreed to collect singing/speaking data from 15-30 participants each as part of a broader study on the behavioural effects of singing/speaking on social bonding (Savage et al., 2025a).
By unifying these Stage 2 Registered Reports around a small shared set of three hypotheses for confirmatory testing, this should allow for coherence across different teams using shared methods, while also giving each team the flexibility to add additional exploratory analyses according to their own interests. For example, some sites are based in ethnomusicology departments and may add qualitative ethnographic analyses; others are based in psychology departments and may add extra analyses of demographic data; others are based in computer science departments and may add extra acoustic analyses. However, all teams will collect, analyse and report the same basic confirmatory hypothesis testing replicating Ozaki et al. (2024)‘s original acoustic comparison of song and speech (Ozaki et al., 2024).
Hypotheses
We hypothesize that Ozaki et al. (2024)‘s findings of three key differences between singing and speaking will replicate in all languages and all sites tested. Specifically:
-
Singing uses higher pitch than speech
-
Singing is slower than speech
-
Singing uses more stable pitches than speech
For each of the 26 sites/Stage 2 reports, we will conclude whether or not each of Ozaki et al. (2024)‘s three key findings (regarding tempo, pitch height, and pitch stability) generalise to their given language/location. We will also include a meta-analysis comparing all sites with Ozaki et al. (2024)‘s original results to conclude whether their findings generalise across all studied languages/locations. For each of the three features in each language, we will conclude whether songs are significantly higher/faster/more stable than speech (replicating Ozaki et al. (2024)), significantly equivalent (Lakens, 2017) (contradicting Ozaki et al. (2024)), or inconclusive (if neither null hypothesis testing nor equivalence testing are statistically significant; see Table 2).
Table 1- Planned languages/communities, authors and journals for Stage 2 manuscripts resulting from this Programmatic Stage 1 Registered Report protocol. Note that the bolded entry indicates the language/site represented by the current Stage 2 manuscript.
|
# |
Language (/community) |
Authors (*corresponding) |
Preferred journal |
|
1 |
Mapudungun |
Moya, Silva-Zurita, *Savage, *Soto-Silva |
Royal Society Open Science |
|
2 |
isiZulu |
Nguqu, *Savage, *Opondo |
Peer Community Journal |
|
3 |
Yoruba |
Nweke, Olajide, Adeaga, *Savage |
Peer Community Journal |
|
4 |
te reo Māori |
Pavlovich, Parkinson, Purdy, *Savage |
Royal Society Open Science |
|
5 |
Danish |
Kortegaard, *Savage, *Hansen |
Royal Society Open Science |
|
6 |
English (Auckland) |
Shi, Purdy, *Savage |
Royal Society Open Science |
|
7 |
English (Gold Coast) |
Perry, Wolff, *Savage, *Thompson |
Royal Society Open Science |
|
8 |
English (Boston) |
Han, *Savage, *Loui |
Royal Society Open Science |
|
9 |
English (Buffalo) |
Ampiah-Bonney, Gabriel, *Savage, *Pfordresher |
Royal Society Open Science |
|
10 |
English (Toronto) |
Cabildo, *Savage, *Vanden Bosch der Nederlanden |
Peer Community Journal |
|
11 |
Greek |
Kolios, *Savage |
Peer Community Journal |
|
12 |
Farsi |
Dabaghi Varnosfaderani, *Savage, *Beck |
Peer Community Journal |
|
13 |
Italian |
Guiotto Nai Fovino, *Savage, *Grassi |
Peer Community Journal |
|
14 |
Romanian |
Vaida, Echim, *Savage, *Popescu |
Royal Society Open Science |
|
15 |
Spanish (Santiago) |
Moya, Soto-Silva, *Savage, *Silva-Zurita |
Peer Community Journal |
|
16 |
Bulgarian |
Kurdova, *Savage, *Mikova |
Peer Community Journal |
|
17 |
Czech |
Nuska, Štěpánková, *Savage, *Hajič jr. |
Royal Society Open Science |
|
18 |
Macedonian |
Arabadjiev, *Savage |
Royal Society Open Science |
|
19 |
Polish |
Krzyżanowski, *Savage, *Podlipniak |
Royal Society Open Science |
|
20 |
Japanese |
Chiba, Ozaki, Fujii, *Savage |
Peer Community Journal |
|
21 |
DhoLuo (Luo) |
*Opondo, *Savage |
Royal Society Open Science |
|
22 |
Maasai |
Parselelo, *Savage |
Peer Community Journal |
|
23 |
Mandarin (Auckland) |
Jia, Purdy, *Savage |
Peer Community Journal |
|
24 |
Mandarin (Reading) |
He, *Savage, *Liu |
Peer Community Journal |
|
25 |
Guarani |
Barbosa, Kuikuro, Natsitsabui, *Savage |
Peer Community Journal |
|
26 |
Finnish |
Bamford, Hartmann, Thompson, Niiranen, *Savage |
Royal Society Open Science |
|
27 |
All 26 languages |
Jia, Ozaki, Pavlovich, all other authors, Purdy, *Savage |
Advances in Methods and Practices in Psychological Science** |
Since this is a Programmatic Registered Report where one Stage 1 protocol will result in multiple Stage 2 outputs, it is possible that different Stage 2 outputs will produce different results for different languages. This will allow us to evaluate criticisms that global analyses of cross-cultural trends fail to address the importance of internal diversity (“How many exceptions are researchers willing to ignore?”) (Steingo & Ghazanfar, 2025).
Methods
Study design
Essentially, this Programmatic Registered Report combines two previous Registered Report protocols (Ozaki et al., 2024; Savage et al., 2025a) to replicate and extend Ozaki et al. (2024)‘s acoustic analysis of 75 individuals singing/speaking solo (Ozaki et al., 2024) to Savage et al.’s larger sample of singing/speaking in many different groups (Savage et al., 2025a).
Of the 60 sites that have agreed to collect singing/speaking data for Savage et al.’s global experiment, 26 are interested in using this Programmatic option to replicate/extend Ozaki et al. (2024)‘s analyses for their own language/culture (Figure 1 & Table 1). We will transcribe the monophonic singing and speaking audio from all 15-30 participants per site and segment the recordings into acoustic units (e.g., syllables/notes (Ozaki et al., 2024); see Figure 4 below and videos in Appendix for details) and use these segmented recordings to replicate Ozaki et al. (2024)’s key analyses.


Figure 1- Map of the 26 planned languages/locations of the Stage 2 reports in Table 2 (subset of the 60 sites in Savage et al. (2025a)). Note that Mandarin Chinese [Auckland] is highlighted in blue in the table, representing the dataset collected in the present study, while the grey ones indicate the 25 other languages/sites to be collected for other Stage 2 reports.
The selection of these 26 sites was determined before any Stage 2 data collection began for Savage et al. (2025a). All 60 research sites were invited to participate. Inclusion in this Programmatic Registered Report depended only on the interest and availability of researchers at each site. In particular, they had to be willing to wait to begin data collection until this Programmatic Registered Report also receives In Principle Acceptance to ensure maximum bias control (Level 6 (Guide for Recommenders, n.d.)).
Except for the Stage 2 output combining all studies (#27 in Table 1), each Stage 2 will focus its confirmatory analyses on the results of its own analysis of its own focus language. #27 will replicate Ozaki et al. (2024)‘s cross-linguistic meta-analysis approach to analyse average trends across all languages, which can be compared with the results of each individual Stage 2 reports #1-26 to achieve a much broader evaluation of the cross-linguistic replicability and generalisability of Ozaki et al. (2024)’s original results. Comparison of specific differences between languages will be reserved for exploratory analysis (since statistical power for such comparisons will be limited by the relatively small sample size of n=15-30 participants per language).
To ensure maximal consistency across Stage 2 reports, all Stage 2 reports will restrict their confirmatory analyses and statistical hypothesis testing to only these three hypotheses. They are welcome and encouraged to explore additional unregistered exploratory analyses, but these must be “justified, methodologically sound, and informative” (Guide for Recommenders, n.d.).
Full details of study design can be found in the original publications (Ozaki et al., 2024; Savage et al., 2025) - here we summarize and quote key aspects relevant to this Programmatic protocol, highlighting any differences from the original protocols.
Sample size and singing/speaking conditions
Each site will collect up to 30 adults singing/speaking in three groups of 5-10 people at a time. The rationale for this sampling size was:
Our multi-site design means that our sample size estimation is primarily constrained by the maximum feasible sample size. Through initial consultation with potential collaborators, we determined the optimal sample size that would allow us to maximise diversity across many sites while allowing experimenters to feasibly recruit relatively large groups of participants was up to 30 participants per site (max 10 per condition across three conditions) for each of the sites shown in Figure 3. Pilot experiments suggested that getting all participants to show up at the agreed location on time was a major unavoidable logistical issue, and that groups of 4 or fewer may not be large enough to test the predictions of the social bonding hypothesis (since singing in small groups “might only produce a small increase… relative to conversation” (Savage et al., 2021)). We thus decided to allow for experiments to run if at least 5 participants assembled on time for a given group. (Savage et al., 2025a).
Note that this optimal sample size was determined by combining a quantitative survey asking each potential collaborator to list the maximum number of participants they could feasibly recruit with qualitative, holistic discussions via a series of Zoom meetings with collaborators.
Each of the three groups will engage in four conditions: group singing, alternating singing, conversation, lyric recitation. In contrast, Ozaki et al. (2024)’s confirmatory analyses compared 75 individuals singing a traditional song solo and then describing the meaning of the lyrics (also solo), comparing the first 20s of singing/speaking for each individual. Ozaki et al. (2024) also included a solo lyric recitation condition and an instrumental melody condition, although these were not included in their confirmatory analyses.
In order to maximize comparability with Ozaki et al. (2024)‘s analyses, we will focus our confirmatory analyses on only the conversation and alternating singing conditions (Figure 2), as these are the ones with monophonic recordings of individual singing/speaking voices to enable comparison of singing vs. speaking for each individual. (Any comparisons with the unison singing and lyric recitation conditions will be reserved for exploratory analyses.)
Note that, while Savage et al. (2025a) compare social bonding effects of these different conditions using a between-participant design, our acoustic analysis proposed here instead compares singing vs. speaking for each individual participant in a within-participant design (i.e., comparing the same person’s singing voice with their speaking voice, following Ozaki et al. (2024)’s original acoustic analyses).
Audio recordings from all conditions will be made publicly available for analysis/replication. Participants will also be monitored by video. Video will not be published, but will be used to ensure experiment instruction compliance and to match singing/speaking recordings for individuals within the group.
Note that the original studies this Programmatic Registered Reports replicates and extends had very different minimum sample size requirements: Ozaki et al. (2024) specified a minimum sample size of 60 participants, while Savage et al. (2025a) required a minimum sample size of 450 participants total (minimum of 30 sites, each with a minimum of 15 participants). For this Programmatic report, Stage 2 reports #1-26 will rely on acoustic data from the subset of sites from Savage et al. (2025), and thus also have a minimum of 15 participants each. However, it is possible that in some sites the number of participants with analyseable singing and speaking audio recordings may be fewer than the number of participants (e.g., if a participant does not have a chance to speak during the conversation condition).

Figure 2 - Schematic overview demonstrating an example of the two conditions analysed in confirmatory analyses. Here, only the first two participants are shown singing or speaking sequentially, but the total number of participants will be between 5-10 per experiment (A). Text columns #1 and #2 represent the first and second phrases of alternating singing (B) / speaking (C) conditions. This example shows lyrics for “茉莉花 (Jasmine Flower)”, the song chosen for the current study (participants in Auckland New Zealand speaking Mandarin Chinese), and hypothetical conversation based on the ice-breaker prompt “如果你有机会居住在一个不同的国家一年,你想要选择哪个国家,为什么?(If you could live in a different country for a year, which country would you choose and why?)”. (See Savage et al. (2025a)’s Figure 1 for an illustration of the lyric recitation and synchronised singing conditions not included in the current confirmatory analyses.)
We will specify a minimum of 10 participants per site. For the meta-analysis (#27), it is likely that some of the 26 proposed sites will not be able to complete their Stage 2 Reports within. However, a meta-analysis of even a small number of sites would still be valuable, meeting criteria such as Advances in Methods and Practices in Psychological Science’s “Registered Replication Reports (RRRs)”, which require “direct (i.e. close) replications in any area of psychology that involve coordination between at least three (but preferably more) independent teams of researchers” (https://rr.peercommunityin.org/about/pci_rr_friendly_journals#h_9155735686741652439066888). For consistency with this and with Ozaki et al. (2024)‘s original minimum sample size of 60 participants for cross-linguistic meta-analysis, we will plan to continue the meta-analysis Stage 2 Report (#27 in Table 1) even with as few as 60 participants worth of data from as few as 3 sites are collected, analysed, and published as Stage 2 reports (i.e., minimum sample size for the meta-analysis of 60 participants from a minimum of 3 languages).
Blinding
Following Rennung & Göritz (2016), Savage et al. (2025a) classify their experiment as “blinded” because the experimenters will be “not present during the manipulation and measurement of outcome variables”. Participants are unlikely to be aware of our three hypotheses tested here (particularly because the primary goal of Savage et al. (2025a)’s experiment is to test social bonding, not acoustic features). Because the first authors of each article will do the annotation/segmentation of the recordings from their own language/culture, they cannot be blinded to hypotheses or conditions. However, the likelihood that bias in the annotation process could influence the results is low, particularly since Ozaki et al. (2024) found high levels of inter-rater reliability in these annotations (intraclass correlation coefficients >.99).
Randomisation
At each site, the 15-30 participants will be randomly assigned into one of three groups. Each group completes the same four conditions (conversation, monophonic singing, unison singing, lyric recitation) but in different orders. When the (unaccompanied) monophonic singing condition follows the unison singing accompanied by karaoke-style accompaniment, participants may be influenced by having just heard and sung at the key and tempo matching this accompaniment. Likewise, it is possible that people may sing/speak differently depending on whether they have a conversation before or after singing. For these reasons, Savage et al. (2025a) counter-balanced the order of conditions in the three participant groups as follows, enabling exploratory analyses of potential order effects:
• Group 1: 1) conversation, 2) monophonic (alternating) singing, 3) unison singing, 4) lyric recitation
• Group 2: 1) unison singing, 2) lyric recitation, 3) monophonic (alternating) singing, 4) conversation,
• Group 3: 1) lyric recitation, 2) unison singing, 3) conversation, 4) monophonic (alternating) singing
Song/speech selection and participant inclusion criteria
Each site in Savage et al. (2025a) will recruit 15-30 participants and choose its own song (cf. Table S1 from Savage et al. (2025a)) and conversation prompt using the following criteria. Note that the need to recruit participants to sing together in groups means it is not feasible to allow each participant to choose their own song as Ozaki et al. (2024) did:
Participant inclusion criteria:
Each site will recruit participants who meet the following inclusion criteria:
• Age 18 or over
• Able to sing the song chosen for that site (with lyrics provided)
• Able to converse in the same language its lyrics are written in
• Have access to a phone or other device that can scan QR codes
• Willing to have their singing/speaking voice recorded and shared publicly (without being identified by name)
Song selection criteria:
Each site has chosen a song that would be appropriate for their language/culture. The criteria for choosing a song were:
• lyrics are mostly in the same language that participants will use for their group conversation (some lyrics in other languages or meaningless vocables like “la la” are acceptable, but should not make up the majority of the song)
• should be easy for most potential participants from that society to sing together in synchrony (e.g., unison, homophony) with karaoke-style pre-recorded instrumental accompaniment without needing to practise ahead of time. If possible, this should be in the form of a karaoke-style video with plain background and lyrics that appear in real-time to help the participants to sing at the right time, with no guide melody (e.g., https://youtu.be/OhRUYf_yn_s?si=eL4mt_-utRwqrFMj&t=10). If pre-recorded instrumental accompaniment would not be appropriate for a given site/society, a cappella (unaccompanied) song may be chosen instead.
• should be the kind of song that would be appropriate to sing by young adults who don’t already know each other as a short “ice-breaker” exercise. As such, songs that might easily become awkward, embarrassing, or offensive should be avoided (e.g., children’s songs, songs with polarising content or associations such as national anthems or religious songs). However, these factors may vary from site to site (e.g., for some communities a national anthem or religious song might be the best choice, while in others it might be the worst). The experimenters from each site should interpret this on the basis of their own local knowledge.
• the song should take between 2-3 minutes to sing (you are welcome to modify the number of verses/choruses (including repeating the song) to make this happen
• if the song has instrumental interludes/introductions/outros, these should not be longer than 1 minute total and there should still be 2-3 minutes of singing time not including these instrumental sections.
Conversation ice-breaker question criteria:
Each team will choose their own unique ice-breaker question for the conversation condition (this can be taken directly from one of the following lists, adapted from them, or newly created themselves, but teams should all choose different questions):
https://www.mural.co/blog/icebreaker-questions
Criteria for questions:
• Should not be about music/singing
• Should not use words/concepts that will be rated to create our dependent variable (i.e., “team”, “similar”, “trust”, “close”, “ties”, “common”).
• Should not ask sensitive/personally identifiable information (e.g., name, address, birthday, religion, sexuality, etc.)
• Should be capable of short answers (5-15 seconds per person)
Outcome-neutral criteria (“designed prior to knowledge of the results and …independent of the main study hypotheses” (Guide for recommenders, n.d.))
Savage et al. (2025a)’s experiment will employ the following outcome-neutral exclusion criteria
• Participants who fail to show up on time at the agreed location
• Participants who fail to complete the experiment and submit the Qualtrics survey
• Participants who are unable to complete the singing/speaking task in the specified language
• Participants who fail the attention check
• Participants with any confirmatory dependent variable’s data missing or corrupted due to technical glitches
• Participants with mean baseline social bonding scores of >80/100 (to avoid ceiling effects)
• Duplicate submissions by the same participant
• All participants from groups where “Instruction compliance” for the main experimental task (first condition) is judged unacceptable by the experimenter (<25 out of 100)
• Sites where useable data are only collected from fewer than 15 participants across all 3 groups
Savage et al.’s criteria are focused on their confirmatory analysis goals of comparing social bonding rating data, rather than the acoustic recordings. Thus, it is possible that some participants from that study will pass those outcome-neutral criteria, but fail to provide reliable audio data (e.g., if the audio fails to record due to a technical glitch). It is also possible that some participants could fail their outcome-neutral controls (e.g., failing to submit the Qualtrics survey) but still provide useable audio recordings for this Programmatic protocol. Therefore, while our new protocol relies on audio recordings collected by Savage et al. (2025), these audio recordings will be subject to the following separate set of outcome-neutral inclusion criteria to ensure the recordings are of sufficient quality, duration, and reliability that they can be reliably used for our confirmatory hypothesis testing comparing acoustic features of singing vs. speaking.
Audio quality
To ensure high-quality recordings, the equipment should include either a laptop running Audacity or a high-quality digital recorder (such as Zoom H4, H5, or H6) with an external microphone at a sampling rate of 44.1 kHz or 48 kHz. The recording device should be placed centrally among the participants to maintain an equal distance from each speaker. To be analysable, audio recordings must meet minimum standards of quality, such that our three confirmatory dependent variables (pitch height, temporal rate, and pitch stability) can be reliably measured (i.e., at least 10 units of matched singing/speaking whose fundamental frequency can be extracted; see Inclusion/Exclusion Criteria and Figure 2 simulation below). This means they need to be recorded accurately with low enough noise and high enough quality that fundamental pitch can be automatically extracted using the pYIN algorithm (Mauch & Dixon, 2014), and the units (syllables or notes) can be clearly determined.
Duration of singing/speaking
One methodological challenge is that we cannot guarantee that all participants will speak for at least 20s in the group conversation condition as Ozaki et al. (2024) did for their solo spoken description condition. However, this limitation is mitigated by the fact that 20s was chosen by Ozaki et al. (2024) as the minimum length needed to reliably measure phrase contour for comparing pitch declination (which requires longer units separated by breaths), whereas the three features we propose to test here do not include pitch declination but only features requiring shorter acoustic units (e.g., syllables/notes).
While Ozaki et al. (2024) annotated the first 20s of both singing and speaking, this resulted in different numbers of acoustic units, ranging from as low as 18 sung notes (Thai) to as high as 113 spoken syllables (Greek and Hebrew). Since the number of acoustic units is the limiting factor for our three proposed features, we simulated the effects of using different numbers of acoustic units (ranging from 2-50 syllables/moras/notes) from Ozaki et al. (2024)’s data in order to optimise the amount of annotation needed for reliable results (Figure 3).
Simulation analysis of Ozaki et al. (2024)‘s data (Figure 3) suggests that effect size estimates from fewer than 10 acoustic units each of singing/speaking are not reliable, but that using more than 30 acoustic units each does not substantially increase reliability. Participants will be singing/speaking for an average of around 15-30 seconds each (5-10 participants speaking/singing for 2-3 minutes each), but this will vary particularly in the conversation condition as some individuals tend to speak more/less than others and there is no forced alternation of speaking in the experimental condition (unlike the alternating singing condition which will result in less variation in singing time).
From a logistics perspective, the most time-consuming part of analysis is the manual annotation of acoustic units. On average, it takes approximately one minute to annotate two acoustic units (e.g., syllables/notes). Thus we estimate it should take the lead author from each site approximately 4-8 hours to annotate 30 acoustic units each of speaking and singing recordings (following the instructions in Appendix) from their 15-30 participants (corresponding to approximately 8 seconds of spoken conversation and 15 seconds of singing per participant).
Given the simulation results and experimental logistics, we propose analysing the first 30 acoustic units for all singers/speakers, but including all singers/speakers who produce at least 10 usable acoustic units of both singing and speaking. Other participants (e.g., those who don’t speak at all or produce less than 10 syllables of speaking during the conversation condition) will be excluded from these acoustic analyses. Therefore, we will analyse the first 30 acoustic units of singing and of speaking, and exclude any participants who produce fewer than 10 analyseable acoustic units of either singing or speaking.
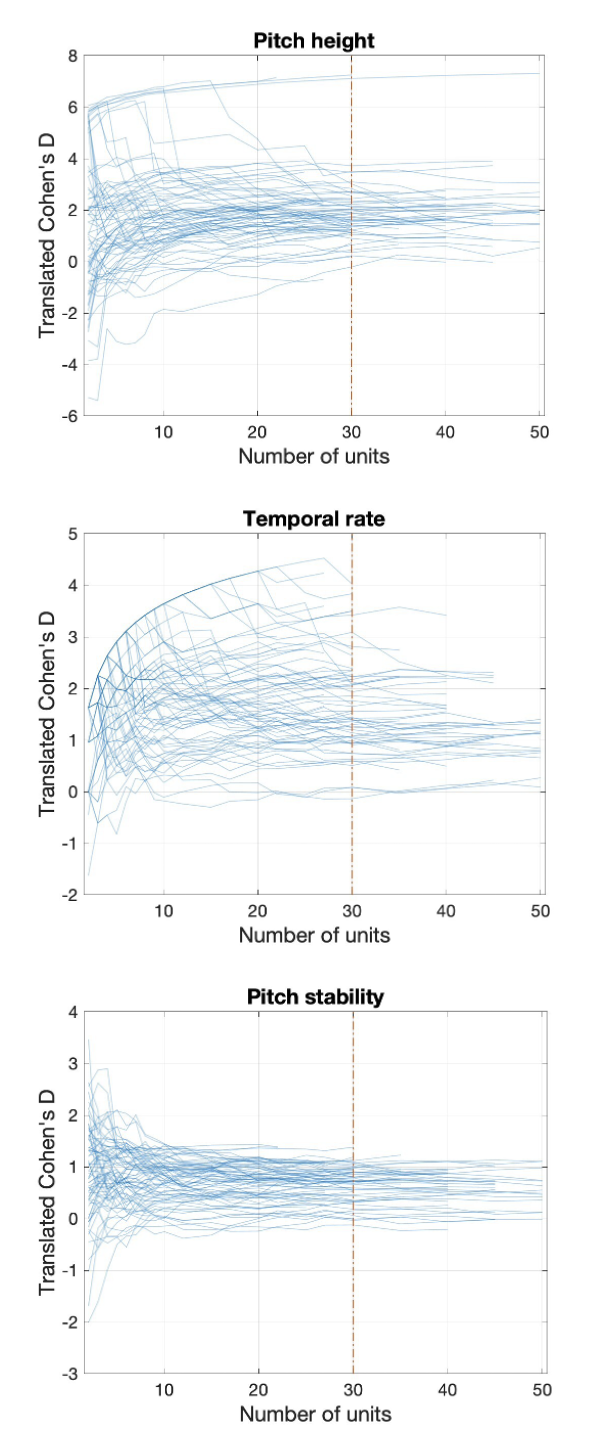
Figure 3 - Simulation using Ozaki et al. (2024)’s singing/speaking data from 75 individuals speaking 55 languages showing effects of varying number of spoken/sung units analysed on estimated effect sizes for the proposed three confirmatory dependent variables (pitch height, temporal rate, and pitch stability). Estimates are unreliable below 10 acoustic units, but stabilise and do not change substantially beyond our proposed cutoff of 30 acoustic units (dashed vertical line).
Inter-rater reliability
Before annotating audio, each coder will watch the training tutorial video (Appendix). We will measure inter-rater reliability (IRR) following Ozaki et al. (2024) by having author Jia independently re-annotate onsets of singing and speaking from one randomly selected participant from each Stage 2 report. Like Ozaki et al. (2024), Jia will be blind to the specific onset timings annotated by the original coder, but will have access to their segmented texts (since otherwise Jia will not know the correct way to segment acoustic units such as syllables/notes spoken/sung in languages she does not speak). For reference, Ozaki et al. (2024) found “strong intraclass correlations (>0.99)” when using this method to compare 10s excerpts of singing vs speaking from 8 individuals randomly selected from the full sample of 75 individuals. Any sites with intraclass correlations of less than 0.75 (a typical threshold for “good” (Koo & Li, 2016) or “excellent” (Cicchetti, 1994; Landis & Koch, 1977) reliability) will be independently re-checked by Savage for another randomly selected song. If this is also less than 0.75, then all songs from that site will be checked and re-annotated until they achieve coefficients of at least 0.75.
Inclusion/exclusion criteria summary
Inclusion criteria:
• The first 30 useable acoustic units (e.g., syllables/notes) of monophonic singing/speaking audio collected from each of the 15-30 adult participants from each site collected by Savage et al. (2025a) will be used in confirmatory analyses
• Minimum sample size for Stage 2 reports #1-26: 10 participants
• Minimum sample size for Stage 2 report #27: 60 participants speaking at least 3 different languages
• For the meta-analysis (#27) all useable data from Stage 2 reports #1-26 collected and analysed within 18 months after In Principle Acceptance will be included
Exclusion criteria:
• Sections with simultaneous singing/speaking and vocalizations that are not singing or speaking (e.g., laughing, groaning)
• Audio where the fundamental frequency cannot be automatically extracted
• Participants with fewer than 10 analyseable acoustic units for both singing and speaking (e.g., 10 spoken syllables of conversation and 10 notes of monophonic singing for English)
• Audio whose annotations do not achieve “good” levels of inter-rater reliability (intraclass correlations at least 0.75)
• All participants from groups where “Instruction compliance” for the conversation or alternating singing conditions is rated unacceptable by the experimenter (<25 out of 100). (These ratings will be made immediately after the experiment before viewing or analysing the data, to avoid confirmation bias)
• If any sites choose to withdraw (i.e., not to publish a Stage 2 report), their data will also not be included in the meta-analysis confirmatory analyses in #27. In such cases, the meta-analysis will report the reasons for withdrawal (e.g., lack of time to analyse data or write up analyses; researcher graduating/changing jobs; data not meeting inclusion criteria standards) and describe how much, if any, of the data were collected/analysed before withdrawal, summarising any preliminary results if they exist. Note that we cannot commit to analysing all data if sites withdraw because our proposed acoustic analyses require time-consuming manual annotation by researchers with knowledge of the local language/music. However, we commit to not making decisions about whether or not to withdraw based on how these affect our conclusions.
Analysis Plan
Independent variable: Vocal modality (alternating singing vs conversational speaking)
Dependent variables (all identical to the first three from Ozaki et al. (2024); see Figure 4):
-
Pitch height (fundamental frequency [f0] in hertz)
-
Temporal rate (inter-onset interval [IOI] rate in hertz)
-
Pitch stability (−|Δf0| in cents per second)

Figure 4 - Schematic illustration of the three features analysed for confirmatory analyses, using a recording of author Savage singing the first two phrases of “Twinkle Twinkle Little Star” as an example. This figure is identical to Figure 3 in Ozaki et al. (2024), but only shows the three features proposed to test here of pitch height, temporal rate, and pitch stability. Onset annotations used to calculate Inter-onset Intervals (IOIs) are based on the segmented texts displayed at the top of the spectrogram (breaths are excluded from IOI calculations). For this English song, these onsets correspond to syllables, which also correspond to sung notes, as Twinkle Twinkle uses one note per syllable. However, the choice of acoustic units can vary depending on the language and song (Tilsen & Tiede, 2023). For example, in Japanese it typically corresponds to a “mora” (e.g., みんな = mi|n|na) and songs often use multiple notes per syllable (Chiba et al., 2026). Following Ozaki et al. (2024), the appropriate segmentation unit for each language is chosen by the lead researcher analysing that language (who is also a speaker of the language). In most cases, these units will be syllables or moras for speaking and notes for singing. Note that our analyses are intended to address speaking/singing rate, so higher- or lower-level units such as stressed syllables, metric downbeats, or phonemes (Patel, 2008; Nolan & Jeon, 2014) are not the focus of our confirmatory analyses.
For f0 extraction, we will use only the fully automated probabilistic YIN (pYIN) (Mauch & Dixon, 2014) method used by Ozaki et al. (2024) without also employing their custom semi-automated tool, since their analyses found “negligible differences” between results using the fully automated and semi-automated methods (see Ozaki et al. (2024)’s Figure 6 and “Exploring recording representativeness and automated scalability” section for full details). Note this automated f0 extraction method is only relevant to the measurement of pitch height (H1) and pitch stability (H3). Ozaki et al. (2024)’s analysis of temporal rate (H2) showed that automated methods of syllable/note segmentation are not reliable enough to replace manual annotation (see quote in the Introduction above).
Statistical analysis
We will follow essentially the same analysis methods as Ozaki et al. (2024) using a meta-analysis framework to compare effect sizes from each within-participant singing vs. speaking comparison across many different participants. The main differences are:
-
We are only testing three hypotheses (pitch height, temporal rate, and pitch stability) rather than Ozaki et al. (2024)’s six hypotheses
(2) Each site will test whether the hypotheses replicates for its own language/society, rather than comparing across many different languages simultaneously as Ozaki et al. (2024) did (though we will also run the cross-linguistic comparison for the final meta-analysis of all 26 languages/cultures)
The full analysis plan is adapted from Ozaki et al. (2024) as follows:
We use null hypothesis testing to test whether the effect size of the difference between song and speech for a given feature is null. There are various ways to quantify the statistical difference or similarity (e.g., Kullbak-Leibler divergence, Jensen-Shannon divergence, Earth mover’s distance, energy distance, Ln norm, Kolmogorov-Smirnov statistic). Here we focus on effect sizes to facilitate interpretation of the magnitudes of differences.
Since our main interest lies in the identification of whether three features - pitch height, pitch stability, and temporal rate - demonstrate differences between song and speech, we perform the within-participant comparison of these features between the pairs of singing and speech, using the alternating singing and conversation conditions as proxies for singing and speech, respectively (comparisons with synchronised singing and synchronised recitation are reserved for exploratory analyses). Terms in the computed difference scores are arranged so that for our predicted differences (H1-H3), a positive value indicates a difference in the predicted direction [cf. Figure 5].
Evaluation of difference in the magnitude of each feature is performed with nonparametric relative effects (Brunner et al., 2018) which is also known as stochastic superiority (Vargha & Delaney, 1998) or probability-based measure of effect size (Ruscio, 2008). This measure is a nonparametric two-sample statistics and allows us to investigate the statistical properties of a wide variety of data in a unified way.
We apply the meta-analysis framework to synthesize the effect size across recordings to make statistical inference for each hypothesis [see Figure 8 in Ozaki et al. (2024) for graphic overview]. In this case, the study sample size corresponds to the number of data points of the feature in a recording and the number of studies corresponds to the number of participants. We use Gaussian random-effects models (Brockwell & Gordon, 2001; Liu et al., 2018), and we frame our hypotheses as the inference of the mean parameter of Gaussian random-effects models, which indicates the population effect size, as follows:
The Gaussian random-effects model used in meta-analysis is (Liu et al., 2018; Benjamini & Hochberg, 1995):

is the effect size (or summary statistics) from  th study,
  is the study-specific population effect size,
  is the variance of th effect size estimate (e.g. standard error of estimate) which is also called the within-study variance,
 is the population effect size,
  is the between-study variance, and
  is the number of studies. In our study, is the relative effect and is its variance estimator (Brunner et al., 2018). In addition, the term “studies” usually used in meta-analysis corresponds to recording sets. This model can also be written as

Our null hypotheses for the features predicted showing difference is that the true effect size is zero (i.e. relative effects of 0.5). We test three features, and thus test three null hypotheses.
Since we test multiple hypotheses, we will use the false discovery rate method with the Benjamini-Hochberg step-up procedure (Benjamini & Hochberg, 1995) to decide on the rejection of the null hypotheses. We define the alpha level as 0.05. We test whether the endpoints of the confidence interval of the mean parameter of the Gaussian random-effects model are larger than 0.5. We use the exact confidence interval proposed by Liu et al. (2018) and Wang and Tian (2018) to construct the confidence interval.
For the equivalence testing, we first estimate the mean parameter (i.e., overall treatment effect) with the exact confidence interval (Liu et al., 2018; Wang & Tian, 2018) and the between-study variance with the DerSimonian-Laird estimator (DerSimonian & Laird, 1986) . Since Gaussian random- effects models can be considered Gaussian mixture models having the same mean parameter, the overall variance parameter can be obtained by averaging the sum of the estimated between-study variance and the within-study variance. Then, we plug the mean parameter and overall variance into Romano’s (2005) shrinking alternative parameter space method to test whether the population mean is within the equivalence region as stated in Table 1 (i.e., relative effects of 0.39 and 0.61).
Since relative effect sizes are less commonly used than Cohen’s D, we briefly clarify below how the two measures are related. The relative effect is the actual statistical quantity tested in our hypothesis test of confirmatory analysis as specified earlier. We chose this statistic because of its nonparametric nature and its applicability to a broad range of distributions for measuring differences between two groups. Relative effects take values between 0 and 1, interpreted as a probability that a random sample from one group is larger than a random sample from another group, where 1 indicates one group is completely “larger” than the other, 0 indicates the opposite, and 0.5 indicates no difference (Brunner et al., 2018; Ruscio, 2008). However, relative effects seem less commonly used than other effect sizes for measuring differences between two groups. Conveniently, the magnitude of relative effects can be expressed as Cohen’s D by \(D = \sqrt{2}\Phi^{- 1}(p_{re})\ \), which indicates the corresponding value of Cohen’s D for a given relative effect size, where \(\Phi^{- 1}\) is the inverse normal cumulative distribution function (Ruscio, 2008). Therefore, we also present our results using Cohen’s D by transforming the relative effects, with the aim of improving interpretability for readers. Note that Cohen’s D is (1) used solely to facilitate interpretation and is not involved in hypothesis testing, and (2) transformed from relative effects; therefore, it does not necessarily mean that the standard Cohen’s D calculation (i.e., mean difference divided by the standard deviation) provides the same value.
Power analysis
Our sample size of 15-30 per site is fixed by multi-site collaboration logistics from Savage et al. (2025a). Therefore, rather than determining the sample size needed to find a given effect size with a given power, our power analysis estimates what power we can expect to achieve a priori given our fixed sample size and effect size estimates from the study to be replicated (Ozaki et al., 2024). Note that, while using published effect sizes as estimates is often discouraged due to publication bias and the need to power for the Smallest Effect Size Of Interest, we believe it is an appropriate strategy given the unique sampling design of this report and the fact that the published effect sizes were themselves measured using a Registered Report (and therefore are not affected by publication bias).
Thus, we estimate the following power to reject false negatives (1-β) to test our three hypotheses given a fixed sample size (n = 15-30 participants per site), fixed site-wide false positive rate (α = .05/3 after Bonferroni correction for testing 3 hypotheses), and varying effect size estimates:
H1 (pitch height): Power (1-β) > .999 (effect size: d = 1.6)
H2 (temporal rate): Power (1-β) > .999 (effect size: d = 1.6)
H3 (pitch stability): Power (1-β) = .64 [for n=15] to .94 [for n=30] (effect size: d = 0.7)
Mandarin Auckland data collection
Participants
Twenty native Mandarin speakers participated in this study in Auckland, New Zealand. Participants were randomly assigned to three groups with sample sizes of 7, 7, and 6, respectively, all of which fell within the predefined within-group sample size range of 5–10 participants. Demographic information is presented in Table 2. All participants were over 18 years of age, self-identified as Chinese, and were born in China. Most of them were international University students. While we did not collect data on the date they moved to a non-Mandarin environment, the audio recordings confirmed that all participants spoke Chinese at a native level with no noticeable foreign accent. They were all able to sing Jasmine Flower, had a smartphone capable of scanning a QR code, and provided written consent for their voices to be recorded and shared publicly, thereby meeting the participant inclusion criteria.
Table 2 - Demographic information of 20 participants in the three groups.
Note: We recruited three groups and denoted them as “1”, “2”, “3”. The order of conditions was as follows: Group 1: (1) conversation, (2) monophonic (alternating) singing, (3) unison singing, and (4) lyric recitation. Group 2: (1) unison singing, (2) lyric recitation, (3) monophonic (alternating) singing, and (4) conversation.
Group 3: (1) lyric recitation, (2) unison singing, (3) conversation, and (4) monophonic (alternating) singing. Only conversation and monophonic (alternating) singing conditions were analyzed in the present manuscript. In the Gender Column, “M” refers to Male and “F” refers to Female; (M ± SD) stands for “mean ± standard deviation”; (n) stands for the number.
|
Group |
Number |
Age |
Gender (n) |
Native language |
Ethnicity |
|
|
(M ± SD) |
M |
F |
||||
|
1 |
7 |
21.0 ± 3.5 |
1 |
6 |
Mandarin (all groups) |
Chinese (all groups) |
|
2 |
7 |
24.6 ± 4.7 |
4 |
3 |
||
|
3 |
6 |
24.6 ± 11.2 |
2 |
4 |
||
Recording information
Audio recordings were collected using a Blue Yeti microphone connected to a laptop running Audacity, with the recording set to mono-track and a sampling rate of 44.1 kHz. Participants were required to discuss the topic “如果你有机会居住在一个不同的国家一年,你想要选择哪个国家,为什么?(If you could live in a different country for a year, which country would you choose and why?)” for 2’30s in conversation condition. For alternating singing, we selected the traditional Chinese folk song “茉莉花 (Jasmine Flower)” as the material. Jasmine Flower follows a strophic form consisting of three stanzas, each comprising seven lines. The song contains 153 syllables and 201 musical notes. In both conditions, participants took turns speaking or singing until the allotted time elapsed. All recordings were uploaded to the OSF (https://osf.io/e4pqv/files) and annotated using acoustic units of syllables for conversation and musical notes for singing. All 20 Mandarin-speaking participants from Auckland produced more than 10 analysable acoustic units, meeting the quantity and quality requirement for recording inclusion. The total number of annotated units for each group is summarized in Table 3. Within the same time period, the conversation condition was annotated with more units than the singing condition, whereas singing involved a greater number of rounds.
Inter-rater reliability
We analyzed the inter-rater reliability of onset annotation to evaluate the degree of individual variability in annotation. We chose the singing and conversation recordings from participant 19, and had another annotator Savage to annotate the first 30 units in both recordings (less than 15s). As described in the protocol earlier, Jia should annotate segments that are originally annotated by others. However, since Jia was the main experimenter and analyzer for her Mandarin data, another annotator (Savage) was assigned to Jia’s recordings. Then these annotations were compared with Jia’s annotations. The two sets of annotations showed strong intraclass correlation (> 0.99 for both conversation and singing), which is above the pre-defined threshold of 0.75 for strong reliability. The mean onset time difference between the two annotators was 0.19 s for conversation (SD = 0.18) and 0.13 s for singing (SD = 0.07; see Figure S2).
Table 3 - Summary of number of annotated units (syllables or notes) in singing and conversation conditions among the three groups.
Note: Round refers to one complete cycle in which all participants have spoken or sung once.
|
Group |
Condition |
Mean (n) |
SD (n) |
Range (Minimum - Maximum) |
Total number |
Number of Rounds |
|
1 |
Conversation |
89 |
46 |
49-151 |
620 |
1 |
|
Singing |
45 |
9 |
30-54 |
315 |
5 |
|
|
2 |
Conversation |
99 |
58 |
42-187 |
693 |
2 |
|
Singing |
38 |
5 |
30-44 |
268 |
4 |
|
|
3 |
Conversation |
79 |
29 |
45-126 |
475 |
2 |
|
Singing |
47 |
4 |
39-51 |
282 |
5 |
Results
Confirmatory results
Acoustic results
We compared the mean values between alternating singing and conversation across three acoustic features: (a) pitch height, (b) temporal rate, and (c) pitch stability. As shown in Figures 5 and 6, singing exhibited higher pitch height, slower temporal rate, and greater pitch stability than conversation. These acoustic patterns in group settings were broadly consistent with the findings of Ozaki et al. (2024) comparing individual’s singing versus speech, falling within 25% above or below Ozaki et al.’s estimates. Specifically, using pre to denote relative effects and p for statistical significance, the mean effect size for pitch height in the present study was translated to Cohen’s D=1.21 (pre = 0.81, 96.7% CI [0.70, 1.92], p = .00003), which was approximately 25% smaller than reported by Ozaki et al. (2024), whereas the effect size for temporal rate was D=2.07 (pre = 0.93, 96.7% CI [1.78, 2.36], p < 1x10-16), which was about 25% larger (see Table 4). The effect size for pitch stability was D=0.57 (pre = 0.66, 96.7% CI [0.39, 0.75], p = .00002) in the current study, approximately 14% smaller than Ozaki et al.’s estimate (D = 0.7).
All three relative effect sizes (pre) were over 0.5 with p < .0001, indicating the rejection of null hypotheses and supporting evidence for significant differences in three acoustic features between speech and song.

Figure 5 - Distributions of mean values of three acoustic features (pitch height, temporal rate, pitch stability) across singing and conversation conditions (n = 20 participants). The participants’ mean acoustic values are shown as black dots, with dashed lines connecting each participant’s produced speech and song.
Table 4 - Registered Report Design Planner. Includes three hypotheses (H1-H3).
|
Question |
Hypothesis |
Sampling plan |
Analysis plan |
Rationale for deciding the test sensitivity |
Interpretation given different outcomes |
Theory that could be shown wrong by the outcomes |
Actual outcome |
|
Are any acoustic features reliably different between song and speech across cultures? |
1) Singing uses higher pitch than speech |
Use sample from Savage et al. (2025a) (n=20 pairs of audio recordings from native Mandarin speakers; Figure 1). Each pair is sung/ spoken by the same person. Sample size is determined by recruitment logistics. |
Replicate analysis from Ozaki et al. (2024): Meta-analysis framework (Figure 5) calculates a paired effect size for pitch height (f0; Figure 4) for each song/ speech pair |
Power analysis estimate (1-β > .999) given fixed samples from Ozaki et al. (2024) (n=15-30 per site) and effect size estimate from Savage et al. (2025a) (d = 1.6). Bonferroni correction to account for multiple hypotheses tested (α = .05/3 =.017) |
The null hypothesis of no difference in f0 between sung and spoken pitch height is rejected if the population effect size is significantly larger than 0 (pre > 0.5, corresponding to Cohen’s d of 0). If we fail to reject the null hypothesis, we will perform equivalence testing (using equivalence boundaries of .39 < pre < 0.61 following Savage et al. (2025a), corresponding to Cohen’s d ±0.4). Otherwise, we neither reject nor accept the hypothesis. |
Ozaki et al. (2024)’s title claim that songs are “slower and higher and use more stable pitches than speech” |
Confirmed: pre = 0.80, Effect size (Cohen’s D) = 1.21, p = .00003 |
|
2) Singing is slower than speech |
Same as H1, but for temporal rate (inter-onset interval (IOI) rate) instead of pitch height (f0) [onsets are based on acoustic units corresponding to syllables or notes in English; see Figure 4] |
Confirmed: pre = 0.93, Effect size (Cohen’s D) = 2.07, p < 1x10-16 |
|||||
|
3) Singing uses more stable pitches than speech |
Same as H1, but for pitch stability (-|Δf0|) instead of pitch height. Lower estimated power of 1-β = .64 (for n=15) to .94 (for n=30) given smaller effect size estimate (d = 0.7) |
Confirmed: pre = 0.66, Effect size (Cohen’s D) = 0.57, p = .00002 |
|||||

Figure 6 - Effect sizes showing differences between singing and conversation across three acoustics features (pitch height, temporal rate, pitch stability) (n = 20). Note that the red diamond represents the median unbiased estimator of the effect size, corresponding to the value for which the upper-tail probability equals 0.5. The black vertical line connected to the left side of the red diamond represents the lower bound of the one-tailed confidence interval.
Exploratory results
Comparison with effect sizes from previous studies
We compared our effect sizes with Ozaki et al. (2024) and an alternative speech-song dataset from Hilton et al. (2022). Since that dataset did not provide annotations, we could only obtain effect sizes for pitch height and pitch stability, from Ozaki et al. (2024)‘s reanalysis. Our effect size for pitch height was 50% larger than Hilton et al. (2022)‘s (D = 0.8), and for pitch stability, it was roughly twice as large (D = 0.3).
Table 5 - Comparison of translated Cohen’s d values with Ozaki et al. (2024) and Hilton et al. (2022) for the three acoustic features (pitch height, temporal rate, pitch stability)
|
Pitch Height |
Temporal Rate |
Pitch Stability |
|
|
1.61 |
1.60 |
0.65 |
|
|
0.81 |
- |
0.35 |
|
|
Current study |
1.21 |
2.07 |
0.57 |
The effect of musicianship
We analysed seven additional exploratory variables related to participants’ music background collected via a Qualtrics survey (see Table 6 and Figure 7). These variables were Musicianship (self-perceived), Musicianship (complimented by others), Song Familiarity, Song Liking, Singing Regularity, years of singing training, and years of instrumental training. Of the measures, Musicianship (self-perceived) and Musicianship (complimented by others) were adopted from Goldsmiths Musical Sophistication Index (Gold-MSI) (Müllensiefen et al., 2014), a validated scale designed to evaluate musical sophistication. The two items were used to examine participants’ identification as musicians versus non-musicians, capturing both self-perceived and recognized by others. In addition, years of singing/instrument training were collected to provide objective indicators of participants’ formal musical training. Measures of Song Familiarity, Song Liking, and Singing Regularity were included to enable the possibility of exploratory analysis to characterize participants’ subjective engagement with musical activities, and also to minimize potential expectancy effects of main experiments. Participants were asked to rate each item on a scale from 0 to 100 based on their personal circumstances; singing training and instrument training were instead reported in years. The measured variables and their corresponding questions are listed below:
-
Musicianship (self-perceived): “I consider myself a musician”
-
Musicianship (complimented by others): “I have been complimented for my talents as a musical performer”
-
Song Familiarity: “I know the song we sang”
-
Song Liking: “I like the song we sang”
-
Singing Regularity: “I sing regularly”
-
Singing training: “How many years of formal musical training have you had in singing?”
-
Instrument training: “How many years of formal musical training have you had in musical instruments?”
Table 6 - Summary of musical background of seven variables across 20 participants. Mean, Standard Deviation (SD), Median, and Range were calculated and demonstrated.
|
Variables |
Mean |
SD |
Median |
Range |
|
Song Familiarity |
97.2 |
8.7 |
100 |
67 - 100 |
|
Musicianship (self-perceived) |
36.5 |
33.1 |
27 |
0 - 100 |
|
Musicianship (complimented by others) |
45.5 |
34.3 |
51 |
0 - 100 |
|
Song Liking |
73.9 |
22.4 |
71 |
46 - 100 |
|
Singing Regularity |
61.4 |
40.1 |
70 |
0 - 100 |
|
Singing training (years) |
0.2 |
0.7 |
0 |
0 – 3 |
|
Instrument training (years) |
3 |
4.2 |
1 |
0 – 15 |
Among all the variables, Song Familiarity ratings showed the highest mean values and relatively low variability compared to most other measures (Mean ± SD = 97.2 ± 8.7). All participants were familiar with the song and rated their familiarity as 100, except for two participants, who rated it 67 and 78, respectively. Other musicianship variables exhibited large individual variability. Participants reported a relatively high liking for the song Jasmine Flower (Mean ± SD = 73.9 ± 22.4). Musicianship (self-perceived) and Musicianship (complimented by others) received lower mean ratings but showed wide variability across individuals (Self-perceived: 36.5 ± 33.1; Complimented: 45.5 ± 34.3). Participants reported a relatively high self-rated regularity of singing on average (mean = 61.4), however this measure also varied substantially among individuals (SD = 40.1). Overall, most participants had not received formal singing training, except for two participants - one reported one month of training, and the other reported three years. Regarding instrumental training, seven participants had no prior experience, while the others had received training ranging from one to 15 years. Instruments included both Western instruments (e.g., piano, guitar, cello) and traditional Chinese instruments such as pipa, bamboo flute, and gourd flute.
Our exploratory analyses examined whether individual musicianship relates to the acoustic differences between singing and speaking. Figure 8 illustrates the correlation between effect sizes in acoustic features and Musicianship (both self-perceived and complimented by others). There were positive associations between effect sizes and Musicianship (self-perceived), although the effect sizes were quite variable (Pitch Height: r = 0.41; Temporal Rate: r = 0.06; Pitch Stability: r = 0.33). Musicianship (complimented by others) was also positively correlated with effect sizes in Temporal rate (r = 0.07) and Pitch Stability (r = 0.23), but negatively correlated with effect sizes for Pitch Height (r = -0.08). Notably, given the small sample size (n = 20), large variability shown in Figure 8, and the exploratory nature of analyses, these estimates remain tentative and are not conclusive.

Figure 7 - Mean ratings (± standard error) of five variables: Song Familiarity, Musicianship (self-perceived), Musicianship (complimented), Song Liking, Singing Regularity.

Figure 8 - Scatter plots showing the correlation between effect sizes and Musicianship, in terms of self-perceived (left) and complimented by others (right) ratings. The red line represents the pitch height, blue line represents temporal rate, and green line represents pitch stability.
Discussion
The present study has provided evidence addressing the two questions raised in the Introduction: (1) Will acoustic patterns of singing and speaking in group settings align with findings in Ozaki et al. (2024)? (2) Is there any effect of musicianship on the differences between speech and song?
Our acoustic analyses examined three features and found that singing exhibits higher pitch height, slower temporal rate, and greater pitch stability than conversation, which are consistent with findings of Ozaki et al. (2024). Our results not only further confirmed the replicability and reliability of Ozaki et al. (2024)’s findings, but also generalized the conclusions to a more naturalistic group setting and a larger sample among native Mandarin speakers.
The effect sizes observed in our study were strikingly consistent with those reported by Ozaki et al. (2024), all falling within roughly 25% above or below their estimates. Nevertheless, there were some small differences worthy of discussion. First, the effect size for pitch height in the current study is approximately 0.75 times smaller than that reported by Ozaki et al. (2024), which may be linked with differences in participant backgrounds and experimental procedures. According to Ozaki et al. (2024), 28 out of the 75 coauthors had known the hypothesis, which means they may anticipate the expected outcomes and slightly influence the results, although Ozaki et al. (2024) conducted a robustness check using data only from coauthors who had not known hypotheses and found that the effect size was nearly identical to the result including all coauthors, within difference less than 0.2. In contrast, participants in the current study were recruited without restrictions regarding academic background and were blind to the experimental aims, making them likely to produce more naturalistic singing and speaking. This may have led to a smaller difference in pitch height between singing and speaking compared to Ozaki et al. (2024).
Additionally, the experimental conditions differed between the two studies. Participants in the present study were asked to sing or converse immediately based on the provided lyrics and topics, without the opportunity to re-record. In contrast, the coauthors in Ozaki et al. (2024) s study were allowed to re-record repeatedly until they were satisfied with their voices. Taken together, these differences make it reasonable that the pitch-height gap between speech and song observed in the current study is smaller than that reported by Ozaki et al. (2024).
Secondly, the melody and tempo of the song itself may also influence the overall direction of the effect sizes. Interestingly, compared with two previous studies by Ozaki et al. (2024) and Hilton et al. (2022), the effect sizes in the present study exhibit a different pattern (Pitch height & Pitch stability: Ozaki et al. (2024) > current study > Hilton et al. (2022); Temporal rate: current study > Ozaki et al. (2024) > Hilton et al. (2022). Ozaki et al. (2024) compiled speech and song samples from 75 individuals, each performing different songs, and Hilton et al. (2022) collected recordings of infant- and adult-directed speech from 410 individuals across 21 societies. In contrast, all 20 participants in the present study sang the same song, which may have contributed to the larger effect size in tempo and the relatively high and stable pitch that aligned with the song’s melodic characteristics. The materials used in Ozaki et al. (2024)‘s and Hilton et al. (2022)’s studies largely eliminated the influence of specific songs on the results. Future cross-cultural research could further investigate how song choice modulates these effect sizes.
Thirdly, given that the experiments were conducted in group contexts, the influence of social interaction may not be negligible. Previous studies have shown that individuals tend to adjust their vocal parameters in conversation in response to factors such as perceived social status (Leongómez et al., 2017), dominance (Tusing & Dillard, 2000), hostility (Bailey et al., 2011), or attractiveness (Collins, 2000). Such adaptations may lead individuals to modify their acoustic parameters during interaction, potentially contributing to differences in effect sizes for solo versus group data collection. Future study is expected to examine the extent to which these social interactions influence the discrepancies between speech and song when comparing group settings with individual settings.
Our second question investigated how musicianship may relate to the acoustic differences between speech and song. This exploration was motivated by the differences in participants’ musical experience between our study and Ozaki et al. (2024). Prior to the present work, Ozaki et al. (2024) compared their effect sizes with those reported in another cross-cultural study by Hilton et al. (2022), which examined the acoustic differences between infant-directed and adult-directed speech and song. Ozaki et al. (2024) exhibited larger effect sizes for both pitch height and pitch stability than Hilton et al. (2022)’s study. One potential explanation illustrated by Ozaki et al. (2024) was that their participants had received more extensive musical training compared to the general population sampled by Hilton et al. (2022). Similarly, in our study, the effect sizes for pitch height and pitch stability were smaller than those reported by Ozaki et al. (2024), and our recordings were also mostly collected from international Chinese students at University of Auckland, most of whom had little formal musical training.
To further examine the potential influence of musicianship, we collected participants’ musicianship background and examined its correlation with effect sizes across the three acoustic features. Results showed that musicianship was mostly positively correlated with effect sizes (though effect sizes were quite variable), suggesting that individuals who perceived themselves as musicians or who had received compliments about their musical talent tended to produce more differentiated speech and song, with larger effect sizes. However, the two musicianship indicators showed divergent bivariate correlations with the pitch-height effect size: musicianship (self-perceived) positively correlated with Cohen’s D, whereas musicianship (complimented by others) exhibited a negative correlation. One possible explanation is that, although these two indicators are closely related and capture overlapping aspects of musician identity, the “complimented” measure showed a higher overall mean than the self-perceived measure. Differences in scale properties and distribution between the two measures may therefore contribute to the observed divergence in their bivariate associations with the pitch-height effect size, or the apparent divergence might simply reflect normal variation in the small sample. Overall, these exploratory analyses provide preliminary indications that musicianship may influence the acoustic differentiation of speech and song. However, given the small sample size, this evidence remains inconclusive.
Conclusion
The present study examined acoustic patterns in singing and conversation across three acoustic features (pitch height, temporal rate, pitch stability). Our findings confirmed the replicability of Ozaki et al. (2024)’s conclusions, and successfully generalized Ozaki et al.’s findings to group settings and Mandarin participants without restrictions on musical and academic backgrounds. The exploratory analyses also suggested that individuals’ musicianship may affect acoustic differences between speech and song. Overall, this study demonstrates the feasibility of investigating speech and song under naturalistic contexts and highlights the importance of naturalistic investigations. Our team will continue to collect data from up to 25 additional languages/sites to report these results in Stage 2 Registered Reports, and ultimately conduct a meta-analysis combining all datasets to examine the acoustic differences between speech and song in a larger and more representative global sample of the general population.
Appendix: Video tutorials
-
The video used by Ozaki et al. (2024) showing how to align onsets based on perceptual centers (“P-centers”) is available here: https://drive.google.com/file/d/1YOiobvoxaM4txdAJDVeLjc--oNLiBb5n/view
-
A video tutorial showing how to use the free software Praat (Boersma & Weenink, 2025) to segment acoustic units (e.g., syllables/notes) from a pilot experiment recording containing multiple participants singing/conversing is available here: https://drive.google.com/file/d/1Nz4h-JSk1d3Z_NNiXN1UEpv3TVTBefdx/view?usp=sharing.
-
A text version of the Praat tutorial follows:
A Tutorial for Doing Annotation in Praat
-
Download and install Praat if you haven’t already. https://www.fon.hum.uva.nl/praat/
-
Prepare your audio recordings in a folder. Make sure your audio files are in .wav format.
-
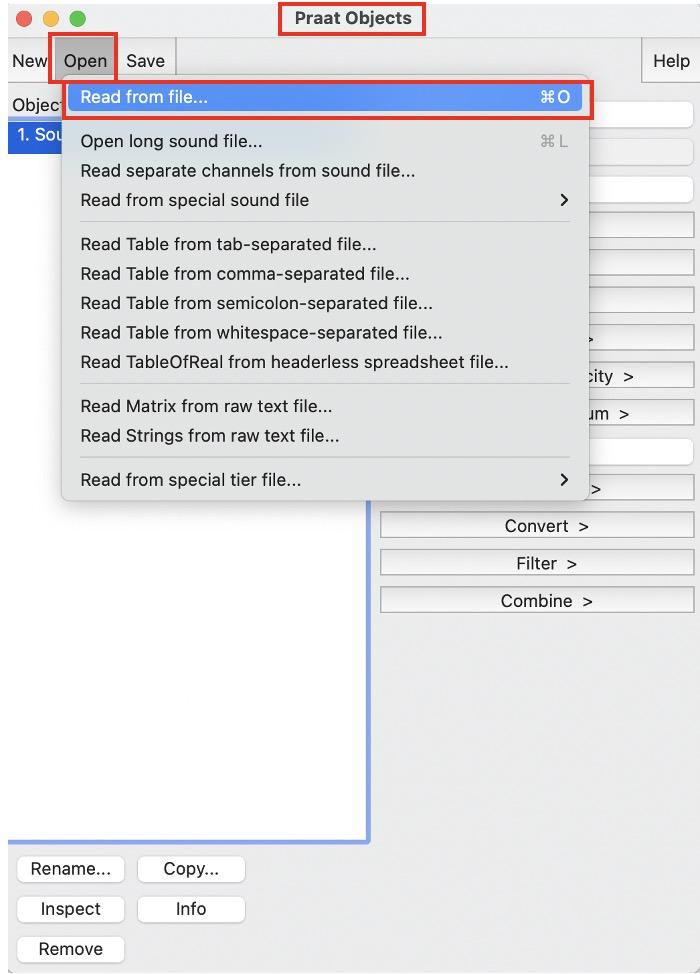
Open the audio recording you want to process: In Praat, go to Praat Object > Open > Read from file… , then select the file you want to work with.
-
Create a TextGrid for the corresponding audio file to make annotations: In the Objects window, select the audio file, then go to Annotate > To TextGrid…

-
Then a small window called Sound: To TextGrid will appear. Clear all the default settings.In the All tier names: field, enter syllable speaker (if it is a song file, then enter note speaker), then click OK. (A detailed explanation: We need to annotate two tiers: the first tier for syllables/notes, and the second tier for speakers. The logic for All tiers names is as follows: from left to right, list the first tier name, the second tier name, and then the third tier name…. separated by spaces. You are free to choose different tier names if you prefer; the tier names themselves do not affect data processing. They mainly serve as a guide to remind annotators what type of information should be labeled in each tier. Since we do not need to annotate any points, leave the point tiers empty.)

-
Now you have got a Sound file and a corresponding TextGrid file. Select both files, and click View & Edit.

-
Then the visualisation of combined sound and textgrid files appear. From top to bottom, you will see: the menu bar, typing area, waveform, spectrogram, TextGrid (tier 1 + tier 2), and time information. (In the blue box at the bottom left corner below, “all” means to display the entire audio file within the window, “in” means to zoom in, “out” means to zoom out, and “sel” means to display only the selected regions. You can use these buttons together with the scrollbar on the right to adjust the view and select the appropriate region for annotation.)

-
Add a boundary: If you want to add a boundary, click on the waveform or spectrogram area at the position where you want the boundary to be. (Do not click on the TextGrid area; clicking there is for adding or editing text labels.)
After clicking, a thick grey line will appear. Click the small circle ⭕️ on top of the grey line (clicking on the grey line itself won’t work).
When the grey line turns blue, it means the boundary has been successfully added.
-
Add annotation text: In the TextGrid area, select the region between two boundaries, and then type the text you want to add in the typing area. (Since we ultimately need to know the duration of individual syllables or notes for different speakers, and also extract the complete speech segments for each speaker, it’s important to annotate speaker information. We recommend labeling based on Participant ID, e.g., 1, 2, 3,..., up to 10.)

-
Save the TextGrid file: After completing all annotations, go back to the Praat Objects window, select the TextGrid file, and choose Save > Save as text file....

Acknowledgments
We thank all coauthors of the Stage 1 Programmatic Registered Report protocol this study is based on Savage et al. (2025b), as well as the previous coauthors of Ozaki et al. (2024) and Savage et al. (2025a) for discussion of ideas leading to this protocol. We also thank Chris Chambers and Rachael Shaw for discussion regarding Peer Community In Registered Reports’ Programmatic format. We thank all 12 Peer Community In Registered Reports reviewers and recommenders who helped improve this protocol (Corina Logan, Nai Ding, Fermin Moscoso del Prado Martin, and Makiko Sadakata) and the two previous protocols that it combines (Chris Chambers, Nai Ding, and Bob Slevc for Ozaki et al. (2024), Katherine Moore, Melissa Brandon, Erin Hannon, Manuela Maria Marin and Anja Göritz for Savage et al. (2025a)). Their reviews and editorial recommendations are publicly available at (Chambers, 2023; Moore, 2025). We also thank Yuto Ozaki for providing valuable feedback on both the coding and the writing. Preprint version 3 of this article has been peer-reviewed and recommended by Peer Community in Registered Reports: https://doi.org/10.24072/pci.rr.101216 (Logan, 2026)
Funding
This work is supported by funding from the New Zealand government as follows:
Marsden Fast-Start Grant from the Royal Society Te Apārangi (MFP-UOA2236)
Rutherford Discovery Fellowship from the Royal Society Te Apārangi (RDF-UOA2202)
The funders have/had no role in study design, data collection and analysis, decision to publish or preparation of the manuscript.
Ethics information
All participants gave informed consent as approved by the University of Auckland Human Participants Ethics Committee (Reference Number UAHPEC29144).
Data, scripts, code, and supplementary information availability
Audio recording data are from the “Mandarin Auckland" folder of the Open Science Framework (OSF) repository for Savage et al. (2025a): https://doi.org/10.17605/OSF.IO/E4PQV
Scripts, analysis data, code, and supplementary materials are available on Zenodo (Jia et al., 2026): https://doi.org/10.5281/zenodo.19124631.
Author contribution
Author contributions for this Stage 2 Registered Report (see Stage 1 Programmatic Registered Report protocol (Savage et al., 2025b) for other author contributions to the broader project):
Conceptualisation: Savage, Jia, Purdy
Investigation: Jia
Analysis: Jia
Data collection: Jia
Writing (Stage 2 [Results/Discussion]): Jia
Writing (Stage 1 protocol [Introduction/Methods]): Savage, Jia
Writing (editing): Purdy
Project administration/supervision: Savage, Purdy
Funding acquisition: Savage, Purdy
Conflicts of interest
The authors declare no financial conflicts of interest. Savage is a Recommender at Peer Community In Registered Reports.