
 CC-BY 4.0
Introduction
Since the mid-20th century, pesticides have become of common use in agriculture and their effects on both the environment and human health are a growing concern. For example, systemic pesticides are known to affect a broad range of organisms, from invertebrates, both terrestrial and aquatic, to amphibians or birds (Humann-Guilleminot et al., 2019; Mahmood et al., 2016; Yang et al., 2008), thereby questioning the sustainability of agroecosystem functioning and related services (Geiger et al., 2010; Deguines et al., 2014; Dudley et al., 2017; Furlan et al., 2018). Pesticides are also identified as a concern for human health, with numerous pesticide poisonings reported across developing countries (Boedeker et al., 2020) and recent evidence of relationships between diseases such as Parkinson’s or cancers and exposure to organophosphate insecticides (Sheahan et al., 2017; Tassin de Montaigu and Goulson, 2020).
The effect of pesticides on biodiversity are usually demonstrated with a focus on a single substance or a limited set of substances in general (e.g. thiamethoxam, clothianidin, imidacloprid, thiacloprid or glyphosate (Busse et al., 2001; Botías et al., 2015; Rundlöf et al., 2015; Van Bruggen et al., 2018). Yet, wild organisms are exposed to complex mixtures (Dudley et al., 2017), owing to the diversity of substances available and used in farmlands. Hence, studying substance mixtures is considered a central task for environmental risk assessment (Lydy et al., 2004), notably because the effects of pesticide cocktails can strongly exceed the additive effects of single compounds (Junghans et al., 2006; Bopp et al., 2016). Laboratory experiments demonstrate synergetic interactions among substances within mixtures, affecting the effect of the cocktails in non-additive ways (Cedergreen, 2014; Heys et al., 2016; Hernández et al., 2017). While the importance of studying the effects of cocktails beyond those of single substances was highlighted as soon as the late sixties (Keplinger & Deichmann, 1967), and their evaluation is mandatory in the European Union since 2009 (EC No 1107/2009), few attempts to do so exist outside laboratories (Gibbons et al., 2015).
Studies examining the effects of substance cocktails use two approaches: bottom-up or top-down (Relyea, 2009; Altenburger et al., 2013; Hernández et al., 2017). The bottom-up approach aims at testing all possible mixture compositions, starting from pairs of substances to more complex combinations. This method makes it challenging to consider more than a handful of substances. For example, ten substances represent 45 possible pairs and over a thousand possible combinations of three or more substances (Lydy et al., 2004). Moreover, such approach might be more suited to experiments in controlled rather than natural environments, as the latter are recognized as strongly contaminated (Tang et al., 2021), making the control of mixture composition difficult. The top-down approach proposes to compare the effect of cocktails, starting from potentially frequent mixtures including a high number of substances, but at the cost of not testing all combinations. In addition, the few existing field studies generally focused on the effects of pesticide cocktails composed of a restricted number of substances, on specific crops or on restricted spatial extent, thereby limiting a broad understanding of cocktail effects (e.g. Brittain et al., 2010; Hallmann et al., 2014; Millot et al., 2017, but see Schreiner et al., 2016 & (Fritsch et al., 2022). The top-down approach makes it critical to identify relevant mixture compositions, i.e. those actually occurring in the fields. The number of actual mixtures encountered in agroecosystems should be much lower than the number of possible combinations of substances because each substance is often intended for a limited set of crops only and because agricultural production is regionally specialised on particular crops. Such regional specialisation implies that existing mixtures are likely to be spatially structured. However, we still miss an overall picture of the pesticide mixture composition and its spatial structure over large spatial extents.
Here, we introduce a new statistical method to identify relevant pesticide mixtures, i.e. actual combinations of substances potentially co-occurring in agroecosystems, across Metropolitan France. We overcame the general problem of limited availability of data on temporal and spatial use of pesticides (Navarro et al., 2021) by taking advantage of the recent publication of an up-to-date database on pesticide purchases in France, the French national bank of pesticide sales database (https://www.data.gouv.fr/fr/datasets/ventes-de-pesticides-par-departement/). This database has registered mandatory reporting of quantities of active substances purchased in France since 2013 (law n°2006-1772) at a relatively fine spatial grain (postcode of the buyer). France is also the seventh largest user of pesticides in the world (FAO 2020) and has a wide range of agricultural types (Urruty et al., 2016), which makes it a well-suited case country to identify pesticide mixtures encountered in the field by wild organisms, as well as their spatial variation.
Applying an Expectation/Maximization algorithm to a model-based clustering, we aimed to cluster French postcodes on the basis of their composition of active substances purchased. We addressed three main questions: 1) How many groups of postcodes best describe the patterns of pesticide purchase in France? 2) How are these groups spatially distributed? 3) What are the mixtures of active substances characterizing these groups? Because pesticide use is at least partially related to crop identity, and because of crop regional specialization in France, we expect a limited number of postcode groups, that are strongly structured in space. Such groups with homogeneous pesticide mixtures could subsequently be used to identify potentially important pesticide substances and mixtures deserving further investigation.
Methods
Pesticide data
Data on active substances were obtained from the French national bank of pesticide sales (BNV-d; https://ventes-produits-phytopharmaceutiques.eaufrance.fr/). The BNV-d database registers active substances under mandatory reporting. The seller indicates the amount of each active substance purchased and the postcode of the buyer in the database. This database thus indicates the quantity of active substances purchased at the spatial resolution of the postcode of the buyer. Postcode are the third level of administrative division in France, lower than the European Union NUTS3 level (administrative departments) and range from 0.17 km² to 614.39 km² in metropolitan France (median = 62.79 km², Q1 = 19.59 km², Q3 =140.36 km²). Substances are identified with their generic name and a unique identifier, the Chemical Abstracts Service number. We modified generic names when synonyms were found. We only retained substances with a license fee (i.e. under compulsory reporting) because we can expect thorough reporting for these.
The years registered in the database ranged from 2013 to 2020. We discarded the year 2013 because of incomplete data during the first reporting year, and the two latest years of the time series (2019 and 2020) because additions and changes in the database are allowed for two years after reporting. Also, note that the legislation has kept changing until 2016, with consequences for the mandatory nature of reporting for some substances or treatments. In particular, until 2016 the geographical information associated with seed coating substances was that of the seed coating company, not of the buyer. Hence, 2017 can be considered the most accurate and thorough year within the period 2013-2020.
The data provides the total mass (in g) bought per substance with mandatory reporting, of which in 2017 there were 279. We analysed these quantitative data at the postcode level, assuming that substances purchased in a given postcode would be used within the same postcode or in close vicinity. Given the spatial extent of farms, pesticides may not always be spread exactly in the postcode where farmers are domiciled, but are unlikely to be used beyond the neighbouring postcodes, with one exception that we discarded. Using specific postcodes (CEDEX) that enable the identification of private companies, we discarded the data related to the national railroad company (SNCF): SNCF is a major buyer with central purchasing bodies that do not use the substances within the postcode of purchase. We converted all remaining CEDEX codes to their corresponding regular postcodes. We were thus left with 5,642 postcodes with information about the quantities (in g) of 279 active substances purchased in 2017. We classified these substances into fungicides, herbicides, insecticides following the Pesticide Properties Data Base (PPDB) (Lewis et al., 2016) and the European commission pesticide database (https://food.ec.europa.eu/plants/pesticides/eu-pesticides-database_en). There were also 32 substances with other target groups (e.g. rodents or molluscs; Table S1 for a complete list) that we classified as “other targets”.
To relate the use of active substances to the area of arable land in postcodes, we extracted the total area of cropland from the 2017 French Land Parcel Identification System (LPIS, “Registre Parcellaire Graphique”, Agence de Services et de Paiements, 2015). This database is a geographic information system developed under the European Council Regulation No 153/2000, for which the farmers provide annual information about their fields and crop rotation. We grouped the 16 categories of cropland types used in LPIS into 11 sub-groups (Figure S9) (Cantelaube & Carles, 2010; Levavasseur et al., 2016). We summed the area of all types of cropland but meadows to obtain the total crop area per postcode.
Model-based Clustering
Input data
As described above, the dataset consisted of \(n\) (= 5,642) postcodes and \(p\) (=279) substances. For each postcode \(i\) (\(1 \leq i \leq n\)) and substance \(j\) (\(1 \leq j \leq p\)), we denoted by \(X_{ij}\) the presence/absence variable, which is 1 if substance \(j\) is bought in postcode \(i\) and 0 otherwise, and by \(Y_{ij}\) the log of the quantity of substance \(j\) bought in postcode \(i\) (when used) normalized with the cropland area of postcode \(i\):
-
\(Y_{ij} = log\left( \frac{quantity\ of\ substance\ j\ bought\ in\ postcode\ i}{cropland\ area\ of\ postcode\ i} \right)\)
(\(Y_{ij}\) is NA when substance j is not bought in postcode i).
Model
We aimed to provide a clustering of the postcodes according to the quantity of the various substances bought. Mixture models (McLahan and Peel, 2000) provide a classical framework to achieve such a clustering. To avoid any confusion with “pesticide mixtures” we will use “Model-based Clustering” when referring to the statistical “mixture models”. The model we consider assumes that the \(n\) postcodes are spread into \(K\) groups and that the respective use of the different substances depends on the group they belong to. Mixture models or model-based clustering precisely aim at recovering this unobserved group structure from the observed data.
Groups definition
We denoted by \(Z_{i}\) the group to which postcode \(i\) belongs. We assumed the \(Z_{i}\) are all independent and that each postcode \(i\) belongs to group \(k\) (\(1 \leq k \leq K\)) with respective proportions \(\pi_{k}\):
-
\(\pi_{k} = Pr\{ Z_{i} = k\}\)
Note that the \(\pi_{k}\)consists of only \(K - 1\) independent parameters, as they have to sum to 1 (\(\sum_{k = 1}^{K}\pi_{k} = 1\)).
Emission distribution
The model then describes the distribution of the observed data conditional on the group to which each postcode belongs. The distribution of the presence/quantity pair \((X_{ij},Y_{ij})\) is built in two stages: first, if postcode i belongs to group \(k\), substance \(j\) is used in the postcode with probability \(\gamma_{kj}\):
-
\(\gamma_{kj} = Pr\{ X_{ij} = 1|Z_{i} = k\},\)
then, if substance \(j\) is used in postcode i, its log-quantity is assumed to have a Gaussian distribution:
-
\((Y_{ij}|X_{ij} = 1,Z_{i} = k\mathcal{) \sim N(}\mu_{kj},\sigma_{kj}^{2})\)
with \(\mu_{kj}\) and \(\sigma_{kj}^{2}\) the mean and variance of the log-quantity of substance \(j\) used in a postcode from group \(k\), provided that the substance is bought in the postcode. In addition to the \((K - 1)\) proportions \(\pi_{k}\) and the \(K \times p\) probabilities \(\gamma_{jk}\), this model involves \(K \times p\) mean parameters \(\mu_{kj}\) and as many variance parameters \(\sigma_{kj}^{2}\). This makes a total of \(K - 1 + 3Kp\) parameters to be estimated.
Combining Equations (2) and (3), we defined the conditional distribution \(f_{jk}\) for substance \(j\) in a postcode from group \(k\):
-
\(f_{jk}(x_{ij},y_{ij}) = x_{ij}\gamma_{kj}\phi(y_{ij};\mu_{kj},\sigma_{kj}^{2}) + (1 - x_{ij})(1 - \gamma_{kj})\)
denoting by \(\phi( \cdot ;\mu,\sigma^{2})\) the probability density function of the Gaussian distribution \(\mathcal{N(}\mu,\sigma^{2})\).
To avoid over-parametrization, we also considered models with constrained variance, assuming either that the variance depends on the substance but not on the group: \(\sigma_{kj}^{2} \equiv \sigma_{j}^{2}\), or that the variance is the same for all substances in all groups: \(\sigma_{kj}^{2} \equiv \sigma^{2}\).
Inference
Model-based clustering belongs to incomplete-data models, which can deal with situations where part of the relevant information is missing. For the sake of brevity, we denoted by \(Y\) the set of observed variables (i.e. all the \((X_{ij},Y_{ij})\)) and by \(Z\) the set of unobserved variables (i.e. the \(Z_{i}\)). We further denoted by \(\theta\) the whole set of parameters to be estimated: \(\theta = (\{\pi_{k}\},\{\gamma_{kj}\},\{\mu_{kj}\},\{\sigma_{kj}^{2}\})\).
A classical way to estimate the set of parameters \(\theta\) is to maximize the log-likelihood of the data \(\log p(Y;\theta)\) with respect to the parameters. An important feature of incomplete-data models is that this log-likelihood is not easy to compute, and even harder to maximize, as its calculation requires integrating over the unobserved variable \(Z\). However, the so-called ’complete’ log-likelihood, which involves both the observed \(Y\) and the unobserved \(Z\), \(\log p(Y,Z;\theta)\) is often tractable.
Expectation-Maximization algorithm
The Expectation-maximization (EM) algorithm (Dempster et al., 1977) resorts to the complete log-likelihood to achieve maximum-likelihood inference for the parameters. More specifically, because \(\log p(Y,Z;\theta)\) cannot be evaluated (as \(Z\) is not observed), EM uses the conditional expectation of the complete likelihood given the observed data, namely \(\mathbb{E}\left\lbrack \log p(Y,Z;\theta)|Y;\theta \right\rbrack\), as an objective function, to be maximized with respect to \(\theta\).
The EM algorithm alternates the steps ’E’ (for expectation) and ’M’ (for maximization) until convergence. It can be shown that the likelihood of the data \(\log p(Y;\theta)\) increases after each EM step. The reader may refer to Dempster et al. (1977) or McLahan and Peel (2000) for a formal justification of the procedure.
E step
This step aimed at recovering the relevant information to evaluate the objective function. In the case of model-based clustering, the E steps only amounts to evaluating the conditional probability \(\tau_{ik}\) for the postcode \(i\) to belong to group \(k\) given the data observed for the postcode and the estimate of the parameter \(\theta_{ik}\) after iteration \(h - 1\):
-
\(\tau_{ik}^{(h - 1)} = Pr\{ Z_{i} = k|\{(X_{ij},Y_{ij})\}_{1 \leq j \leq p};\theta^{(h - 1)}\}\)
The calculation of \(\tau_{ik}\) simply resorts to Bayes formula. In the following, we drop the iteration superscript \((h)\) for the sake of clarity, and we use the notation \(\widehat{\theta}\) to indicate the current estimate. Because the substance are assumed to be independent, we get
-
\({\widehat{\tau}}_{ik} = {\widehat{\pi}}_{k}\prod_{j = 1}^{p}{\widehat{f}}_{jk}(x_{ij},y_{ij})/\left( \sum_{\mathcal{l} = 1}^{K}\widehat{\pi_{\mathcal{l}}}\prod_{j = 1}^{p}{\widehat{f}}_{j\mathcal{l}}(x_{ij},y_{ij}) \right).\)
M step
The M step updates the parameter estimate by maximizing \(\mathbb{E}\left\lbrack \log p(Y,Z;\theta)|Y;\theta^{(h - 1)} \right\rbrack\) with respect to \(\theta\). The objective function can be calculated using the conditional probabilities \(\tau_{ik}\)s
-
\(\mathbb{E}\left\lbrack \log p(Y,Z;\theta)|Y;\theta^{(h)} \right\rbrack = \sum_{i = 1}^{n}\sum_{k = 1}^{K}{\widehat{\tau}}_{ik}\left( \log\pi_{k} + \sum_{j = 1}^{p}\log f_{kj}(x_{ij},y_{ij}) \right).\)
The maximization of this function yields in close-form update formulas for all parameters. All estimates can be viewed as weighted versions of intuitive proportions, means or variance. Let us first define
-
\({\widehat{N}}_{k} = \sum_{i = 1}^{n}{\widehat{\tau}}_{ik},\ {\widehat{M}}_{kj} = \sum_{i = 1}^{n}{\widehat{\tau}}_{ik}x_{ij}.\)
\({\widehat{N}}_{k}\) is the current estimate of the number of entities belonging to group \(k\); \({\widehat{M}}_{kj}\) is the current estimate of the number of entities from group \(k\) where substance \(j\) is bought. For the proportions and probability of use, we get the following updates:
-
\({\widehat{\pi}}_{k} = {\widehat{N}}_{k}/n\ ,\ {\widehat{\gamma}}_{kj} = {\widehat{M}}_{kj}/{\widehat{N}}_{k}\).
For the quantitative part of the model, we get additionally:
-
\({\widehat{\mu}}_{kj} = \frac{1}{{\widehat{M}}_{jk}}\sum_{i = 1}^{n}{\widehat{\tau}}_{ik}x_{ij}y_{ij}\) \({\widehat{\sigma}}_{kj}^{2} = \left( \frac{1}{{\widehat{M}}_{jk}}\sum_{i = 1}^{n}{\widehat{\tau}}_{ik}x_{ij}y_{ij}^{2} \right) - \left( {\widehat{\mu}}_{k} \right)^{2}\ .\)
Similar estimates of \(\sigma_{j}^{2}\) and \(\sigma^{2}\) can be derived for the models with constrained variances.
Model selection
To select the number of groups K and to choose between the models with unconstrained and constrained variances, we used the Bayesian Information Criterion (BIC, Schwarz, 1978). We adopted the same form as in Fraley and Raftery [1999], that is:
-
\(BIC = logp(Y;\widehat{\theta}) - \frac{n}{2}log(\# independent\ parameters).\)
As indicated above, the number of independent parameters is:
• \(K - 1 + 3Kp\) with unconstrained variances \(\sigma_{jk}^{2}\),
• \(K - 1 + 2Kp + p\) with constant variance for each substance \(\sigma_{jk}^{2} \equiv \sigma_{j}^{2}\),
• \(K + 2Kp\) with constant variance \(\sigma_{jk}^{2} \equiv \sigma^{2}\).
Estimated parameters
The output of the model-based clustering yielded K groups with their corresponding estimated parameters, that is \({\widehat{\tau}}_{ik}\ ,{\widehat{\gamma}}_{kj}\ {,\ {\widehat{\mu}}_{kj},\ \widehat{\sigma}}_{kj}^{2}\), with \(k\) one of the K groups obtained, \(j\) an active substance and \(i\) a postcode. These estimated parameters gave information on groups of postcodes and substances bought per group.
\({\widehat{\tau}}_{ik}\)was the conditional probability that a postcode \(i\) belongs to each group \(k\) given the quantities of substances bought in the postcode. We used this probability to associate each postcode to its most probable group.
\({\widehat{\gamma}}_{kj}\ \)was the probability of a substance \(j\) to be used in a postcode of group \(k\). We used this probability to study the composition of active substances in each group \(k\).
\({\widehat{\mu}}_{kj}\) and \({\ \widehat{\sigma}}_{kj}^{2}\) were the estimated mean and variance of the log-quantity of substance \(j\) per square meter of cropland purchased in a postcode from group \(k\). These quantities were used to refine our understanding of the subtance composition of postcode groups.
Analyses on estimated parameters
Spatial structure of postcode groups
To characterise the spatial structure of postcode groups, we quantified the spatial spread of postcodes belonging to a same group via the area of the convex hull of the group. The convex hull of a group is the smallest convex set that contains all postcodes of the group. Regardless of their spatial aggregation, most groups contain a few scattered postcodes, such that the convex area of all groups generally contains most of France, making comparisons of the area irrelevant. To circumvent this difficulty, we merged all contiguous postcodes within a group into single polygons and retained only the largest polygons, representing 80% of the total area of a group. This eliminated the scattered postcodes outside the main core of postcodes within a group.
We also characterized the similarity among the K groups in terms of substance use via hierarchical clustering on distances between groups. To obtain a matrix of between-group distances, we used results from the model-based clustering and calculated a maximum-likelihood inference when two randomly chosen groups were merged (see method in 1.2). We repeated this step for each possible group pair. We thus obtained a matrix of between-group distances, characterized as differences in likelihood between clusterings. Using this matrix, we computed an agglomerative nesting clustering, using Ward criterion, implemented in the R package cluster (Maechler et al., 2019, R Core Team, 2021).
Searching for the drivers of the substance composition of groups
We tried to identify some of the possible drivers of the substance composition of groups using two complementary approaches. First, we tested whether the groups obtained with the model-based clustering, which by construction differ in terms of active substances purchased, also differed in terms of crop composition. To compare the proportion of area covered with different crops among groups, we performed a log-ratio analysis (LRA). This approach was implemented in the R package easyCODA (Greenacre, 2019, R Core Team 2021). Second, we used Mantel tests (Mantel & Valand 1970) to estimate the correlations between three distance matrices among postcode groups: distances in the composition of substances purchased in the group (see above), distances in crop composition, and geographic distances. We used a spearman method and used 9999 permutations, computed with the vegan package (Oksanen & Simpson, 2022)
Test of the temporal robustness of the model-based clustering
To test robustness of the results of the model-based clustering run on the pesticide purchase data from the year 2017 vs. a longer time period, we also run the clustering on BNV-d data over the period 2015 to 2018. To do so, we aggregated all purchase data from 2015 to 2018 and analysed these data in the same way as those from 2017. In the following, the groups obtained with the model-based clustering applied on the 2017 data (respectively 2015-2018 data) are referred to as the “2017 groups” (respectively the “2015-2018 groups”).
We used postcode probabilities to be in group \(k\) (i.e. \({\widehat{\tau}}_{ik}\)) to compare results from the two model-based clusterings, with the 2017 groups as a reference. We compared each 2017 group with all 2015-2018 groups by calculating the proportion of postcodes in each 2017 group that belong to each 2015-2018 group. We thus obtained a matrix with the percentage of postcodes from 2017 groups that were found in the various 2015-2018 groups (Gelbard et al., 2007).
Results
The model-based clustering yields a small number of groups of postcodes
The model-based clustering with unconstrained variances had the highest BIC and classified the 5,642 postcodes into 19 groups on the basis of 2017 purchase data for 279 active substances (Figure S2). Most postcodes were unambiguously attributed to a single of these groups, as shown by the bimodal distribution of the probability for a postcode i to belong to group \(k\), with most values close to 0 or 1 (Figure S3). Only 13 out of 5,642 postcodes had a maximum probability to be in a group lower than 0.7.
Most groups of postcodes identified by the model-based clustering were spatially aggregated, albeit of contrasting sizes (Figure 1). The number of postcodes per group ranged from 135 to 493 (median = 270, Q1 = 215.5, Q3 = 378.5), which translated into a cropland area per group ranging from 38.7 km2 to 24,184 km2 (median = 5,573.7 km2, Q1 = 1,547.55 km2, Q3 = 13,959 km2). The cropland area of groups was negatively related to the area of the convex envelop encompassing it, such that groups with the largest cropland area tended to be the most spatially clustered (Figure 2). Such a spatial clustering of postcodes purchasing similar pesticide substances was expected as agricultural practices are spatially structured (see below) but keep in mind that the model-based clustering did not incorporate spatial information.
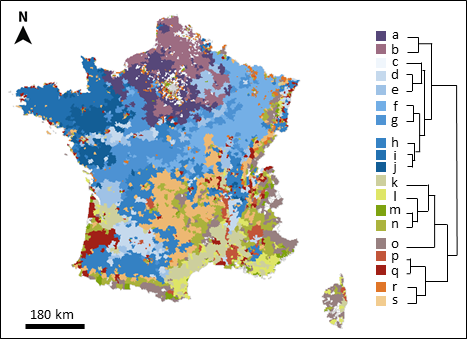
Figure 1 - Map of France split into postcode groups obtained from the model-based clustering on the basis of active substances purchased within postcodes in 2017. Postcodes within a group share the same colour. The dendrogram was obtained using an agglomerative hierarchical clustering.
Postcode groups corresponded to specific geographical and/or agricultural regions. For example, group i corresponded mostly to Brittany (the western peninsula) and group b was predominantly located in Northern France. Groups e and d were more scattered across the country but overlapped almost perfectly with wine regions (Figure 2). Note that a couple of groups were composed of a limited number of postcodes spatially scattered across France (e.g. groups m and o in Figure 2). In particular, group m represented less than 39 km2 of cropland and is generally discarded in the following.
The groups identified by the model-based clustering were relatively robust to a change in the temporal range of the data, as shown by the results of the clustering on the 2015-2018 data (Figure S7). This second clustering yielded 24 groups and the percentage of shared postcodes between the 2017 groups and their most similar 2015-2018 groups varied between 41% and 80% (median = 62%, Q1 = 53%, Q3 = 66%). For example, groups in Normandie (group a vs. group 15) or part of the Languedoc region (group k vs. 10) were stable over time (Figure S7). The higher number of groups obtained with the 2015-2018 model-based clustering (24 vs. 19) was often due to the split of some 2017 groups into two 2015-2018 groups. For example, for 2017 group i, there was 53% similarity with 2015-2018 group 16 and 40% similarity with group 20 (Figure S7). Because of this temporal consistency in the clustering, we only present in the following the analyses on the 2017 dataset, which is thought be more accurate (see 1.1).
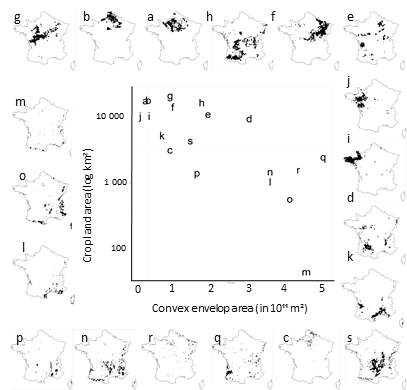
Figure 2 - Relationship between cropland area (log scale) and convex area, a proxy for spatial extent, of groups. The spatial distribution of each group is plotted around the relationship, with one map of France per group, in which postcodes forming each group are highlighted in black. Groups are ordered clockwise from top left in decreasing cropland area. Note that the focus on cropland area (not total area) in a postcode makes some groups with little cropland (e.g. mountain areas, q or m) appear with a relatively large black area on the maps, although they are ranked low in terms of cropland area.
Substance composition of postcode groups: core and discriminating substances
Postcode groups differed in terms of the composition of substances purchased (Figure 3), as expected from the clustering algorithm, but may also share common substances. Group composition was inferred, and can be characterised by, (1) the probability of a substance to be purchased in a postcode from a given group (\({\widehat{\gamma}}_{kj}\)), and, if the substance is purchased, (2) the estimated mean quantity purchased (\(\ {\widehat{\mu}}_{kj}\)) as well as (3) the estimated variance in the latter quantity (\(\sigma_{jk}^{2}\)). In the following, for the sake of simplicity, we chose to focus on the probability of substances to be purchased, knowing that this probability was positively related with the estimated mean quantity (Figure S4 and Figure S6, r = 0.2) and negatively related with the estimated variance (Figure S4, r = -0.07). For a given substance, this probability can also vary substantially across groups, and we used this variability to distinguish two main types of substances with interest for the definition of postcode groups and for the identification of relevant pesticide mixtures : core substances and discriminating substances (Figure 4).
Core substances, defined as substances with a high average and low variance of probability to be purchased across groups, were by definition found in most groups; they were widespread molecules that were likely to form the backbone of mixtures encountered by living organisms in farmland. Using an arbitrary threshold value of mean purchase probability of 0.85, we found 12 such core substances with high probabilities (Figure 3 and Figure S5): two pyrethroid insecticides (deltamethrin, lambda-cyhalothrin), six herbicides of different chemical families (glyphosate, diflufenicanil, fluroxypyr, MCPA, 2,4-d, triclopyr) and four fungicides (fludioxonil, tebuconazole, difenoconazole and thiram). Because they were found with high probability in most groups, these substances were unlikely to weight strongly in the definition of postcode groups, although they can contribute via differences in the mean quantities used across groups. For example, the average estimated amount of glyphosate purchased ranged from 19 to 928 kg/ m2 of cropland (median = 44, Q1 = 38, Q3 = 35) among groups.
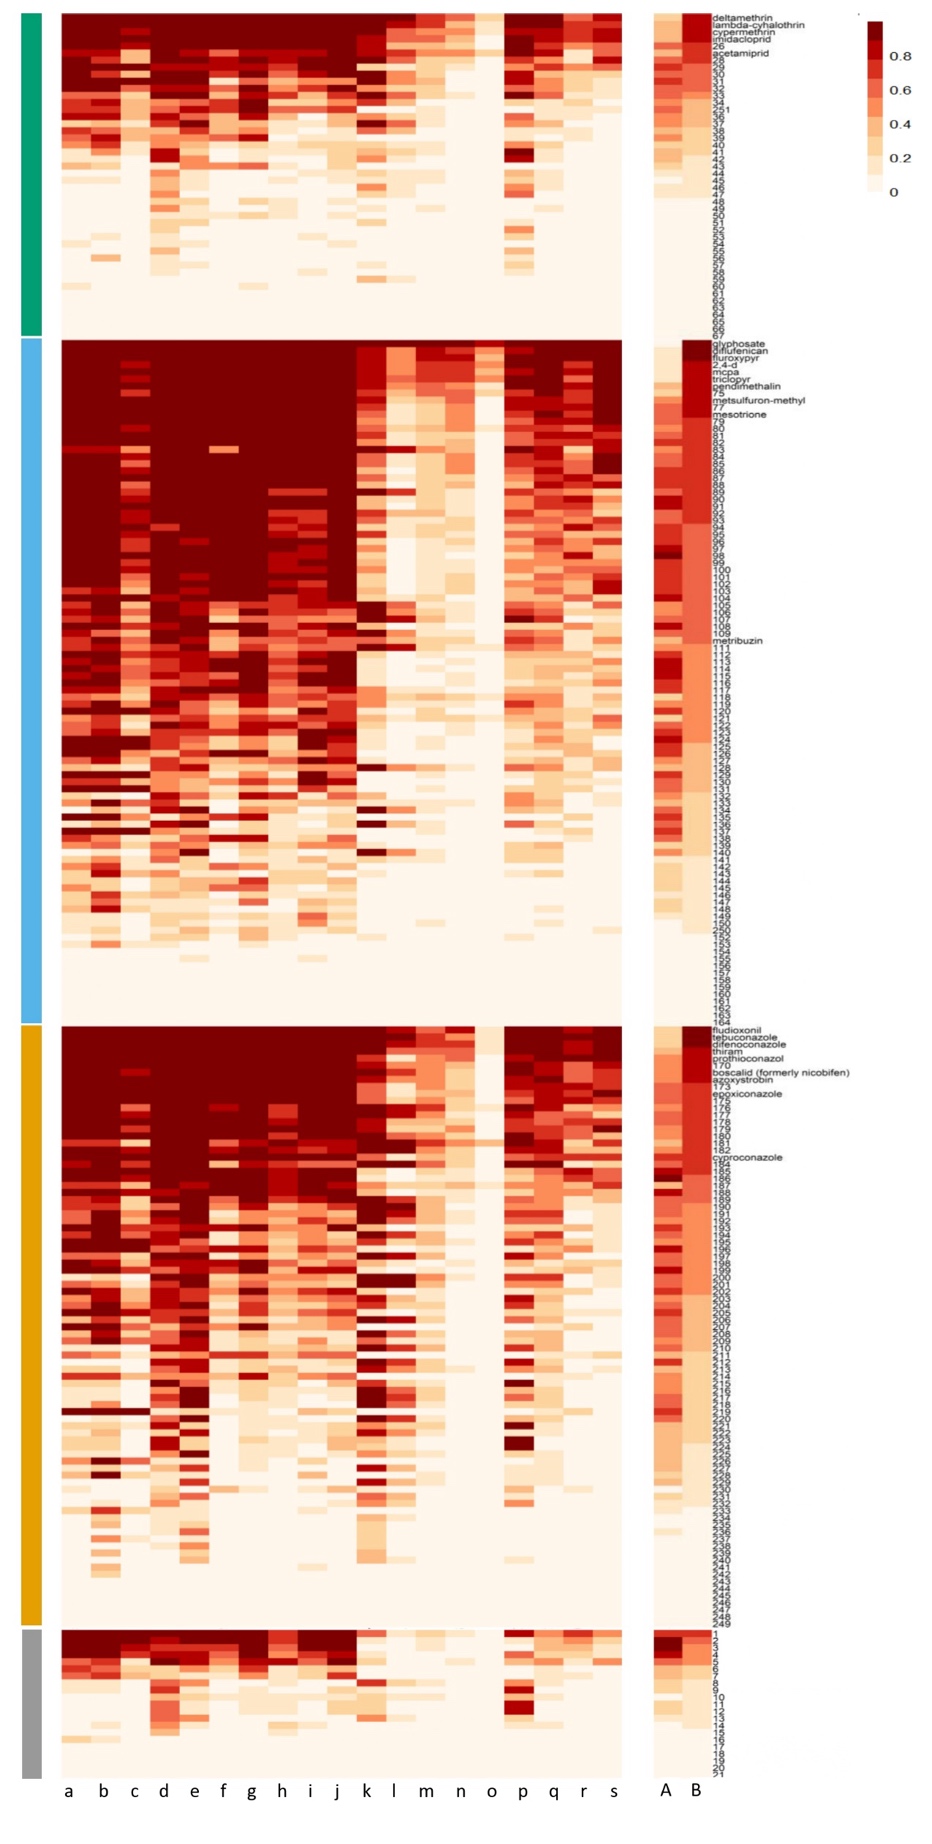
Figure 3 - Heatmap of the probability γkj in each group, in each of four categories of substances: insecticides (green), herbicides (blue), fungicides (orange), other targets (grey). Within each category, substances are ordered in increasing average probabilities of use across groups. For readability, substance names are not displayed and can be found in Figure S8. On the right of the figure, column A corresponds to the mean probability of use and column B corresponds to the scaled (0,1) variance in probability of use across groups.
Discriminating substances are defined as substances with medium to high mean probability of purchase, mechanically associated with a large variance across groups in this probability (Figure S5). Because of their contrasting probability of purchase across groups, discriminating substances were likely to contribute greatly to the formation of groups. We used the arbitrary range of average probabilities from 0.5 to 0.85 to define discriminating substances. Using these thresholds, we found a set of 84 discriminating substances, including 45 herbicides, 25 fungicides, 10 insecticides and 4 with other targets (Supplementary information 2). In the following, we focus on discriminating substances that are highly probable (\({\widehat{\gamma}}_{kj} > 0.85\)) in at least one postcode group, i.e. substances that are likely major components of pesticide mixtures occurring in a given group. We found seven widespread discriminating substances purchased with a probability higher than 0.85 in at least 12 out of 19 groups: azoxystrobin, boscalid, cypermethrin, mesotrione, metsulfuron-methyl, pendimethalin and prothioconazole. These substances are very close to core substances. Conversely, four substances were highly specific, being purchased with high probability (> 0.85) in less than four groups (e.g. metribuzin in groups d and b). Within a group, the number of discriminating substances with high probability of purchase (> 0.85) varied strongly among groups, from 2 for group r to 80 for group g (mean = 43 ± 27). This cross-group variation in the number of highly probable discriminating substances has implication for the composition and complexity of pesticide mixtures in French agroecosystems: from relatively “simple” (12 core substances and 11 discriminating substances in group q) to highly complex (12 core substances and 74 discriminating substances in group g).
The 156 remaining substances, with a low average probability to be purchased (< 0.5), also had a role in group identification, but were seldom purchased and will not be described further (Figure 3).
Postcode groups differ in terms of crop composition, but active substance purchase may not be solely driven by crop identity
Groups of postcodes, which by construction are composed of different mixtures of substances, also differed in terms of proportions of cropland grown with various crops, such that groups with close pesticide composition sometimes, but not always, also exhibited similar crop usage (Figure 4). The possible relations between pesticide composition and crop composition can be visualized either on Figure 4, where crop composition of groups similar in terms of pesticides purchases are plotted next to each other, or on the biplot of the log ratio analysis (Figure 4B), in which groups with similar crop composition are plotted next to each other.
For example, groups k and l, characterized by a large proportion of vineyards, were close to each other both in the log-ratio analysis, which is indicative of similar crop compositions (Figure 4) and in the hierarchical clustering, which is indicative of similar pesticide purchases (Figure 4). The same was true for groups b, c and i, and, to a lesser extent, a, characterized by an appreciable proposition of crops from the legume/flower category. However, some groups such as h and g were different in terms of substances (not in the same sub-group, Figure 4) while exhibiting comparable proportions of crop types (Figure 4). Alternatively, some groups that were closely related in terms of substance purchases, such as groups i and h, could be characterized by dissimilar crop compositions. The latter patterns may suggest regionalisation of substance use, such that neighbouring regions tend to use similar products or substances even with variations in crops grown (e.g. i and h).
Despite the abovementioned associations between crop composition and active substance compositions of groups, we found no significant correlation between distance matrices: the distance in substance composition among groups was not correlated with the distance in crop composition, although the relationship was marginally significant (Mantel test, ρ = 0.13, P = 0.057). Neither did we found a correlation between the geographic distance and active substance composition of groups (Mantel test, ρ = -0.01, P = 0.53) indicating that adjacent postcode groups do not necessarily exhibit similar composition of active substances adjacent.
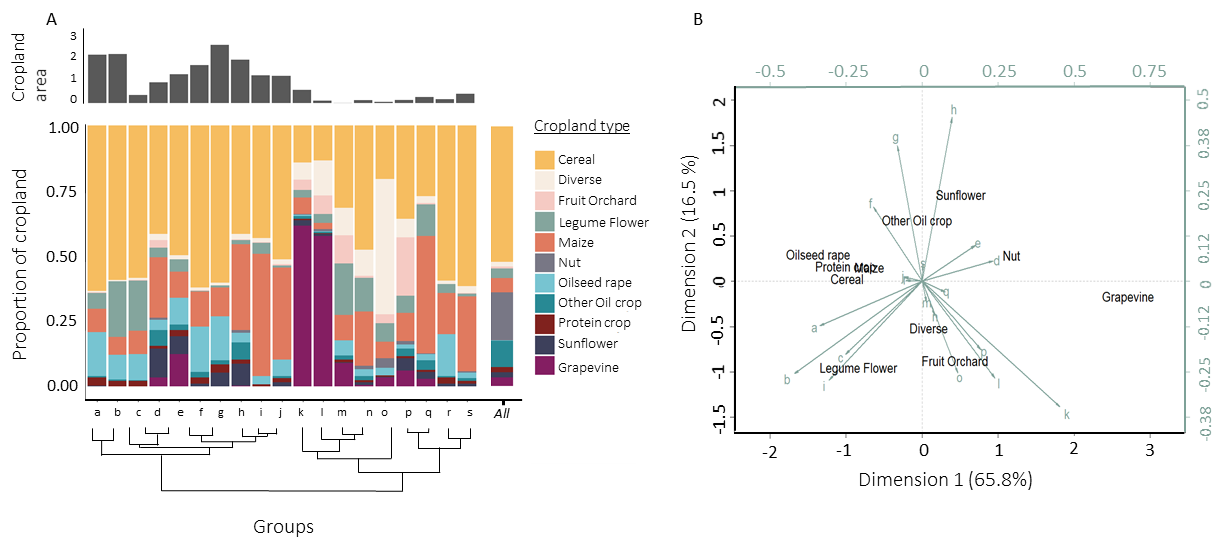
Figure 4 - A. Distribution of crop type area across groups. The top grey histogram shows the distribution of total cropland area across groups (in 104 km²). The dendrogram was obtained using an agglomerative hierarchical clustering on the basis of Ward’s method among groups (see 1.3.2). B. Biplot of the log ratio analysis relating the proportion of crop types in each group. Only groups identified as spatially coherent are displayed (see 1.3.1). For readability, the groups and crop types are displayed on two different scales: black for crop types, green for groups. The size of arrows corresponds to the contribution of each group. Groups that appear close to each other on the biplot have similar crop composition, which can be inferred from the contribution of each crop type to the axes.
Discussion
A major challenge in pesticide risks assessment is to characterise mixtures of pesticides used in the field (Lydy et al., 2004), partly because of the large number of substances used but also because of the limited information on the combinations of substances contaminating the environment. Here, we developed a methodology to analyse a newly available database on pesticide purchases across France. It aimed to identify groups of postcodes with similar compositions of pesticide purchases and characterise their spatial structure, two critical pieces of information to unravel the composition of pesticide mixtures. Our method resulted in the clustering of the 5,642 French postcodes into a relatively low number of groups. These groups represent as many potential pesticide mixtures, which is much lower than the possible combinations among the 279 substances included in the data. In the following, we discuss how our findings can help understand the impacts of pesticides in the environment (e.g. by identifying relevant pesticide mixtures), how this approach can be improved in the future, and the possible mechanisms underlying the groups.
Significance of the identification of highly probable active substances, and of mixtures of active substances characteristic of postcode groups, for the study of the impacts of pesticides in the environment
The identification of active substances that are purchased with high probability in all (core substances) or a subset (discriminating substances) of postcode groups might contribute to reducing the potential street light effect, whereby most research efforts focus on molecules that are either easy to study (Hendrix, 2017) or that were popularized by previous studies (Tsvetkov & Zayed, 2021). Unsurprisingly, most core substances identified here are already well-known, widely-used substances. Glyphosate is the most widely used broad-spectrum herbicide (Jatinder Pal Kaur Gill et al. 2017; Myers et al. 2016), with associated concerns regarding pervasive direct and indirect effects (Van Bruggen et al., 2018). Tebuconazole and difenoconazole, two triazole fungicides, are widely used and studied (Zubrod et al., 2019). Deltamethrin and lambda-cyhalothrin, two pyrethroids impacting nervous systems (Soderlund & Bloomquist, 1989; Ray & Fry, 2006), are known to have adverse effects on a large range of non-target species such as fish, birds and amphibians (Ali et al. 2021). Yet, a preliminary literature search on these 12 core substances suggests that the research effort on their adverse effects on biodiversity is still highly variable. For core herbicides, a simple search of the molecule name together with “biodiversity” or “ecotoxicology” in the abstract of articles on ISI Web of Science yields more than two hundred research articles for glyphosate and around seventy for 2,4-d, but only 2 to 17 articles for diflufenican, fluroxypyr, MCPA, triclopyr and pendimethalin. For core insecticides, the same search returns ca. 40 articles for lambda-cyhalothrin and deltamethrin. The four core fungicides were no exception, with a number of research articles below ten for thiram, fludioxonil and difenoconazole and around thirty for tebuconazole. Ultimately, our method eases the bottom-up approach in the laboratory by providing a selection of understudied substances deserving further attention.
Studying all possible (combinations of) substances is prohibitive (Wolska et al., 2007); beyond the identification of single substances, our approach chiefly contributes to identifying combinations of active substances that are likely to be encountered in farmland environments, i.e. pesticide mixtures. The model-based clustering identified a relatively small number of postcode groups (19 to 24 depending on the temporal coverage of pesticide data). Each group is characterized by a specific combination of purchases of active substances and can be interpreted as a potential mixture of pesticides occurring in the location of the postcodes, under the assumption that all purchased substances are used within the buying area during the year of purchase (see “Limitations and perspectives” below). Among the 279 active substances considered in these analyses, we highlighted the core substances included in most mixtures and the discriminating substances specific to particular mixtures. Within each postcode group, both types of substances might be a good starting shortlist of substances within which one can investigate potential interactive effects on biodiversity. Indeed, these substances are purchased with high probability in at least some large groups of postcodes, hence are potentially part of widespread mixtures. Although this list is much shorter than the total list of authorized active substances, it still contains 12 core substances, plus 2 to 80 discriminating substances depending on the postcode group. Since our approach to identifying core and discriminating substances was based on probability of purchase only, this shortlist of substances could be narrowed down further by selecting active substances bought in large quantities (see also “Limitations and perspectives”) or with high toxicity. The appreciable number of core and discriminating substances composing mixtures is anyway consistent with surveys showing that active substances are rarely found alone in the environment (Silva et al., 2019). It also further substantiates the need for a broader assessment of the synergistic effects of pesticides on biodiversity, often completed on a limited set of substances only (Schreiner et al., 2016; Silva et al., 2019). For core substances, for example, some cocktail effects have already been studied but mostly on pairs of substances (Brodeur et al., 2014; Peluso et al., 2022) and more rarely for cocktails of three or more substances (Cedergreen, 2014; Glinski et al., 2018; Van Meter et al., 2018). Focusing on the reasonable number of relatively complex mixtures identified by the present approach would contribute to improve our understanding of the synergistic effects of realistic cocktails on organisms.
Limitations & perspectives
Limited spatio-temporal resolution of the BNV-d data
The first limitation of our study is associated with the BNV-d database, which provides information on quantity and year of pesticide purchase, as well as on the administrative location of the buyer, but not on the actual date and location of pesticide treatments, nor on the actual pesticide contamination of the various postcodes. For simplicity, we assumed that the pesticides were used in the year of purchase and in the postcode of purchase and that all substance are equally likely to contaminate the environment. These assumptions may not be verified under all circumstances because farmers are sometimes known to store some pesticide products despite their high prices, e.g. to anticipate increased taxes, and because farms are sometimes spread across several postcodes. Further, not all substances are equally likely to contaminate the environment, e.g. because they vary in terms of degradability or because weather conditions such as wind and rain can affect the way they contaminate the environment. The relationships between pesticide purchase and the ensuing environmental contamination will therefore need further investigation. Yet, there are a couple of indications that the assumption of immediate and local use of pesticides is generally correct. For example, our results are consistent with those of an extensive European study on soil contamination (Silva et al., 2019) which identified glyphosate and the fungicides boscalid, epoxiconazole, and tebuconazole as the most frequent and most abundant contaminants. These substances either belong to the core substances we identified (glyphosate and tebuconazole) or to discriminant substances (boscalid and epoxiconazole) with a high probability of being used over half of the postcode groups.
Although our estimation of pesticide mixture composition may be roughly correct at the resolution of a postcode and of a year, the actual use of pesticides in space and time varies at much finer scales than those of available data. Pesticide substances bought within a given postcode and year may be spread in contrasting fields and times and may not be found together in the environment, depending on their half-life and transport in the environment. The actual mixture composition of a site hence depends, among others, on the crop cover in the landscape and associated farming practices. In particular, the amount of organic farming within the identified postcode groups may affect local heterogeneity in the quantity and composition of substances used, although pesticides approved for organic farming were generally not part of our analysis and may add up to pesticides used for conventional farming. Downscaling the BNV-d database to the field scale is challenging (Ramalanjaona, 2020), but it might reveal other patterns than the ones we highlighted here, probably decreasing the number of substances that are part of local mixtures. Such fine-grained data on pesticides might be more relevant to assess the impact of pesticide contamination on biodiversity.
Going beyond the use of purchase probabilities and arbitrary thresholds to identify the substances of interest for risk assessment
The method we developed is continuous, with quantitative estimates of purchase probabilities, as well as mean and variance of quantities purchased per postcode group. Still, we used arbitrary thresholds to identify core and discriminating substances. The mixture compositions we highlighted here are thus dependent on the chosen thresholds. Depending on the question of interest, these thresholds can and should be adapted. For example, by changing the threshold to 0.80, there are nine more core substances, and among these substances there are, for example, imidacloprid and boscalid, both known for high use and effects on biodiversity (Yang et al., 2008; Lopez-Antia et al., 2015; Simon-Delso et al., 2017; Qian et al., 2018).
In addition, most of our interpretation of pesticide mixture composition relies on the estimated purchase probabilities, but these mixtures were also identified using information on the mean and variance of purchased amounts within postcodes, hence mixtures differ for these variables as well. For example, glyphosate, a core substance with high purchase probability in all postcode groups, was bought in contrasting quantities across postcode groups: the average amount was 53.9 kg/km2 and ranged from 7.8 kg/km2 in group p to 146 kg/km2 in group i. Although the purchase probability was positively correlated to the mean purchased quantity and negatively to its variance, the correlation is not strong, and further analysis is needed to fully uncover variation in substance quantities within the mixtures we identified.
Taking into account the yearly variation in pesticide use
Our analysis appeared relatively robust to the time period of the pesticide purchase data, as suggested by the comparison of postcode groups obtained with the 2017 and the 2015-2018 datasets. This strong correlation between the 2017 and the 2015-2018 analysis is not entirely surprising because of the presence of the 2017 data in both analyses. Yet, adding three years of data into the analysis did not affect much the composition of postcode groups, which suggests relatively stable patterns of pesticide purchase in France over a short time period. Nonetheless, we observed some differences, mainly due to the split of some groups, which were also expected due to climatic variation, changes in legislation on pesticide use (Urruty et al., 2016) or changes in crop areas (Levavasseur et al., 2016). A better integration of the temporal dynamics of pesticide purchases in the characterisation of pesticide mixtures is needed if we are to monitor pesticide mixtures across France. This can be achieved by applying the model-based clustering to each year of data separately. Investigating the spatial stability of groups and mixture compositions across years would contribute to either estimate annual mixtures or to find temporarily stable mixtures. Finding recurrent mixtures could facilitate risk assessment over years. Indeed, this could provide key information on the frequency of mixtures encountered by organisms as repeated contact might increase risks (Stuligross & Williams, 2021).
Postcode groups are related to the crop they grow, as well as to other regional factors, but the underlying mechanisms remain to be fully identified
Although no spatial information was included in the model-based clustering analysis, the postcode groups exhibited a strong spatial structure, in which most groups are strongly aggregated and only a few small groups are scattered across France. Such spatial structure was expected since pesticide use is strongly crop-dependent. For example, acetamiprid, a substance used to protect fruit trees or grapevine against aphids, is bought with high probability in groups l, e and d,with high proportion of fruit orchards and grapevines. Similarly, cyproconazole, a substance with a broader spectrum of use, is bought with high probability in several groups with contrasting crop compositions (a, b, e, f, g, h, j, k, l, n, o, q, r , Figure 4). However, deviations from this pattern were found: some adjacent postcode groups can have different sets of crops but similar substance purchases or some spatially distant postcode groups can have similar sets of crops but different substance purchases. This observation suggests that local conditions, such as climate or pests, or some regional patterns in the pesticide market and/or distribution, can drive the purchase of active substances more than the set of crops grown (Storck et al., 2017; Silva et al., 2019). Hence, the differences among postcode groups were related to a combination of crop identity effects and other regional effects that will need additional analysis to be identified. A straightforward perspective for the msodel-based clustering approach would thus be to incorporate environmental covariates in the model, and evaluate how clusters are modified.
Conclusion
This study shows that a reasonably low number of substance mixtures can be identified at the scale of France. Pursuing ecotoxicological studies on the synergistic effects of mixtures will make it possible to identify risks and better understand the effects of pesticides on organisms. The mapping of these pesticide mixtures enables the identification of regions under different regimes of pesticide contamination. This might be particularly useful to plan in situ tests for both pesticide contamination and effects on biodiversity. Here we did not investigate the effects of cocktails on wild organisms, and further work should be done on this aspect.
Acknowledgement
This project was funded and supported by ANSES (grant agreement 2019-CRB-03_PV19) via the tax on sales of plant protection products. The proceeds of this tax are assigned to ANSES to finance the establishment of the system for monitoring the adverse effects of plant protection products, called ‘phytopharmacovigilance’ (PPV), established by the French Act on the future of agriculture of 13 October 2014. We wish to thank the steering committee of the project: Fabrizio Botta, Sandrine Charles, Marc Girondot, Olivier Le Gall, Thomas Quintaine, and Lynda Saibi-Yedjer. Milena Cairo was supported by ANR project VITIBIRD (ANR-20-CE34-0008) while working on this project. This work also benefitted from the support of the project ECONET (ANR-18-CE02-0010) and of the “Chaire Modélisation Mathématique et Biodiversité”. Preprint version 2 of this article has been peer-reviewed and recommended by Peer Community In Ecotoxicology and Environmental Chemistry (https://doi.org/10.24072/pci.ecotoxenvchem.100102; Labadie, 2023)
Conflict of interest
The authors declare that they comply with the PCI rule of having no financial conflicts of interest in relation to the content of the article.
Data, scripts, and supplementary information availability
Data, script, and supplementary materials to this article can be found online at https://doi.org/10.5281/zenodo.7693149 (Cairo et al., 2023)