
 CC-BY 4.0
Introduction
The introduction of Geographical Information Systems (hereinafter GIS) has led to an improvement in the understanding and study of the historical-archaeological landscape. The tools provided by GIS allow us to analyse and search for patterns of continuity and modification of landscape transformations through anthropic activity (Casarotto et al., 2018). Similarly, the evolution and application of remote sensing systems in Archaeology has meant a great advance in being able to identify cropmarks on the surface of potential archaeological sites. Thanks to the use of LiDAR (Light Detection and Ranging) sensors, important discoveries have been made in the most recent research, such as the location of Prehistoric elements (Berggren et al., 2015; Cerrillo, 2017), Ancient structures (Grammer et al., 2017; Monterroso, 2017; García, 2018), as well as advances in the field of Medieval and Contemporary History (Opitz et al., 2015; Berrocal et al., 2017; Masini et al., 2018; Chase et al., 2020; Dolejš et al., 2020). Besides, the use of this tool has facilitated the understanding of the historical landscape and the changes that nature has undergone at the hands of man since antiquity (Nuninger et al., 2011; Fernández & Gutiérrez, 2016; Chase et al., 2017; Brogiolo & Sarabia, 2017; Georges-Leroy, 2020).
Furthermore, all these archaeological developments have been accompanied by an increase in research into the applications of new filters for Digital Terrain Models, with the aim of being able to better identify possible archaeological structures under the ground (Loisios et al., 2007; Chiba et al., 2008; Hesse, 2015; Zakšek et al., 2011; Štular et al., 2012; Novák, 2014; Kokalj & Hesse, 2017; Mayoral et al., 2017; Orengo & Petrie, 2018; Kaneta & Chiba, 2019). The approach presented in this paper consists in the development and comparison of a series of filters using the open-source software Relief Visualization Toolbox and SAGA for the detection of archaeological structures on the surface of Mesas del Esparragal archaeological site, located in the municipality of Alcalá de los Gazules (Cádiz, Spain).
Site location and History
Mesas del Esparragal is an archaeological site located about 7 kilometres west of the town of Alcalá de los Gazules (Cádiz, Spain) (Figure 1). The site in particular is associated with Phoenician and Roman culture, and this site can be identified with the Ancient Roman city of Lascuta, since it was in its surroundings where the so-called Lascuta Bronze was found in 1866 (López, 1994). This city is located in the epicentre of the conflict against the neighbouring city of Asta Regia, which led a revolt in 182 BC. However, there are other investigations that argue that the site does not correspond to the exact location of the Roman city of Lascuta, placing this city about 5 kilometres further away, in the so-called Cerro Redondo, as a consequence of the dismantling of the camp and the transfer of the population once the conflict was resolved (Martínez, 2012).
Archaeologically, there are known structures on the site which correspond to a Visigoth tower (Figure 2), although both its foundations and the lintel could correspond to a properly Roman elaboration (Montero, 2013). According to Montero (2013), this type of building would serve to control the territory, which had access to salt mines, among other things, an ingredient of a great importance for this ancient period.
We can understand the strategic importance of the land through the successive aerial images taken of the area. Likewise, with the achievement of the different flight campaigns, it is possible to appreciate the conditions in which the territory has been left because of the anthropic activity in the ground, first for the use of crops and later for the planting of ash trees (Figure 3).
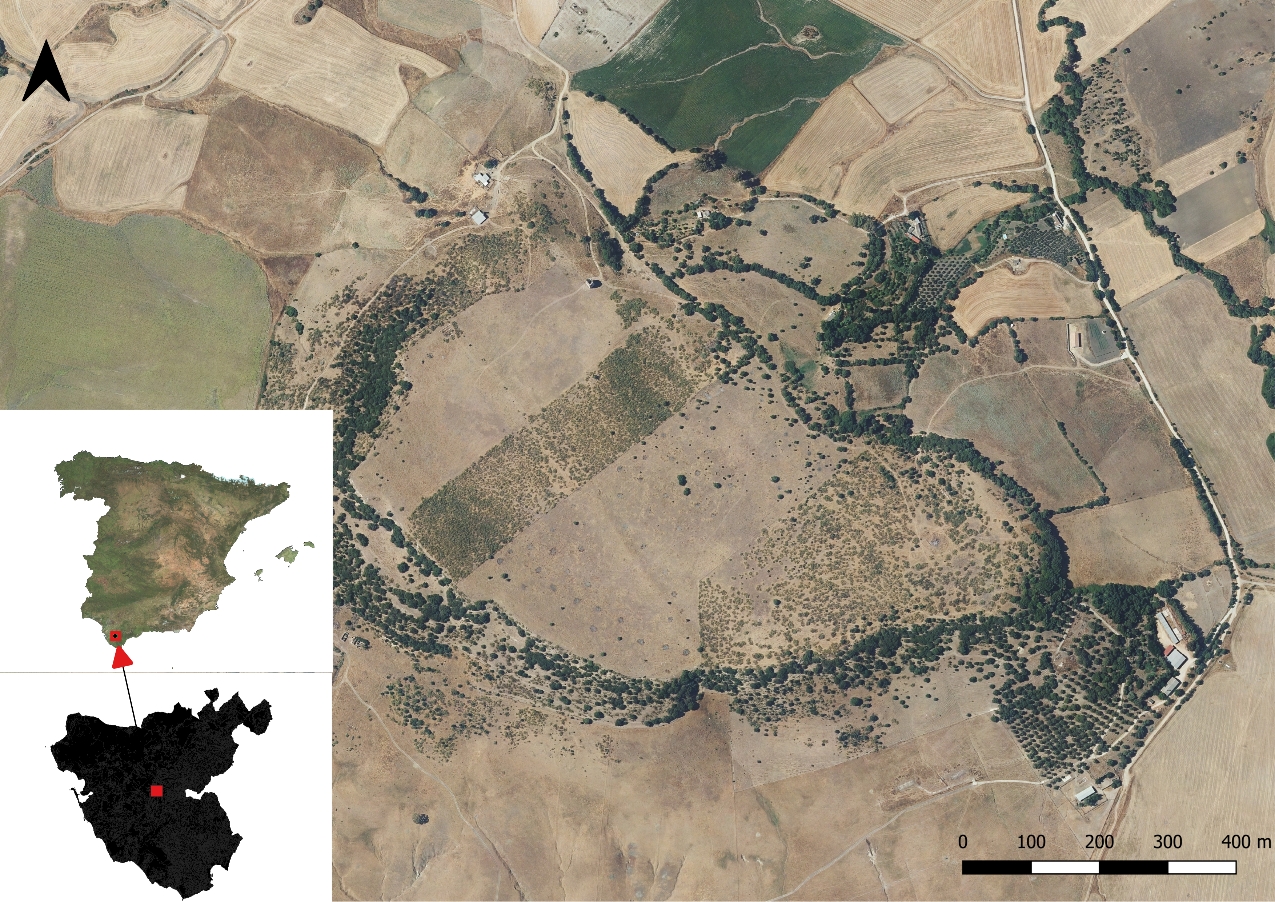
Figure 1 - Location of Mesas del Esparragal archaeological site.
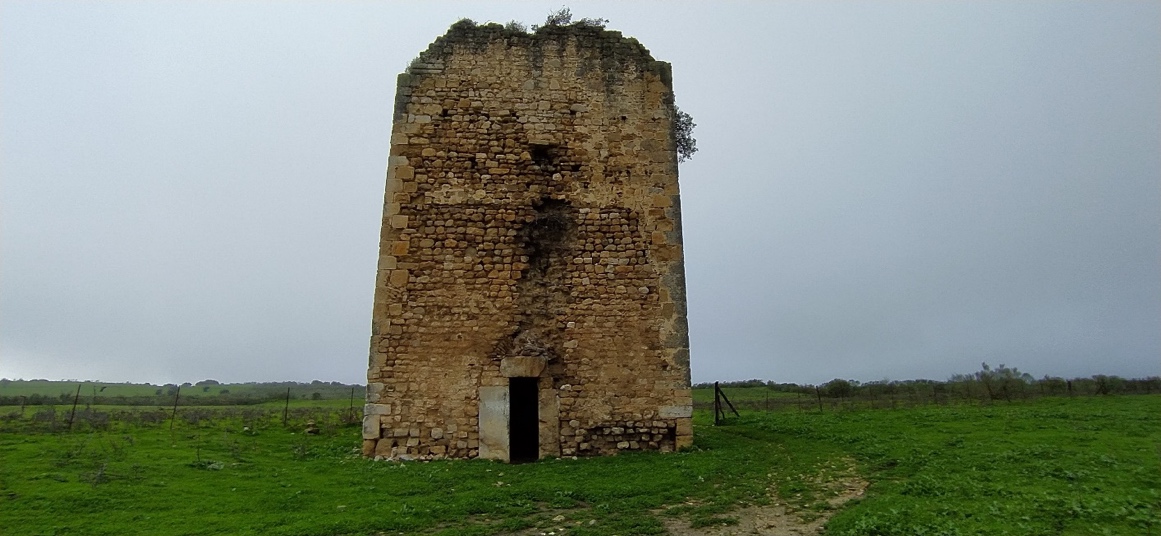
Figure 2 - Remains of the Visigoth tower with Roman foundations, own elaboration.
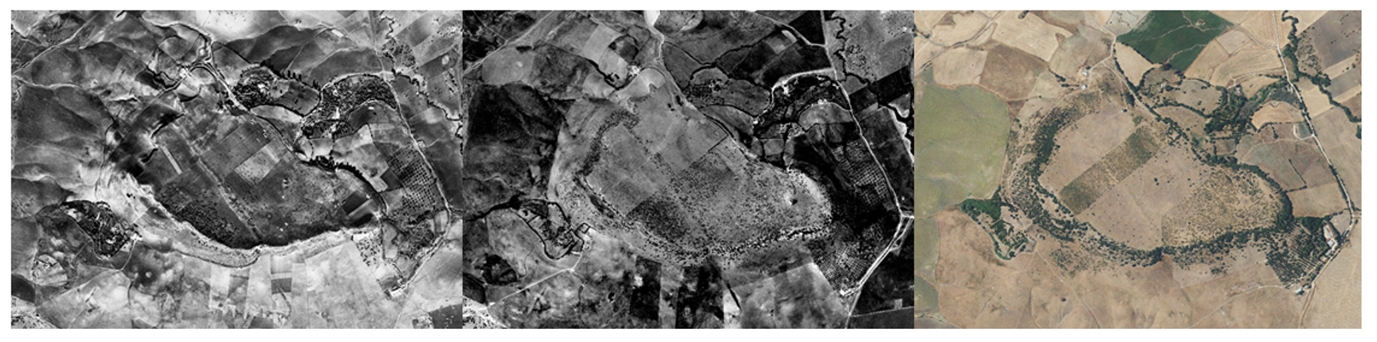
Figure 3 - Evolution of the archaeological site through the visualization of aerial photography. The first image corresponds to the aerial photograph taken by the American army in 1956. The second one is the Interministerial aerial photography, taken during the years 1973 and 1986. Finally, the current aerial photography, produced by the National Centre of Geographic Information (CNIG) and the National Geographic Institute (IGN).
Methods
Data workflow
LiDAR technology has become a cost-effective alternative to traditional surveying techniques such as photogrammetry. By emitting an energy beam from an optical sensor towards the earth’s surface while moving along a predefined route, the LiDAR sensor generates a dense point cloud. When the pulse reaches the surface, it is reflected back to the sensor, and the time it takes to return is recorded. This allows for precise distance calculations, resulting in an accurate digital model of the terrain (Mlekuž, 2018). The ability to manage, visualize, and share these data through various geographic information programs makes LiDAR an essential tool for archaeological and topographical analysis.
The primary dataset for this study is the LiDAR data provided by the National Center for Geographic Information (CNIG) through the National Plan for Aerial Orthophotography (PNOA). This dataset, collected via airborne laser scanning technology, enables high-precision digital representation of the earth’s surface (Prather, 2019). With a point density of 0.25 points per square meter, it ensures detailed topographical analysis. The raw point cloud data undergoes preprocessing, classification, and filtering to extract relevant information for archaeological study. Additional data sources include historical aerial imagery, topographic maps, and previous archaeological research that provide contextual support.
The research workflow follows a sequence of data acquisition, processing, and analysis. Initially, LiDAR point cloud data is downloaded from the CNIG repository, along with historical aerial images from different periods (1956, 1973-1986, and present-day). Archaeological and historical information relevant to the site is also collected. Preprocessing is carried out using LAStools, which removes noise and reclassifies points to separate ground from non-ground elements, culminating in the generation of a Digital Terrain Model (DTM) by filtering non-ground points (Figure 4).
The processed DTM is then analyzed using Relief Visualization Toolbox (RVT) and SAGA GIS, two open-source software programs available for free download from their respective websites. Various visualization filters are applied, including Three-directional Hillshade, which enhances topographic relief; Simple Local Relief Model (SLRM), which highlights micro-topographical features; and Red Relief Image Map (RRIM), which differentiates convex and concave landforms. The results obtained from RVT and SAGA GIS are compared to determine the most effective approach.
The interpretation phase focuses on identifying possible archaeological structures by analyzing filtered imagery and cross-referencing findings with historical maps and aerial photographs. When feasible, field verification is conducted.
Data processing
For data processing, LAStools, developed by Rapidlasso, is used to manage and process LiDAR data efficiently. This software includes a set of tools designed for classification and filtering of point clouds. In this study, the point cloud undergoes reclassification to eliminate residual noise and refine the identification of elements within the dataset. The key step in this process involves selecting only the ground-level points (classification level 2), which are essential for constructing a reliable Digital Terrain Model (DTM). The DTM, which represents the bare-earth topography, provides a clear and accurate depiction of the study area (Felicísimo, 1999).
Once the DTM is generated, it is imported into the Relief Visualization Toolbox (RVT) software, version 2.2.1. Developed in 2013 by a team of Slovenian researchers, RVT is an open-source tool designed to enhance the visualization of DTMs by applying raster-based filters. These filters are widely used in disciplines such as history, archaeology, geography, geomorphology, cartography, hydrology, and forestry, among others (Kokalj & Hesse, 2017). To further refine the analysis, the DTM is also processed using SAGA GIS (System for Automated Geoscientific Analyses), an open-source geographic information system that, despite its complex interface, offers powerful tools for processing large datasets. SAGA is particularly useful for hydrological modelling and geomorphological analysis.
To evaluate the effectiveness of different visualization techniques, a series of filters are applied using both RVT and SAGA. The selected filters include Three-directional Hillshade, which enhances topographic relief perception; Simple Local Relief Model (SLRM), which highlights micro-topographical features by removing broad elevation trends; and Red Relief Image Map (RRIM), which emphasizes concave and convex landforms. The results obtained from each software are compared to determine the most effective method for identifying potential archaeological structures.
A comparative analysis assesses the clarity, level of detail, and overall effectiveness of each filter in revealing hidden archaeological features. The evaluation criteria include the contrast between archaeological structures and surrounding terrain, the ability to highlight known features, and the ease of interpretation. Whenever possible, field validation is conducted to verify the presence of identified structures. The accuracy of LiDAR-based findings is cross-referenced with historical data and real-world observations to ensure reliability. This methodological approach integrates remote sensing techniques, GIS processing, and archaeological interpretation to optimize the detection of buried structures and contribute to a deeper understanding of the study area.
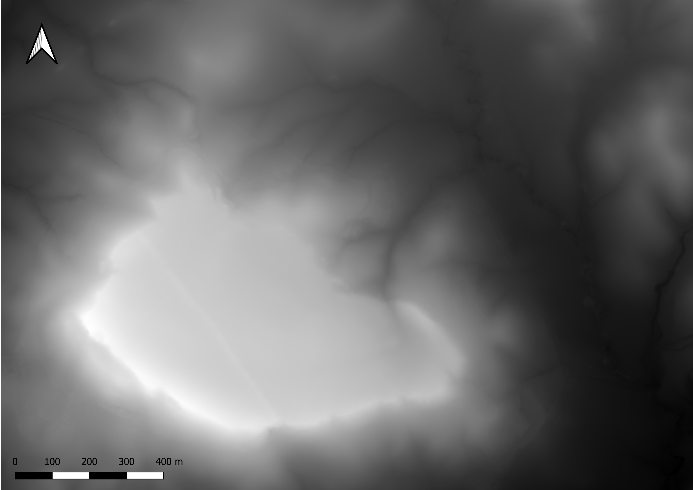
Figure 4 - Digital Model Terrain (DTM) with a density of 0.25 points per metre of the research area.
Three-directional Hillshade
The three-directional Hillshade or multidirectional Hillshade is a computation algorithm created for the visualization of grey molecules into 3D canvas (Tarini et al., 2006) consists of a shading map to which the Azimuth values from 0º to 360º are added clockwise in each of its three bands, resulting in a raster in which the light sources are divided into three directions, distributed between bands 1, 2 and 3 of the DTM (Kokalj, 2016). This type of filter has the advantage of being easy to interpret thanks to its grey scale processing. Furthermore, as it is a raster model with multiple directions, the light sources impact on the entire surface, facilitating its general visualization. On the other hand, some difficulties are encountered when identifying archaeological structures, since the incidence of light in some of the areas, especially if they are very horizontal surfaces with little relief, makes difficult the task of detecting cropmarks below the surface. In this study, an azimuth value of 0°, 120° and 240°, with a solar elevation angle of 45° was used for the tridirectional Hillshade filtering.
HS = 255 * [(cos(θ_s) * cos(θ_p)) + (sin(θ_s) * sin(θ_p) * cos(ϕ_s - ϕ_p))]
Simple Local Relief Model
The Simple Local Relief Model consists of a filtering process that roughly eliminates variable heights in large-scale morphological elements, such as geographic features such as valleys and plains, to highlight small-scale details (Hesse, 2015).
The whole process is carried out by elaborating the following processes: a low pass filter is made to the original raster; this function results in a smoothed Digital Elevation Model (DEM) from which zero meters’ contours are extracted betwen the positive and the negative features. Then, the real elevation is extracted from the original DEM to create the simplified elevation raster. From the elevation points, the Digital Model Terrain (DTM) is generated, which will be the Simple Local Relief Model (Novák, 2014).
The advantage of working with this type of filter lies in the visual improvement in detecting archaeological structures. Due to this, this process is one of the most suitable for archaeological analysis. However, it also has some disadvantages, which may include the greater difficulty of analysis in amateur researchers. It is also possible, that it misinterprets data such as areas of small bushes or slopes in the terrain, which it often interprets it as lines of structures. It is therefore advisable to visit the terrain to be analysed previously or having a high-quality aerial photography, such as those taken using drones, also known as UAV. For the SLRM filter, a smoothing radius of 10 metres was applied to the original DTM.
SLRM = Original Elevation - Smoothed Elevation (Low Pass Filter)
Red Relief Image Map
Finally, the Red Relief Image Map (RRIM) consists of a series of filters created by Kaneta and Chiba (2019) with the aim of studying the geomorphological evolution of volcanoes, thus helping to control and monitor its activity in a highly seismic area such as Japan. The filter is used to detect differences between concavities and convexities generated by means of a raster slope from which the positive openness and negative openness have been subtracted and in turn divided in half, resulting in Ridge Valley Index. This algorithm joined with a red Slope raster it can be obtained this raster filter (Chiba, et al., 2008):
RVI= Positive Openness – Negative Openness
2
The advantages are clear when it comes to better identifying concave and convex surfaces in places where the morphology of the terrain varies greatly, such as large mountain systems or volcanoes themselves. On the other hand, the result is not so striking in places situated at low altitude. Similarly, this type of filter is not the most advisable when it comes to identifying archaeological remains, since they seem to be more designed for landscape analysis, more focused on medium and maximum levels of detail. With this, it is interesting to apply this filter in order to determine the changes produced in a particular landscape.
Results
Hereunder are detailed the results obtained by using the SAGA and Relief Visualization Toolbox software to obtain and compare filters to determine which filter is the most suitable for the identification of archaeological remains below the surface. In order to represent it, it has been decided to establish a scale from minor to major in relation to its usefulness in the field of archaeology. Below are the results obtained by using the SAGA and Relief Visualization Toolbox software to obtain and compare filters to determine which filter is the most suitable for the identification of archaeological remains below the surface. To represent it, it has been decided to establish a scale from minor to major in relation to its usefulness in the field of archaeology (Table 1).
Table 1 - Comparative table between the filters analysed.
Filter | Visual clarity | No. structures detected | Processing time |
|---|---|---|---|
RRIM | Medium | 3 | 2 min |
Hillshade | High | 5 | 1 min |
SLRM | Very High | 7 | 3 min |
First, we have the RRIM filter. As can be seen in the image (Figure 5a and 5b), it can be seen that the result in figure (a) has a greater roughness in comparison with figure (b) whose final result is smoother. This may be due to conditions such as the lack of power in the internal motor of the software or the absence of a final smoothing filtering.
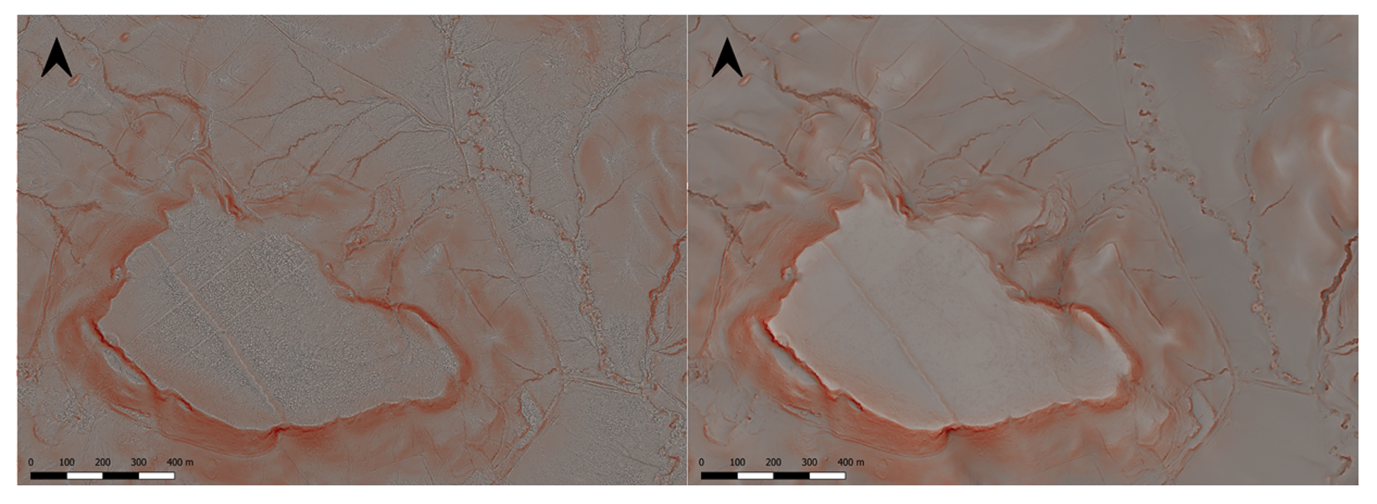
Figure 5 - Results of Red Relief Image Map (RRIM). Figure (a), on the right, are made by RVT software. Figure (b), on the left, the product creates with SAGA.
Similarly, difficulties are encountered when identifying clear archaeological structures, although it is true that thanks to the characteristics of this filter, a better visualisation of the hill is achieved, being able to distinguish the different phases of its transformation.
Secondly, we find the Three-directional Hillshade. Represented in Figure 6 (a) and (b). Figure (a) results in a much brighter image, which changes very little once the raster values have been modified, while figure (b) has a duller tone by default, which allows the details of the DTM to be appreciated with greater quality. It is in this raster (Figure 6b) that some details relating to the identification of structures under the ground can be seen, represented by the red box.
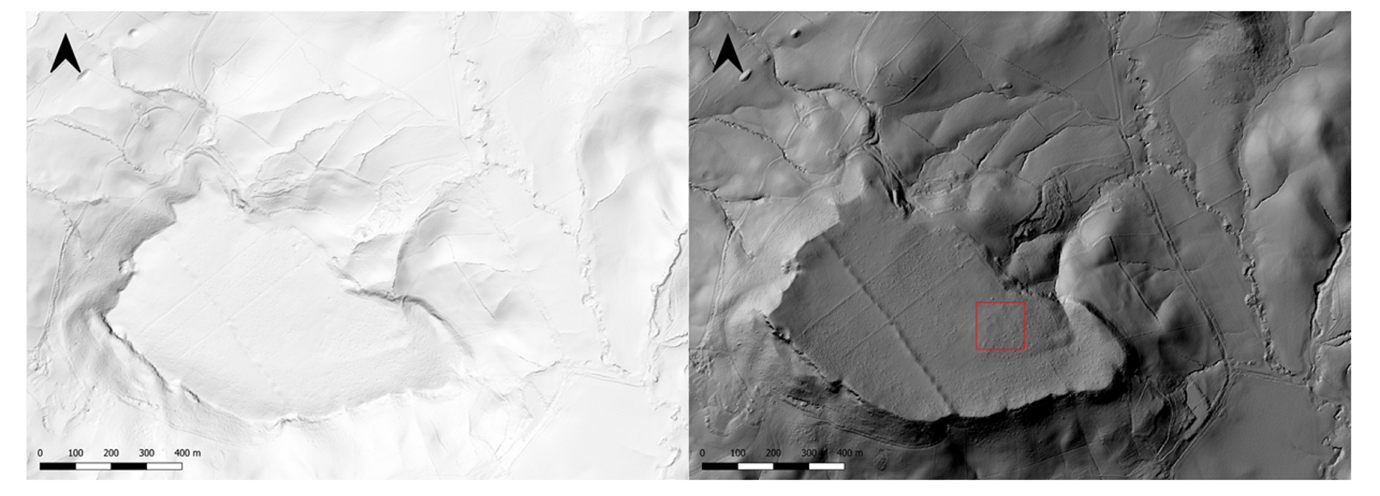
Figure 6 - Results of three-directional Hillshade (multidirectional Hillshade). Figure (a), on the right, are made by RVT software. Figure (b), on the left, create with SAGA. The red box indicates the location of possible archaeological structures.

Figure 7 - Results of the Simple Local Model Relief filter. Figure (a), on the right, are made by RVT software. Figure (b), on the left, with SAGA software.
Thirdly and finally, the results obtained by the Simple Local Relief Model are presented in Figure 7a and Figure 7b. As can be seen in the comparison between the two images, the results obtained by the RVT software are considerably clearer than those elaborated by SAGA. Thanks to the first one (a) a better visualization can be obtained and for this reason, as well as a better panorama when locating archaeological structures. On the other hand, figure b presents a greater number of irregularities, giving as a final product a rougher raster model and, consequently, more difficult to interpret. A total of 7 linear structures and 3 concentrations of possible buildings detected only by the SLRM filter were counted. The other filters identified between 2 and 5 similar structures.
Discussion
As can be seen in Figure 8 after using the Simple Local Relief Model, a series of cropmarks can be distinguished along the surface of the archaeological site. In the central and southeastern areas, a set of alignments can be found that could correspond to possible archaeological structures. It is also very interesting how the divisions of old agricultural plots, visible only through the aerial photograph taken in 1956, can be visualized, which could be verified in situ.
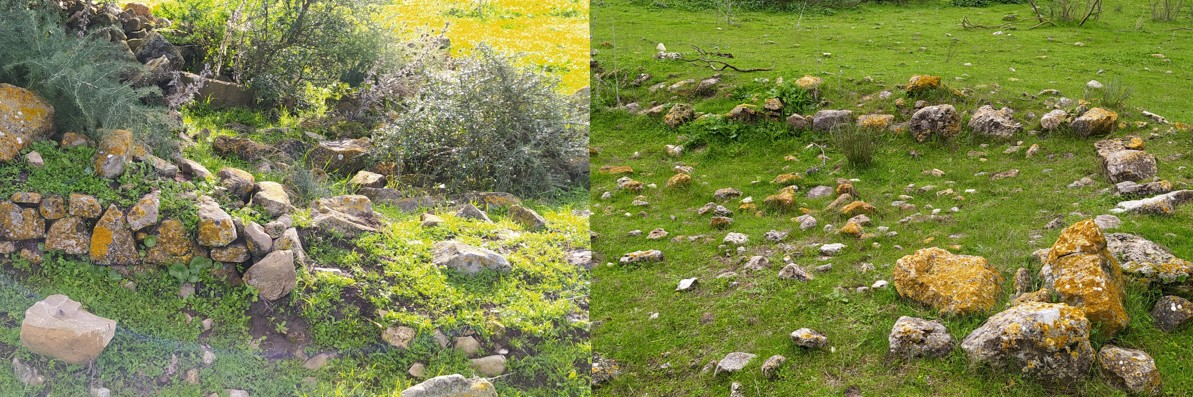
Figure 8 - Structures identified during the site visit.
Following the implementation of these three types of filters using the three-directional Hillshade (or multidirectional Hillshade), Simple Local Relief Model and Relief Image Map created in RVT and SAGA open-source software programs, several conclusions can be drawn (Figure 9).
On the one hand, the use of raster filters for terrain analysis is one of the great improvements that Geographic Information Systems have incorporated into scientific work, in this specific case, historical-archaeological research. On the other hand, the use of LiDAR data well classified along with the application of raster filters is an indispensable ally when making decisions about the implementation of invasive archaeology processes, such as excavations. For the case we are dealing with in this article, the results can be seen represented in Figure 8. Although, it is true that there is a wide range of visualisation techniques whose success in the results can be subjective, depending on the user own experience. It can be argued that the results obtained in some of the filters are more beneficial than others.
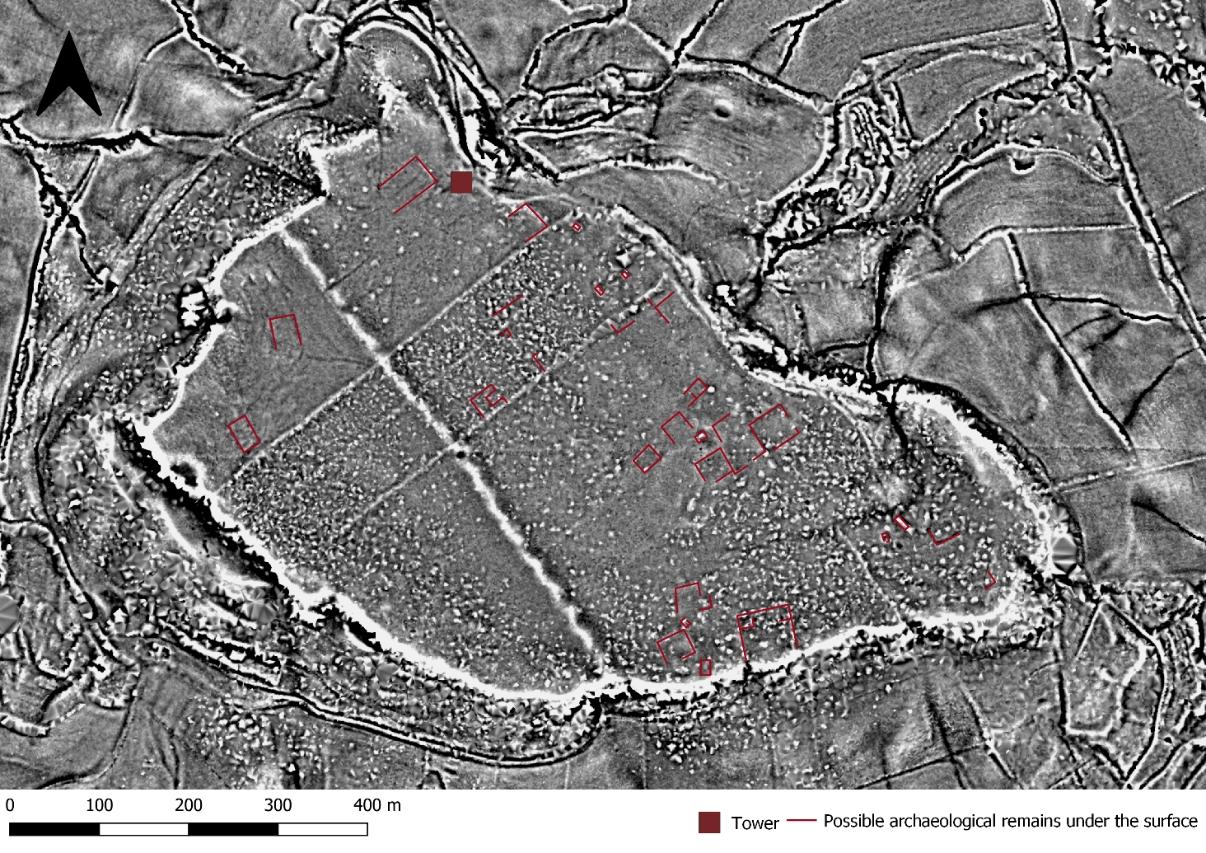
Figure 9 - Representation (in red) of the possible structures identified under the floor of the site, which may correspond to elements of archaeological origin.
For this reason, we must be aware of what we need the filters for, what we want to investigate or to analyse. It is necessary to distinguish between Historical Landscape analysis and the search for archaeological remains. Each filter has its advantages and disadvantages, and our task consists in understanding their usefulness and know when they should be applied. It is also true that there are currently limitations in the exploitation of LiDAR data. This is because, although the data offered by the CNIG is open source and its quality is more than acceptable in comparison with other data download offered by portals in other countries. It is true that they are starting to lag the scientific advances that are currently being made.
Therefore, more and more researchers are resorting to obtain LiDAR data using drones, because their results are characterised by a higher quality. Similarly, it is highly recommended the combination of the use of non-invasive archaeological techniques, such as the use of Geodetection systems like Ground Penetrating (GPR) or the magnetometer, which could provide a greater amount of data about the subsoil, helping to contrast the information obtained through remote sensing systems.
Acknowledgments
Preprint version 5 of this article has been peer-reviewed and recommended by Peer Community In Peer Community In Archaeology (https://doi.org/10.24072/pci.archaeo.100604; Tuffery, 2025).
Funding section
No funding was received to assist with the preparation of this manuscript.
Conflict of interest disclosure
The authors declare that they comply with the PCI rule of having no financial conflicts of interest in relation to the content of the article.
Data, scripts, code, and supplementary information availability
LiDAR dataset: Publicly available through the National Center for Geographic Information (CNIG) as part of the National Plan for Aerial Orthophotography (PNOA). https://centrodedescargas.cnig.es/CentroDescargas/buscadorCatalogo.do
PNOA_2020_AND_250-4048_ORT-CLA-RGB
Processed data: Digital Terrain Models (DTMs) and raster outputs generated in the study: https://doi.org/10.5281/zenodo.14917303
Scripts and code:
Data processing and classification scripts used in LAStools. https://rapidlasso.de/product-overview/
Visualization scripts for Relief Visualization Toolbox (RVT) https://plugins.qgis.org/plugins/rvt-qgis/ and SAGA GIS. https://saga-gis.sourceforge.io/en/index.html