
 CC-BY 4.0
Introduction
Evolution by natural selection occurs when organisms express heritable variation for fitness. As a result, fitness-related traits change in response to selection (Walsh & Lynch, 2018). The heritable trait variation upon which selection can act is typically equated to variation in the DNA sequence of bases in most studies of adaptive evolution. However, transgenerational epigenetic variation exists for fitness-related traits (Kronholm et al., 2017; Muyle et al., 2021; Stajic & Jansen, 2021). Under the assumption that epigenetic variants are stable across generations, theory predicts that selection can act on this heritable variation alone, without any contribution of genetic variation (Bonduriansky & Day, 2009; Danchin et al., 2011; Jablonka et al., 2005).
DNA methylation is the most studied epigenetic mark that influences chromatin structure and the silencing of transposable elements (TE) and genes (H. Zhang et al., 2018). Epigenome-wide association studies (EWAS) have been successfully used in the past (Ong-Abdullah et al., 2015) to identify population divergence based on heritable DNA methylation patterns linked to phenotypic traits. The presence of epigenetic divergence between populations that have a variable genomic background is difficult to interpret as strong evidence that selection can shape standing epigenetic variation independently from DNA sequence variation but sheds light on this possible scenario.
The stakes are high for evaluating the potential role of epigenetic variation as a source of variation upon which selection can act. This is because the epigenetic response to selection may participate to adaptation of wild populations confronted to environmental constraints. Selection of standing epigenetic variation could also participate to breeding strategies (Kakoulidou et al., 2021). Epigenetic breeding might be rather straight forward in crops, particularly in vegetatively propagated crops (Latutrie et al., 2019). There is no reason why the response to selection could not be predicted from stable epigenetic heritability and the selection differential as usually done on the basis of the standing genetic variation of traits (Walsh & Lynch, 2018). Another stake lies in the debate around the evolutionary significance of epigenetic variation (Charlesworth et al., 2017; Quadrana & Colot, 2016; Richards et al., 2017; Verhoeven et al., 2016). This debate roots in the confounded genetic and epigenetic variations of traits that are technically and statistically difficult to separate (Thomson et al., 2018). It also roots in the potential lack of stability of DNA methylation across generations (Ossowski et al., 2010; Becker et al., 2011; Schmitz et al., 2011; Quadrana et al., 2019). We therefore tested for an epigenetic signature of selection by using a selection experiment in artificial plant populations displaying DNA methylation polymorphism in the same genetic background, which to our knowledge has never been done before (for a signature of population epigenetic divergence attributed to selection, see Schmid et al., 2018).
Here, we tested the hypothesis that directional selection can act on heritable epigenetic trait variation in an identical genetic background by conducting artificial selection experiments in Arabidopsis thaliana. There is growing evidence for epigenetic variation, notably DNA methylation, at quantitative traits in animals and plants (Cortijo et al., 2014; Noshay & Springer, 2021; Vogt, 2021). This is notably the case of size traits and flowering time in A. thaliana (Cortijo et al., 2014). Size traits and flowering time strongly influence the fitness of most plants in nature (Halbritter et al., 2018). There is evidence for the heritable epigenetic variation of these traits associated with differentially methylated regions (DMRs) that are stably inherited across generations in epiRILs (Johannes et al., 2009; Reinders et al., 2009; Roux et al., 2011; Y.-Y. Zhang et al., 2018). These EpiRILs are a set of 123 fixed homozygous lines, descending from an F2 population, that were obtained by an initial cross of isogenic parents with different DNA methylation profiles (Col-0 x Col-ddm1-2) (Johannes et al., 2009). The mutation in the DDM1 gene (ddm1) – a chromatin remodeler involved in DNA methylation – induced hypomethylation of 126 clusters of cytosines (DMRs). We therefore expect selection differentials based on size and flowering time, e.g., by allowing to breed only bigger or late flowering epiRILs, to produce the expected directional trait changes in the progeny.
Novel phenotypes can be selected in A. thaliana populations that only differ with respect to epigenetic variation in a fixed genomic background (Schmid et al., 2018). These changes were stably inherited over at least two generations in the absence of selection and correlated with changes in DNA methylation and transcription. Potential genetic differences that could have occurred over the 7-8 generations of this experiment were excluded by resequencing the complete genome of several individuals. The epigenetic divergence found between lab populations exposed to fragmented and disturbed landscape environments and natural plant populations could therefore be attributed to selection (Schmid et al., 2018). Today, the time is ripe to reach a better understanding of the epigenetic response to selection. Whether directional selection shapes the standing epigenetic variation of traits as it would do with the standing genetic variation of traits remains to be clarified. Confirming this hypothesis would confirm that the genetical theory of natural selection also applies to epigenetic variation and unlock new potential for breeding strategies.
First, building upon the available knowledge, we described DNA methylation polymorphism acknowledged to be stable across generations (Cortijo et al., 2014; Johannes et al., 2009) and phenotypic variation in two different artificial A. thaliana epiRIL populations. We grew these two populations made of two totally different sets of A. thaliana epiRILs in similar conditions and at different times, in order to repeat the experiment in two different populations. Second, independently in each population and for each trait, we artificially generated a fitness differential between plants by selecting them based on their morphological and reproductive trait values. We selected in two different directions - for upper and lower trait values – and applied two different selection intensities - weak and strong - to explore the potential properties and limits of epigenetic selection. Third, we estimated the phenotypic response to selection in the next generation of plants and assessed whether changes in epigenetic allele frequencies can be directly attributed to the response to selection. To this aim, we developed an approach that consists in growing all the progeny as if every parental plant had been selected to be a breeder and removing the progeny of counter selected parents in silico. This is equivalent to selecting the offspring that survived based on the phenotype of their parents, almost as a delayed operation of selection. We did not find any equivalent approach in the literature, but do not claim that we are the only one who could have thought of this. This method allowed us to conduct in silico selection on as many traits as needed, based on the same real plant population. For every trait, we replicated the approach a thousand times in silico, using each time a different random sample of the base population to build the control group, which allowed us to build strong confidence intervals.
Material and methods
Plant material
Epigenetic Recombinant Inbred Lines (epiRILs) of Arabidopsis thaliana plants represent one of the few study systems available to date to investigate epigenetic variation associated with phenotypic trait variation, clearly identified as epiQTLs located on chromosomes, in an almost fixed genomic background (Johannes et al., 2009, Roux et al., 2011; Colomé-Tatché et al., 2012; Cortijo et al., 2014). We obtained 123 epiRILs from the Institute Jean-Pierre Bourgin (IJPB - UMR1318 INRAE-AgroParisTech, Versailles, France). These epiRILs were originally created by crossing two parents from the same accession (Columbia, Col) that differed only at the Decreased DNA Methylation 1 gene (DDM1), with one parent homozygous for the wild type DDM1 allele (Col-wt), and the other for the ddm1-2 mutant allele (Col-ddm1) (Johannes et al., 2009). The latter is characterized by a widely different DNA methylation profile background. These epiRILs were obtained after six generations of single seed descent and harbor differentially methylated regions (DMR) across the entire genome. These DMRs are stably inherited over multiple generations and associated with substantial heritable variation in flowering time and plant height (Cortijo et al., 2014; Johannes et al., 2009; Roux et al., 2011). Genome-wide DNA methylation data are available for these 123 epiRILs as well as the derived recombination map for 126 meiotically stable DMRs covering 81.9% of the genome (Colomé-Tatché et al., 2012). Some of these 126 DMRs function as epigenetic quantitative trait loci (Cortijo et al., 2014) that underlie the variation of the phenotypic traits that we measured.
We built two independent samples of 60 different epiRILs by randomly choosing lines without replacement out of the 123 lines available, in our seed storage in dry conditions under 20°C, in order to create two independent experimental populations of Col-wt epiRILs and replicate our selection experiment in these two populations at different times. Population 1 included the following epiRILs (Colomé-Tatché et al., 2012): 14, 20, 36, 52, 54, 55, 62, 64, 70, 92, 99, 108, 112, 144, 164, 166, 169, 183, 193, 195, 215, 216, 238, 257, 260, 275, 277, 297, 305, 326, 333, 340, 344, 350, 356, 361, 362, 368, 371, 393, 394, 400, 408, 432, 434, 437, 458, 466, 467, 473, 477, 480, 488, 492, 493, 497, 503, 539, 561 and 567. Population 2 included the following epiRILs: 8, 11, 18, 24, 46, 53, 60, 69, 71, 73, 94, 95, 101, 114, 118, 137, 147, 148, 150, 159, 170, 172, 202, 208, 218, 222, 225, 229, 232, 244, 252, 258, 262, 276, 315, 323, 363, 366, 375, 391, 410, 425, 438, 439, 454, 471, 494, 495, 500, 506, 508, 523, 538, 556, 558, 559, 570, 572, 573 and 579.
Plant cultivation
The selection experiment required growing two successive generations of plants (G0 and G1) for each of the two independent experimental populations of Col-wt epiRILs. G0 of population 1 was grown in June 2018 and G1 in January 2019. G0 of population 2 was grown January 2019 and G1 in August 2019. At G0, three plant replicates per epiRIL were grown (n = 180 plants for each population). Ninety-eight percent of G0 plants survived until flowering (n = 177 plants in population 1 and n = 177 plants in population 2). At G1, three descendants of every G0 plant were grown (n = 531 plants per population). Because of a final success rate of 96 %, 524 plants were available for population 1, and 521 plants for population 2. All the plants were grown in a growth chamber under controlled long-day conditions (day: 16 h – 20/22°C, night: 8 h – 16°C/18°C) with artificial light (120 mmol/m2s-1), in 7x7x6.4 cm pots (Soparco, France) on a substrate composed of 80% BP Substrate K716 (Klassman, France) and 20 % of vermiculite (Souflet Vigne, France). About 5 to 10 seeds, equivalent in terms of lineage and parental plant, were sown in each pot and seedlings were thinned out to retain a single plant per pot. Plant location in the growth chamber and planting occurring over a few hours was fully randomized. Comparisons were carried out under identical environmental conditions and the design was fully randomized. G0 and G1 were grown 6 months apart in different seasons, but in an underground growth chamber under fully controlled environmental conditions.
Plant phenotypic measurement
Four growth- and flowering-related phenotypic traits were recorded: Flowering time (in number of days since sowing) and rosette diameter were recorded when the first flower opened. Height at first silique and above-ground biomass were measured after plants ceased flowering. Above-ground biomass was measured on an analytical high precision lab balance (Sartorius, Germany) after plants were dried for 24h at 40°C in a laboratory oven (France Etuves, France). These traits, and in particular growth traits, are not expected to be fully independent. They were chosen because they present transversal and comparative interest in ecological and evolutionary plant studies as they are usually recorded in A. thaliana and other plant studies (Halbritter et al., 2018; Roux et al., 2011; Herrera & Bazaga, 2010).
Selection experiment
G0 populations formed the base generation upon which selection was conducted. In each population, we ranked plants based on their trait values. We randomly selected plants from this list without replacement to establish a control line. We then selected the top-ranked and bottom-ranked of the remaining plants to establish high and low selection lines, respectively. The high and low selection lines (HSL and LSL) respectively aim at increasing and decreasing trait value in response to selection at the next generation. In order to test the limits of the selection protocol, the selection experiment was conducted at two selection intensities: weak selection, whereby each selection line (HSL and LSL) consisted of 33% of the plants (60 plants out of 180) and strong selection, whereby ca. 11% of the plants were randomly sampled to build a control group and then the upper and lower ca. 11% (20 plants out of 180) of the remaining plants were selected to build each selection line (HSL and LSL). The sample size of control groups matched the size of selection lines. G1 control group phenotypes, their similarity to G0, and their difference with G1 selection lines, allows to control for confounding effects between the response to selection and the effect of temporal changes in the controlled environment of the growth chambers, which in itself is highly unlikely.
Selection experiments conducted on outcrossing plants require cross-pollinating different sets of plants for the different traits under selection and the different selection lines, and sometimes require isolating the plants forming control and selection lines before pollen might be dispersed between groups. This was not necessary in our selection experiment because Col-wt epiRILs reproduce almost exclusively by self-fertilization and were grown in tubes that isolate flowering stems from each other. Here, we grew the progeny of every G0 plant as if it had been chosen and multiplied (three descendants per parent) to be part of the control, the HSL and LSL. G1 lines were made up of the progeny of their G0 parents (three progeny per parent). As a result, we obtained a large number of plants in G1, so that we could build in silico the G1 dataset corresponding to a given selection intensity based on a given trait (Figure 1a, b). This original protocol is challenging on the logistical front because the number of plants cultivated in the growth chamber, and the number of phenotypic records, grew exponentially between G0 and G1, but it has certain advantages. It allowed us to establish HSL, LSL and control lines and estimate the response to selection in silico based on the four different phenotypic traits after the two generations of plants had been grown and measured in vivo.
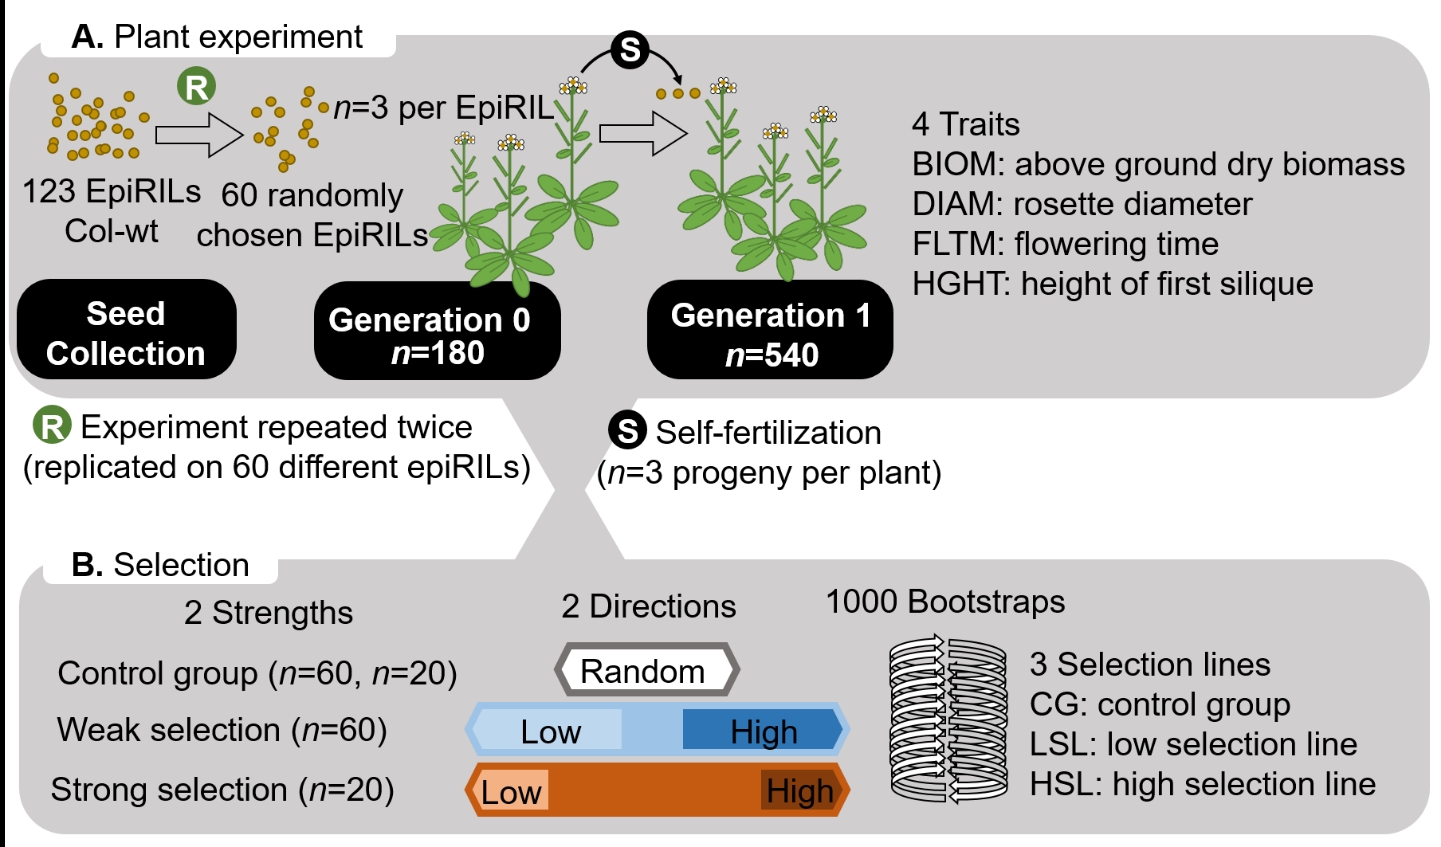
Figure 1 - Selection experiment drives phenotypic trait changes. (A) Plant experiment: Two sets of 60 different epiRILs (Arabidopsis thaliana Col-ddm1) were randomly assembled to build the two different experimental populations that were cultivated at different periods in the cultivation chamber. Seeds from the collection were grown to produce a buffer generation without selection and generate the seeds used to grow G0 plants. G1 plants – the progeny of G0 – were produced by self-fertilization. (B) Selection design: At G0, a control group was made of randomly selected plants. Plants with the highest and lowest trait values were respectively used to build the high and low selection lines. Weak and strong selection lines were respectively made up of 33% and 11% of the population. Corresponding progenies were used to build control groups and selection lines in G1, with differences between G1 lines reflecting responses to selection.
Statistical analysis
The classical in vivo estimation of the response to selection can be biased because a unique event of random sampling without replacement of a fixed set of individuals from the base population is used to establish the control line. This protocol can potentially produce a sample of values that is upward or downward biased by chance alone. The remaining individuals available to establish the high and low selection lines are then biased towards average values. Our original protocol allowed us to overcome this potential bias although we applied the same logical random sampling of individuals without replacement to build the control line. This is because we replicated 1000 times this random sampling in silico. We built the corresponding distribution and estimated unbiased estimates of the trait mean, Standard Error, and 95% Confidence Interval, for each line (control group, HSL, LSL) and each selection intensity. We used the lack of overlap between the 95% confidence intervals of phenotypic estimates to test for a significant difference between high and low selection lines. This is a conservative approach because we did not allow overlap between CI to be considered a significant difference, and some overlap would have been allowed if we had used p values. CI provides information on the statistical effects (range, direction, strength and reliability) that is not provided by p values (Ho et al., 2019). Scripts in R (R Core Team, 2023) are publicly available on the Zenodo repository (https://doi.org/10.5281/zenodo.7603324, Pujol et al., 2025)
Phenotypic selection analysis
Despite the absence of genetic variation, we tested whether each experimental population responded to directional selection for higher and lower morphological and reproductive traits (above ground biomass, rosette diameter, flowering time, and height of first silique) values independently in each population, and for each trait. On the basis of the unbiased control and selection line values obtained on the basis of 1000 replicates, we estimated the response to selection (R). In our selection experiment, the response to selection evaluates the change in trait mean obtained after one generation of selection. R was calculated by the difference of mean trait value between the selection line and control line in G1, which allows controlling for potential between-year environmental variation of the mean phenotype (Walsh & Lynch, 2018). We also calculated the different parameters of the breeder’s equation, R = h²S, where S is the selection differential and h² is the realized narrow-sense heritability (Lush, 1937). The selection differential evaluates the selection pressure imposed on the base population by measuring the trait mean difference between the population and the selection line. The selection differential (S) was calculated by the difference of mean trait value between the selection and control line in G0 (Walsh & Lynch, 2018). We estimated h² for each trait on the basis of the available measurements of R and S. Caution must be taken when interpreting the heritability parameter calculated by the breeder’s equation in self-fertilizing plants because it might in fact estimate broad-sense heritability (H²).
Analysis of DNA methylation changes after selection
We tested in silico for changes in DNA methylation frequencies in response to phenotypic selection conducted in vivo. We constructed heat maps to visualize the changes in mean epi-allelic frequencies after selection for all the DMRs in both experimental populations by using the package ggplot2 (Wickham, 2016). To this aim, we estimated in G1 the mean epi-allelic frequencies at each of the 126 DMRs, for each selection and control line, and at each selection intensity and trait, on the basis of the 1000 resampled data sets. Epi-alleles were defined as “0” when originating from the DDM1 wild type Col-wt and “1” when originating from the ddm1-2 mutant col-ddm1. As a result, the more ddm1-2 mutant epi-alleles are present in a given line, the higher the frequency of DNA methylation.
We condensed the epi-allelic variation of each experimental population into a reduced number of linearly independent dimensions by using a Principal Component Analysis. PCA was done using the function dudi.pca of the ade4 package (Dray & Dufour, 2007). It summarized more than 90 % of epi-allelic variation in 16 dimensions for population 1 and in 17 dimensions for population 2. As a result, every plant had a coordinate on each of those PCA dimensions. We estimated the average coordinate and its 95% CI based on the 1000 resampled datasets, for each PCA dimension, selection or control line, selection intensity, and trait. We tested for significant differences in DNA methylation associated with selection by comparing the 95% CIs of high and low lines in G1. We used the lack of overlap between the 95% confidence intervals to test for a significant difference between high and low selection lines. This approach provided information on statistical effects (range, direction, strength and reliability) that is not provided by p values (Ho et al., 2019).
Analysis of molecular epigenomic integrity
Molecular epigenomic sequence data covering the whole genome were used to confirm the integrity of the DMRs in the epiRILs that were used in the plant selection experiment. Tissue sampling of 24 epiRILs (12 per population) and Col-wt was done 24 days after germination. Two rosette leaves were sampled and put into a 2-ml tube that was directly dropped into liquid nitrogen for instant freezing to ensure DNA conservation. Samples were kept at – 80°C. DNA extraction was performed using DNeasy kit (Qiagen, Germany) following the manufacturer’s protocol. Three replicates per EpiRIL were extracted separately and DNA content was quantified by using a Qubit fluorometer with the dsDNA HS Assay Kit (Invitrogen, USA). Quality was controlled using a NanoDrop spectrophotometer (Thermo Fisher Scientific, USA). The three DNA replicates were then pooled together and a control of the possible degradation of the DNA was performed by using TapeStation automated electrophoresis (Agilent, USA). Enzymatic Methyl-sequencing (EM-seq) was then conducted on these DNA samples by the IGen Seq platform (ICM, Paris, France). EM-seq library was prepared with the NEBNext® Enzymatic Methyl-seq (EM-seq™) (New England Biolabs, USA) following the manufacturer’s protocol. This method is known to provide accuracy and reliability at least equivalent to that achieved by Whole Genome Bisulfite Sequencing (WGBS) with similar global methylation levels indicating high resemblance in the overall detection of methylated Cs (Feng et al., 2020; Hoppers et al., 2020). Only the bisulfite conversion step differs between these two approaches; it is an enzymatic reaction in the EM-seq approach while it is a sodium bisulfite chemical treatment in the WGBS approach. The first EM-seq conversion step uses TET2 and an Oxidation Enhancer to protect modified cytosines from downstream deamination. TET2 enzymatically oxidizes 5mC through a cascade reaction into 5-carboxycytosine, protecting 5mC from deamination. The second enzymatic step uses APOBEC, which deaminates cytosines but does not affect 5caC. As a result, converted sequences are similar in the data generated by these two approaches and can be analyzed in the same way. Sequencing was done on an Illumina Novaseq 6000 sequencer (Illumina Inc, USA) with a flow cell S1 (300 cycles of 1600 million of reads (2*53 million reads of 150 base pairs per sample).
We verified the quality of the sequence reads by using the FastQC software Version 0.11.9 (https://www.bioinformatics.babraham.ac.uk/projects/fastqc/). We then trimmed 10 bp from each end of the paired-end reads and removed adapter sequences using Trim Galore software Version 0.6.5 (https://www.bioinformatics.babraham.ac.uk/projects/trim_galore/). Trimmed reads were subsequently aligned to the reference TAIR10 genome version of A. thaliana (Assembly: GCA_000001735.1) using BSMAP aligner Version 2.9 (Xi and Li 2009) specifying an allowed minimal insert size of 40 pb and a maximal insert size of 2500 bp. Only reads aligning uniquely to the reference genome were used for subsequent analyses. Cytosines with an average coverage below 8 (and above 100) across each line were removed to avoid a potential bias. Average genome coverage was 73.6 after filtering, which is well above most previous studies on DNA methylation in plants (Schmid et al., 2018). Mapped reads were then used as input data in the BSMAP methylation caller Version 1.0.0 implemented in the Galaxy interface (http://usegalaxy.org) (Goecks et al., 2010) to extract the methylation of each cytosine call and distinguish between the three contexts of methylation that can occur in plants in Cytosine-phosphate-Guanine dinucleotides (CpG), CHG and CHH contexts (H = A, T or C) (H. Zhang et al., 2018). We used the methylKit package Version 1.20.0 for DMR analysis (Akalin et al., 2012). False-positive methylation levels were measured by calculating methylation levels in the unmethylated chloroplast genome. The 126 DMRs were identified in the epiRILs used in our experiment by calculating the mean methylation ratio of each marker found by filtering genomic positions (chromosome and start and stop bp) from the BSMAP methylation calling files with a custom script in R made publicly available using the packages tidyverse and dplyr (Mailund, 2019; Wickham et al., 2019). These DMRs cover genomic regions of a size ranging from 200 base pairs to 11 kb. The distribution of the Bisulfite Sequence signals was verified for the 126 markers by plotting the distribution of BS signals in boxplots of the WT-inherited (Methylated) and the ddm1-inherited (Unmethylated) markers with a custom script in R made publicly available on the Zenodo repository (https://doi.org/10.5281/zenodo.7603324; Pujol et al., 2025).
For each DMR marker, percentages of methylated cytosines were compared between Col-wt and each epiRIL by using Fisher’s exact tests to confirm whether they were WT-inherited (not significantly different from Col-wt) or ddm1-inherited (significantly hypomethylated in comparison to Col-wt). To this aim, we used the methylKit package. Parameters used to call for differentially methylated markers were defined as follows: differential methylation > 25% and q value < 0.01 as established by other work on the same species (Kim et al., 2017). This approach allowed us to identify statistical differences between Col-wt and each epiRIL for the 126 differentially methylated regions (DMRs) published in Colomé-Tatché et al., (2012), and then compare the DMRs found in our experiment with those already published in the literature. To this aim, we calculated the percentage of overlapping probe classification following the methods developed by Colomé-Tatché et al., (2012) between published epiRIL DMR data and our EM-seq data for the plants used in our experiment. We considered percentages of similarity greater than 80% as a signal of very strong molecular correspondence, > 70% as strong, > 60% as moderate, and < 50% as weak. We also evaluated the molecular correspondence between the available WGBS data published for 8 epiRILs (60, 92, 150, 193, 202, 232, 260 and 480) (Bewick et al., 2016; Kooke et al., 2019; Lauss et al., 2018) and the EM-seq data of these same epiRILs used in our experiment by comparing directly the bisulfited sequencing signal. To this aim, we estimated the correlation between the 126 regions methylation ratios obtained from both techniques by using a Kendall rank correlation coefficient for each methylation context and for global methylation (cumulated information for all methylation contexts). We also conducted a hierarchical cluster analysis of the global methylation at the 126 DMRs of epiRILs and Col-wt, and then compared the hierarchical clusters by using cophenetic correlation coefficients. We also annotated the 126 DMRs using the PlantGDB database (Dong et al., 2004) and the Assembly version: AtGDB TAIR9/10 v171 (https://plantgdb.org/AtGDB/).
DNA hypomethylation can release TEs that can potentially impact gene expression and compromise genome integrity (Slotkin and Martienssen, 2007; Johannes et al., 2009; Reinders et al., 2009). Novel TE insertions have been shown to contribute to phenotypic variability in A. thaliana epiRIL populations (Mirouze et al., 2009; Reinders et al., 2009). However, several studies on A. thaliana epiRILs did not find that novel TE insertions contributed to phenotypic variation (Johannes et al., 2009; Reinders et al., 2009; Cortijo et al., 2014; Kooke et al., 2015; Bewick et al., 2016). These studies qualified these insertions as rare and random; most of them were found to be neutral (Ossowski et al., 2010; Cortijo et al., 2014; Kooke et al., 2015; Quadrana et al., 2019). Most of these insertions are described as private, i.e., found in a single epiRIL, at the hemizygous state (Quadrana et al., 2019). TEs are often considered not to affect estimates of phenotypic variation and DNA methylation polymorphism estimated on the basis of multiple epiRILs because their effect would be diluted in a population made of multiple epiRILs as a result of DMRs differing by definition between epiRILs (Schmitz et al., 2011; Cortijo et al., 2014; Kooke et al., 2015). Our in silico resampling approach also warrants our results against any bias produced by a given epiRIL by making any such potential effect infinitesimal. In the absence of resequencing approach, changes in copy numbers of private TE insertions affecting a given epiRIL phenotype cannot be strictly excluded.
Results
DNA methylation and phenotypic traits vary
We assessed and confirmed that the two A. thaliana experimental populations harbored DNA methylation polymorphism and trait variation in the Columbia wild type (Col-0) genetic background. Each experimental population (n = 180 plants per population; Figure 1A) consisted of a different set of 60 distinct epigenetic recombinant inbred lines (epiRILs) out of the 123 available epiRILs produced in A. thaliana (Schmid et al., 2018; see material and methods for details).
Molecular epigenomic sequence data covering the whole genome were used to confirm the integrity of the DMRs in the epiRILs on the basis of three biological replicates per epiRIL for 24 epiRILs. This molecular analysis confirmed that epiRILs differed as expected by harboring DNA methylation polymorphism in the form of 126 Differentially Methylated Regions (DMRs) previously identified and whose stable inheritance is acknowledged (Johannes et al., 2009; Roux et al., 2011) (Figures S1 and S2, Tables S1 and S2). Although we do not expect biomass, rosette diameter, flowering time and height to be independent at the phenotypic level, the extent to which their variation is associated with DNA methylation polymorphism was found to vary (Roux et al., 2011). In the two artificial populations, we found 14% to 25% variation (estimated by the coefficient of variation 100*SE/mean) in above-ground dry biomass (average ± SE in populations 1 and 2, respectively; 0.64 ± 0.09 g and 0.60 ± 0.15 g), 12% to 23% variation in rosette diameter (9.7 ± 1.12 cm and 7.7 ± 1.80 cm), 7% to 9% variation in flowering time (27.3 ± 1.92 d and 28.3 ± 2.4 d), and 21% to 23% variation in height at first fruit (12.1 ± 2.50 cm and 11.6 ± 2.69 cm). Thus, in accordance with the making of these experimental populations as different subsets of epiRILs, we found phenotypic trait variation and epigenetic variation in each of these two populations.
DNA methylation stability across generations
We conducted molecular correspondence analyses that confirmed the broad stability of the 126 DMRs. Stability of DNA methylation polymorphism was assessed by comparing the 126 DMRs (Colomé-Tatché et al., 2012) between reference epiRILs established by Johannes et al., (2009) and the same epiRILs used in our selection experiments, therefore after regeneration. This comparison confirmed their molecular correspondence (Figure S1). We used an Enzymatic Methyl-seq (EM-seq, 26) molecular sequencing approach that provided us with the methylation status of the whole genome cytosines of 24 epiRILs (12 per experimental population) with a high sequencing coverage (see methods and Table S3). We found high molecular correspondence by using the overlapping probe classification approach developed by Colomé-Tatché et al., (2012). This correspondence reached on average 87%, ranging from 69% to 97%, for the CpG methylation context and on average 86%, ranging from 64% to 98%, for the CHG methylation context (Tables S1 and S2). We did not investigate the CHH methylation context because it presents a low methylation ratio, varies among cells, is often stochastic (Harris & Zemach, 2020) and is less stable than CpG and CHG contexts (Gouil & Baulcombe, 2016), and was not available in the literature (Colomé-Tatché et al., 2012). Additionally, we compared the EM-seq data of 126 DMRs with the published WGBS data available for eight epiRILs (Bewick et al., 2016; Lauss et al., 2018; Kooke et al., 2019) (Figure S2 and Table S4). We found an average correlation of 0.65 (ranging between 0.49 and 0.79) for the CpG context, and an average correlation of 0.73 (ranging between 0.64 and 0.79) for the CHG context. Furthermore, the hierarchical clustering analysis indicated a high similarity of the methylation in epiRILs sequenced by both EM-seq and WGBS approaches, with a high (0.89) cophenetic correlation coefficient (Figure S2). Our results were coherent with the knowledge that hypomethylation is stable across generations in the CpG context (Mathieu et al., 2007) and with the stability of hypomethylation in the CHG context where molecular mechanisms driving modifications differ (Niederhuth & Schmitz, 2014). Although the methylation status is known to be reversible in DMRs (Reinders et al., 2009; Johannes & Colomé-Tatché, 2011), we detected a very small number of changes in the 126 DMRs, illustrating the broad stability across generations of DNA methylation polymorphism (Tables S1 and S2).
Our results showed that over the 126 DMRs, which included protein coding genes, intergenic regions, and TEs, only 25 DMRs included potentially mobile TEs (Ossowski et al., 2010) that could affect traits of interest (Colomé-Tatché et al., 2012) (Table S5). We therefore identified methylation changes occurring at these 25 DMRs between the 24 epiRILs sequenced by the EM-seq approach and the same epiRILs from the reference epiRIL data established by Johannes et al., (2009). Most of these DMRs did not change. Very few new hypomethylation changes occurred in these DMRs, a mean of 0.2% (ranging from 0% to 4%) in CpG context, and of 0.3% (ranging from 0% to 4%) in CHG context. On average 6.3% (ranging from 0% to 32%) of these DMRs in the CG context and 9.6% (ranging from 0% to 36%) of these DMRs in the CHG context reverted from a hypomethylated state to the wild-type methylation state that is known to silence TEs and therefore keep the integrity of the genome structure (Tables S1 and S2).
DNA methylation stability across generations
In the progeny, we found significant divergence in response to selection between high and low selection lines in terms of rosette diameter and height in both populations (Table 1).
Table 1 - Selection differential (S), response to selection (R) and heritability (h²) for every selection line. Weak selection: selection by truncation of the upper and the lower third (n = 60) of Arabidopsis thaliana plants ranked by trait values to compose high and low selection lines (HSL and LSL, respectively). Strong selection: same method but selecting by truncation of the upper and lower ca. 11% (n = 20) of plants. Values in bold are true estimates of selection differentials or statistically significant responses to selection and heritability estimates. Other values in italics should be considered non-significantly different from zero. R is presented as trait change in trait units (g, cm, d) and percentage change. Narrow-sense heritability (h²) calculated by the breeder’s equation is in fact broad-sense heritability (H²) in self-fertilizing plants. Selection was considered significant following a conservative approach avoiding sampling bias; when the 95% Confidence Intervals of average trait values estimated on the basis of 1000 bootstraps did not overlap between upper and lower selection lines (Table S6). Biomass: above-ground dry biomass (g). Diameter: rosette diameter (cm). Flowering time (d). Height: Height at first fruit (cm)
Weak selection | Strong selection | ||||||||||||
|---|---|---|---|---|---|---|---|---|---|---|---|---|---|
LSL | HSL | LSL | HSL | ||||||||||
Pop | Trait | S | R | H² | S | R | H² | S | R | H² | S | R | H² |
1 | Biomass | 0.07 | 0.01 (1%) | 0.09 | 0.07 | 0.01 (1%) | 0.13 | 0.16 | 0.02 (2%) | 0.1 | 0.14 | 0.01 (1%) | 0.06 |
Diameter | 0.87 | 0.42 (5%) | 0.48 | 0.89 | 0.41 (5%) | 0.46 | 1.90 | 0.59 (7%) | 0.31 | 1.74 | 0.66 (8%) | 0.38 | |
Flowering time | 1.36 | 0.85 (3%) | 0.63 | 1.34 | 0.80 (3%) | 0.60 | 2.65 | 1.28 (5%) | 0.48 | 3.41 | 1.81 (6%) | 0.53 | |
Height | 1.85 | 0.41 (4%) | 0.22 | 1.85 | 0.41 (4%) | 0.22 | 3.80 | 1.28 (11%) | 0.34 | 3.94 | 1.50 (13%) | 0.38 | |
2 | Biomass | 0.11 | 0.02 (3%) | 0.21 | 0.11 | 0.02 (3%) | 0.19 | 0.24 | 0.03 (4%) | 0.11 | 0.23 | 0.05 (7%) | 0.22 |
Diameter | 0.97 | 0.55 (6%) | 0.57 | 1.69 | 0.72 (8%) | 0.42 | 1.76 | 0.67 (8%) | 0.38 | 3.90 | 1.13 (13%) | 0.29 | |
Flowering time | 1.63 | 0.28 (1%) | 0.17 | 1.72 | 0.22 (1%) | 0.13 | 2.77 | 0.87 (3%) | 0.31 | 4.88 | 0.62 (2%) | 0.13 | |
Height | 2.11 | 0.99 (8%) | 0.47 | 1.91 | 0.90 (7%) | 0.47 | 4.05 | 2.04 (16%) | 0.50 | 4.60 | 1.47 (11%) | 0.32 | |
We found trait changes in response to selection for size traits in both replicate populations of epiRILs, changes for flowering time, but not under every selection treatment, and no change for biomass. Statistical significance was established by lack of overlap between 95% Confidence Intervals (CIs) of trait means, which is a conservative approach (Ho et al., 2019). Divergence was also found in most cases for the flowering time, with the exception of population 2 where it was non-significant after weak selection. This discrepancy between population 1 and 2 may be attributed to the different periods at which populations 1 and 2 were grown, and the longer storage of seeds before growing population 2 G0 plants, or the fact that populations 1 and 2 were made of a different set of epiRILs. No significant response to selection was detected for the above-ground biomass, in both populations at both selection intensities. The largest trait change after selection was found for height at first fruit, with a 16% reduction observed in the LSL and a 13% increase in the HSL, but most trait changes were around 3 to 8 percent (Table 1). Strong selection logically generated larger trait changes in response to selection, but also more variable and therefore less predictable selection responses (Wilson & Rambaut, 2008), as illustrated by larger 95% CIs (Table S6). Heritability, which is the heritable part of phenotypic variation that is available to selection, was estimated as the proportion of phenotypic variation available for selection to act upon by using the breeder’s equation (Lush, 1937). It was absent for biomass, which had not changed in response to selection, but relatively high for height at first fruit, rosette diameter and flowering time (ranging from 0.13 to 0.63, Table 1), all of which changed after selection.
DNA methylation stability across generations
We tested whether responses to selection are mirrored by changes in epigenetic allele frequencies at DMRs. After selection, we observed modifications of these frequencies (see the heatmap in Figure 2 presenting the average frequencies based on 1000 in silico replicates for all selection and control lines in each experimental population).
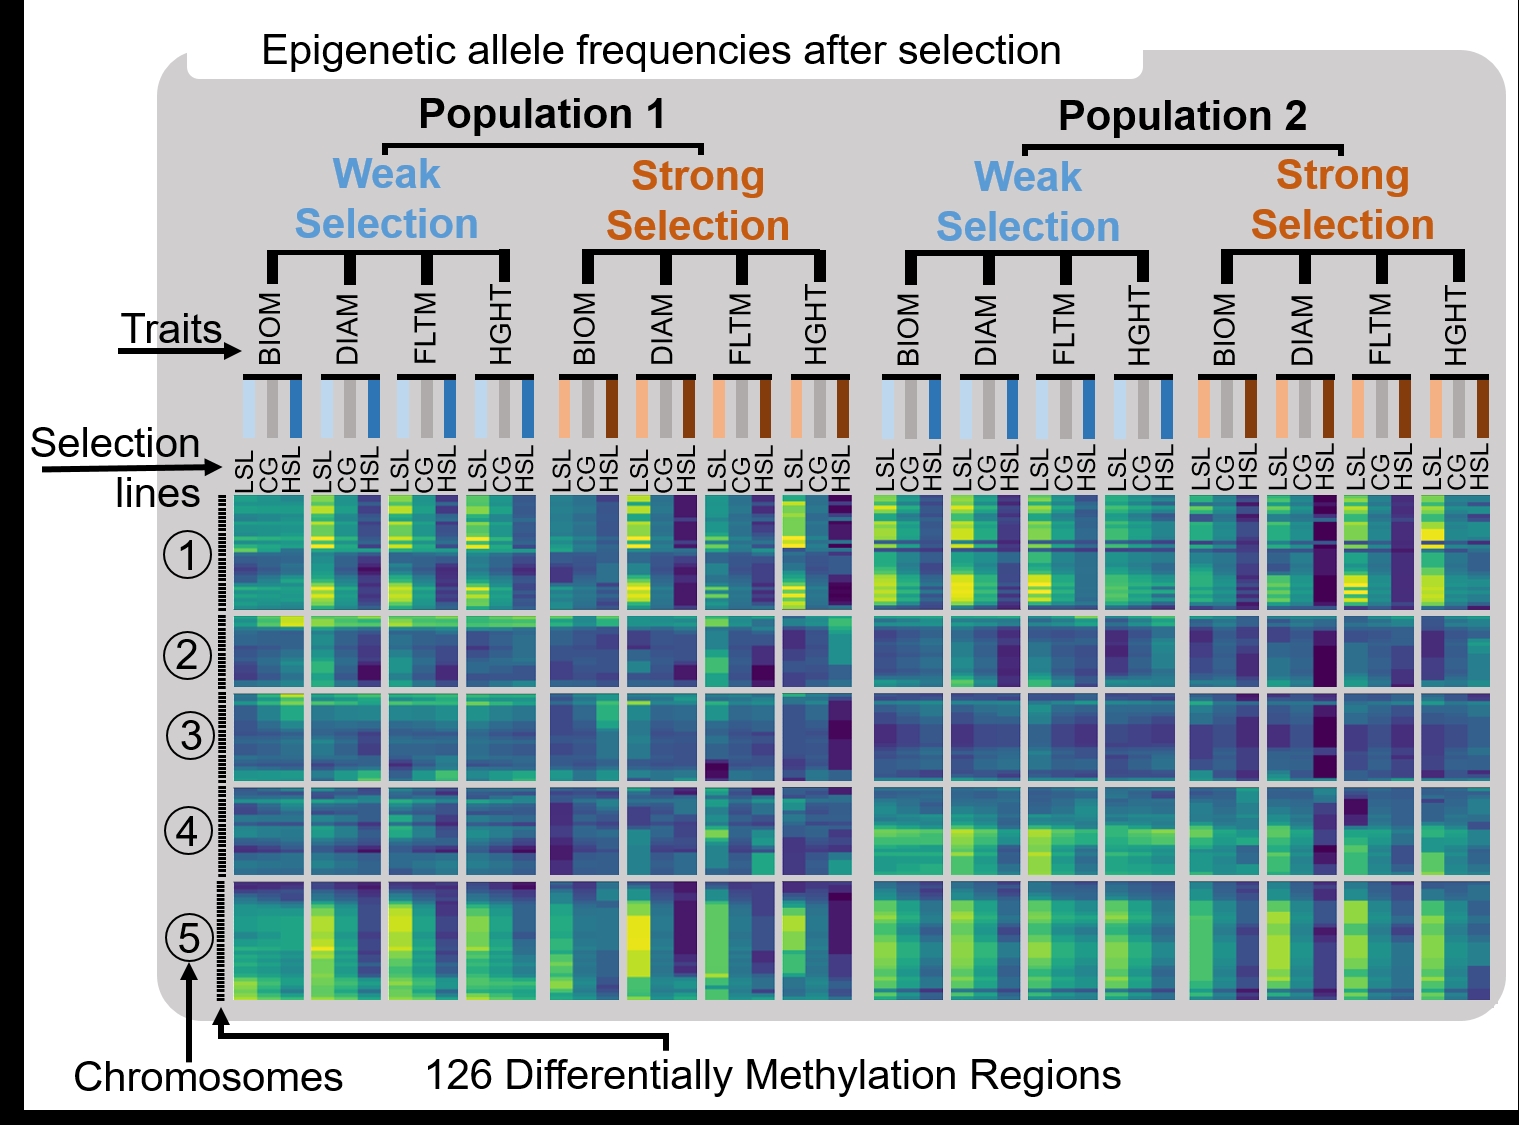
Figure 2 - Selection experiment drives changes in epigenetic frequencies. Changes in epigenetic allele frequencies after selection: The heat map presents DMR frequencies in G1 selection lines (LSL: low selection line and HSL: high selection line) and control groups (CG) for each of the four traits (BIOM: above ground dry biomass, DIAM: rosette diameter, FLTM: flowering time, HGHT: height of first silique) in populations 1 and 2. DMRs location on the five chromosomes are labelled on the left-hand vertical axis. Methylation frequencies of DMRs are represented by a colored band, with a gradient from blue (wild-type methylation status) to yellow (fixation of ddm1-2 mutant methylation status). In each panel, DMR frequencies on a given chromosome are presented for the low, control and high selection lines. Each column corresponds to a trait. Frequencies were estimated on the basis of 1000 bootstraps.
We used a Principal Component Analysis (PCA) to reduce the dimensionality of epigenomic data and summarize its variation distributed over the whole genome into 16 independent variables that can be statistically analyzed. We found significant epigenetic divergence after selection on rosette diameter and height at first fruit in both populations (lack of overlap between 95% confidence intervals for PCA coordinates on the first dimension, representing 18% and 22% of the global DMR variation in populations 1 and 2, respectively, other statistically significant PCA coordinates are not presented because they explained very little variation, Figure 3). Thus, the divergent selection for wider and narrower rosette diameters led to opposite changes in the frequency of cytosine methylations in the same genetic background. A similar epigenetic response to selection was observed after divergent selection for smaller and higher plant height at first fruit. Phenotypic selection for either increased or decreased above-ground biomass did not trigger a significant phenotypic change in response to selection. It was therefore not surprising to observe the absence of significant epigenetic divergence in this trait between selection lines. Interestingly, selection for earlier and later flowering plants, which had resulted in moderate responses to selection in population 1 and almost no response in population 2, did not drive statistically significant epigenetic changes (Figure 3).
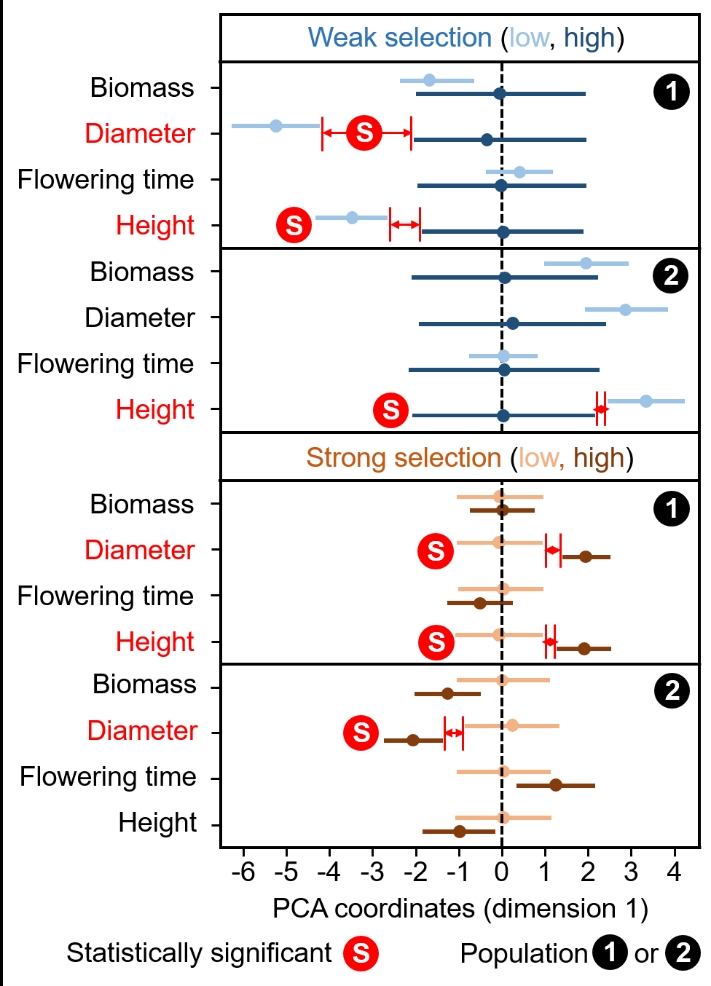
Figure 3 - Epigenetic divergence or its lack thereof between selection treatments. Epigenetic divergence for each Arabidopsis thaliana epiRIL population (pop 1 and 2), each trait, each selection strength (n = 60 for each line under weak selection, n = 20 for each line under strong selection), and line (high and low selection lines) of plants. Principal Component Analysis coordinates for the first dimension (PC1), which synthesizes 18% and 22% of the global DMR variation in populations 1 and 2 respectively, are presented with their 95% confidence intervals. Divergence was considered significant following a conservative approach avoiding sampling bias: when 95% Confidence Intervals of PC1 values estimated on the basis of 1000 bootstraps did not overlap between upper and lower selection lines. Significant epigenetic divergent responses to selection are shown in red.
Discussion
Theory predicts that selection can also act on transgenerational epigenetic variation, even without a contribution of genetic variation (Bonduriansky and Day, 2009, Danchin et al., 2011). Evidence for epigenetic divergence between populations sharing different histories of adaptation suggests such shaping of epigenetic trait variation by selection in both plants and animals (Herrera and Bazaga, 2010, Zhang et al., 2013, Baerwald et al., 2016, Groot et al., 2018, Schmid et al., 2018, Johnson and Kelly, 2020, Vernaz et al., 2021, Lemmen et al., 2022). Our selection experiment contributes to advancing this knowledge by providing a test confirming this expectation in real time over a single generation of selection, through the comparison of epiRIL experimental populations of A. thaliana surveyed before and after selection. Our results corroborate previous work on the inheritance of epiRIL trait variation (large heritability of height and flowering time) or lack thereof (negligible heritability of dry biomass) (Roux et al., 2011). We also found surprising results because rosette diameter, which was originally expected to lack heritability based on previous work (Roux et al., 2011), showed some ability to change under selection, which indicates heritability. Yet it is not rare to observe discrepancy between heritability estimates based on the phenotypic variation of related individuals and those based on the actual response to selection (Barton and Turelli, 1989, Pujol et al., 2018).
Our experimental results show that selection can act on stable transgenerational epigenetic variation presumably without a contribution of genetic variation. Our findings therefore imply the contribution of DNA methylation polymorphism to short-term adaptation in natural A. thaliana populations. It is reasonable to expect that the selection response observed here over one generation could be reproduced over several generations, as theory would predict for genetic variation. It is however difficult to predict whether this response would gradually decrease as a result of the erosion of DMRs underlying trait variation, or whether epistatic interactions between DMRs would maintain the amount of heritable variation. Much remains to be learnt about transgenerational mechanisms underlying the epigenetic response to selection. Highly demanding studies requiring high throughput phenotyping and epi-genotyping are needed to fill in this gap in the theory.
One of the limitations of our experimental setting is that it does not allow us to predict whether the epigenetic response to selection plays a predominant role in nature, where selection is a much more complex mechanism. In nature, selection will not target independently genetic and epigenetic components of fitness-related traits (Pujol et al., 2018). Natural selection will affect simultaneously all components of fitness variation, which encompasses tightly linked genetic and epigenetic variation, some reversible methylation patterns and hypomethylation driven release of TEs modifying the integrity of the genome structure.
One cannot exclude that high copy numbers of private TEs might affect the phenotype of a given epiRIL. Our findings imply that the likelihood is low and the potential effect greatly diluted by our resampling approach since the weight of a given epiRIL could only affect one thousandth of our result. Our selection experiment should therefore have mostly targetted epiRIL phenotypic variation directly caused by DMRs but caution is necessary because it may act occasionally on genomic variants caused by high copy number TEs, which release would be due to hypomethylation.
Our study in plants provides direct experimental evidence for heritable epigenetic changes in response to selection based on size. Lack of statistically significant epigenetic response for traits that changed in response to selection (Figure 3), in particular flowering time, may reflect that its epigenetic architecture consists of one to few loci whose variation was not captured by our statistical approach. Epigenetic allele frequencies at DMRs reflected divergent epigenetic changes in the progeny of high and low selection lines in each population, notably under strong selection (Figure 2). Since sets of epiRILs differed between populations, selection lines and control groups, it is therefore legitimate to observe different frequencies for a given trait or chromosome region between populations, and to denote the signature of selection depicted by a similar enrichment of epigenetic alleles on the heatmap (Figure 2).
Our study did not aim to infer which causal epigenetic variants were responsible for which phenotypic trait value, but rather to test for an epigenetic response to selection. It is nevertheless interesting to note that the range of artificially induced epigenetic trait variation in A. thaliana epiRILs is similar to the heritable fitness-related trait variation observed in divergent natural populations (Roux et al., 2011). Although the DNA methylation polymorphism of epiRILs is larger than what can be observed in natural populations (Becker et al., 2011), our results provide us with evidence that a range of trait epigenetic heritabilities can be used to predict a range of phenotypic changes in response to selection. Furthermore, as illustrated by Figure 2, LSLs tend to have higher DNA methylation state variability than HSLs, which appears to be mostly due to Chromosomes 1 and 5. In A. thaliana epiRILs, an increasing DMR frequency represents an increase in the proportion of ddm1-2 mutant epigenetic alleles in the population. LSLs therefore harbor more hypomethylated loci than control and HSLs harbor more hypermethylated loci in comparison to control. This finding suggests that our selection for bigger epiRIL plants that flower later selected against the hypomethylated nature of epiRILs that was artificially created by using the ddm1 mutation. The artificially induced global hypomethylation of the A. thaliana epiRIL genome produced smaller plants flowering earlier. In fact, we selected for epigenomes and phenotypes that are closer to wild-type plants.
The scope for replication in other species of our proof of concept experimental approach is limited. This is because EpiRIL biological material is only available in very few species (Roux et al., 2011, Colomé-Tatché et al., 2012). Heritable epigenetic variation for traits influencing fitness under environmental changes nevertheless exists in both plants and animals (Johannes et al., 2009, Herrera and Bazaga, 2010, Zhang et al., 2013, Baerwald et al., 2016, Groot et al., 2018, Schmid et al., 2018, Johnson and Kelly 2020, Vernaz et al., 2021, Lemmen et al., 2022, Stajic and Jansen 2021), suggesting that our finding may be a common feature in many species. Other species harboring transgenerational epigenetic variation for fitness-related traits may benefit from this additional source of short-term adaptive or breeding potential (Kakoulidou et al., 2021, González-Recio et al., 2015).
Acknowledgements
We thank Prof. Doyle McKey, Prof. John Pannell, Dr. Clément Lafon-Placette and Dr. Fabrice Roux for their comments on the manuscript, Y. Marie for the Enzymatic Methyl-sequencing (EM-seq) conducted by the IGen Seq platform (ICM, Paris, France), C. Chaparro (IHPE, Perpignan) for advice on the bioinformatic analysis of EM-seq data on the IHPE Galaxy platform, C. Grunau (IHPE, Perpignan) for animating discussions in the research network GDR 3E (Epigenetics in Ecology and Evolution) and the members and coordinators (including S. Maury) of the COST action (European Cooperation in Science and Technology) EPIgenetic mechanisms of Crop Adaptation To Climate cHange (EPICATCH)—grant number CA19125 for discussions.
Preprint version 2 of this article has been peer-reviewed and recommended by Peer Community In Evolutionary Biology (PCI Evol Biol) (https://doi.org/10.24072/pci.evolbiol.100839; Edelaar, 2025).
Funding
This project has received funding from the European Research Council (ERC) under the European Union’s horizon 2020 research and innovation program (grant agreement No ERC-CoG-2015-681484-ANGI) awarded to BP.
Conflict of interest disclosure
The authors declare that they comply with the PCI rule of having no financial conflicts of interest in relation to the content of the article. Benoit Pujol is a recommender for several Peer Communities (PCI Evol Biol, PCI Ecology and PCI Registered Reports).
Data, scripts, code, and supplementary information availability
Data are available online: The EM-seq data used in this study are available on the NCBI bioproject online repository. The names of the repository/repositories and accession number(s) can be found below: https://www.ncbi.nlm.nih.gov/bioproject/PRJNA773039. Other data, scripts, code and supplementary information are available from the Zenodo Digital Repository https://doi.org/10.5281/zenodo.7603324 (Pujol et al., 2025). Correspondence and requests for the seed material of the 123 epiRILs - see Table S5 in Colomé-Thatché et al., (25) for a list of accession names - should be addressed to the Institute Jean-Pierre Bourgin (IJPB - UMR1318 INRAE-AgroParisTech, Versailles, France, https://publiclines.versailles.inrae.fr/catalogue/epiril). No material transfer agreement is necessary for scientific work on accessions of the model plant Arabidopsis.