
 CC-BY 4.0
Introduction
To describe and compare the dynamics of the systems they study, ecologists often rely on movement analogies. For example, the composition of different ecological communities may change over time and, if similarity increases, the communities can be said to have converged (Fukami et al., 2005; Li et al., 2016; McLean et al., 2019). The notions of convergence or divergence in ecological systems can thus critically inform on the underlying ecological mechanisms (Vellend, 2016). Convergence may be interpreted as a symptom of a common selective mechanism, while divergence may be seen as indicative of drift or priority effects (Fukami et al., 2005). Here we argue that movement analogies can be expanded beyond convergence and divergence as a richer descriptive tool for ecological dynamics. For instance, a widespread result of global warming is the poleward displacement of species distributions (i.e. tropicalization and deborealization, Chust et al., 2024; Maire et al., 2019; McGinty et al., 2021). Broadly speaking, the communities inhabiting polar latitudes increasingly resemble communities from temperate latitudes. However, temperate latitudes communities also change, progressively increasing their resemblance to tropical latitudes communities. The best movement analogy for such a pattern may not be convergence or divergence but “pursuit” with polar regions pursuing temperate regions, which are themselves pursuing tropical regions in terms of community composition. Convergence and divergence can therefore be seen as facets of a richer ensemble of movement analogies that can be used to describe how two ecological entities change with respect to one another (i.e. to describe their relative movements; Dodge et al., 2008) including relationships such as “pursuit” or “parallel” movements. Once this diversity of relative movements is recognized, the question of their formal description and detection emerges.
One promising way to formalize ecological dynamics with the aim of describing their relative movements is the framework of Ecological Trajectory Analysis (ETA; De Cáceres et al., 2019; Sturbois et al., 2021). In ETA, a trajectory represents the temporal dynamics of a given ecological entity (e.g. a community) as a set of temporally linked ecological states (i.e. points) in a multidimensional space. Importantly, trajectories are considered in the full multidimensional space without dimensionality reduction, although ordinations are commonly used for visualization. This has the benefit of conserving all information when studying complex multidimensional datasets with this approach. Moreover, trajectories in ETA are computed from distances between pairs of ecological states, allowing the framework to flexibly accommodate many types of ecological data using adapted distance metrics (De Cáceres et al., 2019; Legendre & De Cáceres, 2013). Applications of ETA range from community ecology to stable isotopes analyses through paleoecology (de la Casa et al., 2025; Fentimen et al., 2026; Sturbois et al., 2022; Tye et al., 2024). Extensions of ETA, or adjacent frameworks allow taking account of reference ecological conditions (Sturbois et al., 2023), work with cyclical dynamics (Djeghri et al., 2026a), or define and characterize dynamic ecological regimes (Sánchez-Pinillos et al., 2023). Importantly for the purposes of the present work, ETA emphasizes and allows formal description and comparison of the direction, size, speed and shape of ecological trajectories making it the right framework to study trajectory relative movements.
In the original ETA framework (De Cáceres et al., 2019), relative trajectory movements were only approached through the application of symmetric and asymmetric convergence tests based on the Mann-Kendall trend test (Mann, 1945). Initially, the two convergence tests were presented as alternatives that may be used if the two studied trajectories have synchronous sampling times (both symmetric and asymmetric tests possible) or not (asymmetric test only). However, the authors noted that these tests do not assess the same aspects of convergence. The symmetric test assesses if the two trajectories become closer over time, while the asymmetric test assesses if one trajectory becomes closer to any part of the other trajectory.
Here, we argue that combining different statistical tests allows distinguishing not only convergence and divergence, but also diverse relative movements relationships such as “pursuit”, “catch-up” or “parallel” movements. We refer to this approach as Relative Trajectory Movement Assessment (RTMA). In the sections below we present the two convergence tests existing in ETA and propose a new complementary test of trajectory dynamic correspondence. We then show how combining those tests allows us to build RTMA. We provide an evaluation of RTMA against simulated trajectories, demonstrating its ability to distinguish different patterns of relative trajectory movements. We then apply RTMA to two real ecological datasets on 1) old field compositional succession and 2) temporal change in forest size structure to show how it can be used to describe ecologically relevant patterns and processes.
Assessing the relative movements of trajectories
Trajectories and convergence tests in Ecological Trajectory Analysis
In Ecological Trajectory Analysis (ETA), an ecological trajectory T is defined as the set {x1, …, xn} of time-ordered ecological states x, with n the size of T (De Cáceres et al., 2019). The ecological states are points in a multidimensional space where distances between any two points x1 and x2 are specified using an appropriate distance metric d(x1, x2) (see Legendre & De Cáceres, 2013 for a review of some distance metrics useful in ecology and their properties). Trajectories can also be viewed as set of directed segments {s1, …, sn-1} linking consecutive ecological states. In ETA, the distance between an ecological state and a trajectory Dpt(x, T) is defined as the shortest distance between x and any points or segments belonging to T (ecological state-to-segment distances being computed by orthogonal projection; a more detailed description is given in De Cáceres et al., 2019).
In the original ETA (De Cáceres et al., 2019), the relative trajectory movements of two given trajectories TA = {xA1, …, xAn} and TB = {xB1, …, xBn} of the same size n can be approached using two different convergence tests:
The symmetric convergence test is a Mann-Kendall test performed on the series {d(xA1, xB1), …, d(xAn, xBn)} of pairwise distances between the successive ecological states from the two trajectories (Figure 1a). A negative tau statistic indicates convergence, while a positive tau indicates divergence.
The asymmetric convergence test of TA approaching TB is a Mann-Kendall test performed on the series {Dpt(xA1, TB), …, Dpt(xAn, TB)} of distances between the ecological states of TA and TB (Figure 1b). A negative tau statistic indicates that TA approaches TB, while a positive tau indicates that TA is moving away from TB. The converse asymmetric convergence test assesses whether TB is approaching TA (Figure 1c).
Dynamic correspondence test
In cases where two trajectories neither converge nor diverge, they may still present ecologically relevant, non-random relative movements. This importantly occurs when the two trajectories follow a similar-shaped path travelling side-by-side in the same direction or in opposite directions. We term such relative movements “parallel” and “antiparallel” respectively.
To complement the convergence tests and allow tackling the question of trajectory parallelism we propose the “dynamic correspondence test” performed between two trajectories TA and TB with the same number n of ecological states. We name its test statistic upsilon (υ) and define it as:
\(\upsilon = \sum_{i = 1}^{n}{\mathbb{d}\left( x_{Ai},x_{Bn - (i - 1)} \right)} - \sum_{i = 1}^{n}{\mathbb{d}\left( x_{Ai},x_{Bi} \right)}\)
In this statistic, the right-hand member represents the sum of the same distances as used in the symmetric convergence test. This member will be low if the two trajectories follow a similar shaped path in the same direction and high otherwise. The left-hand member represents the sum of distances between ecological states “opposed in time” in the two trajectories (i.e. distances between first and last ecological state, between second-to-first and second-to-last ecological states etc. of TA and TB). This member will be low if the two trajectories follow a similar path in opposed directions and high otherwise. Therefore, upsilon will be high and positive if the two trajectories follow a similar-shaped path in the same direction (Figure 1d) and will be low and negative if the two trajectories follow a similar-shaped path in opposite directions (Figure 1e). upsilon is tested by independent permutation of the ecological states order within the two trajectories, effectively breaking the cross-correlation between the two trajectories. The null hypothesis underlying this permutation scheme is therefore that the two trajectories do not follow a similar path (in same or opposite direction). This simple permutation scheme has the drawback of breaking autocorrelation within trajectories but allows working with relatively short trajectories where implementing more complex permutation scheme is impractical.
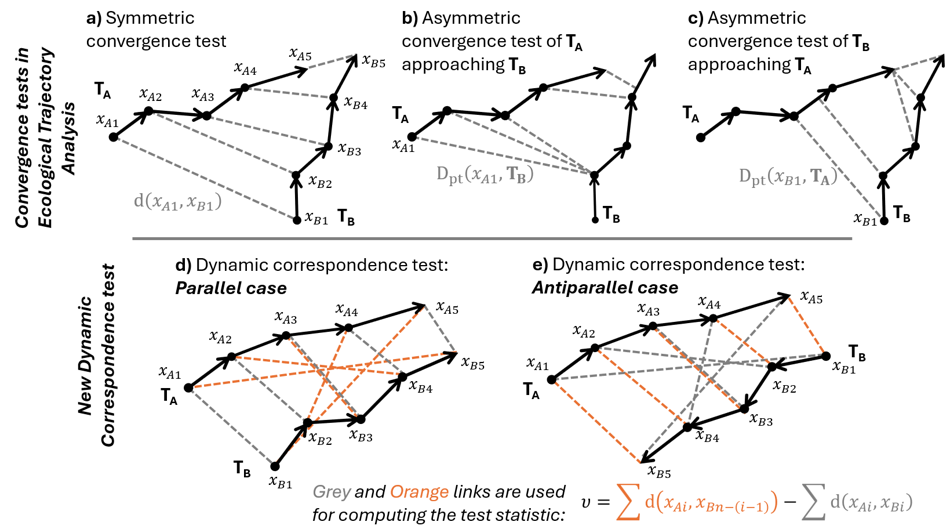
Figure 1 - The four different tests available in Ecological Trajectory Analysis (ETA) to assess the relative movement of two trajectories, TA and TB, of the same size. Three convergence tests were already described in De Cáceres et al. (2019): The symmetric convergence test (a), the asymmetric convergence test of TA approaching TB (b), the asymmetric convergence test of TB approaching TA (c). ETA convergence tests are based on Mann-Kendall trend tests realized on different series of distances (grey links, only first distance formula noted). We provide a new dynamic correspondence test (d and e) whose statistic upsilon (υ) relies on the comparison of two sets of distances (in grey and orange).
We used simple simulated trajectory pairs to assess the behavior of the dynamic correspondence test in more detail and present the results in Appendix S1. Our simulations reveal that the dynamic correspondence test yields a correct type 1 error and that it finds significant results under a broad scope of situations (varying the two trajectories relative position, shape, main direction…). Used on its own, the dynamic correspondence test should therefore not be seen as a diagnostic tool for parallel or antiparallel movements (see following section for the combination of this test with the convergence tests). Instead, the dynamic correspondence test is a way to telling whether two trajectories have broadly the same (positive upsilon) or opposed (negative upsilon) direction of travel. For more complex shaped trajectories that lack overall directionality (i.e. trajectories that present many turns), the dynamic correspondence test will be more sensitive to trajectory shapes.
Relative Trajectory Movement Assessment (RTMA)
Recapitulating the previous sections, four tests can be used to evaluate the relative movement between two given trajectories of same size TA and TB: 1) the symmetric convergence test between TA and TB, 2) the asymmetric convergence test assessing if TA approaches TB, 3) the asymmetric convergence test assessing if TB approaches TA and 4) the dynamic correspondence test between TA and TB. We show below how combining the results from those four tests allows devising a classification scheme for the relative movement relationships of trajectory pairs that go beyond classic convergence and divergence. We refer to the combination of the four tests and to the subsequent classification as Relative Trajectory Movement Assessment (RTMA).
For a given trajectory pair, RTMA starts by performing the four tests described above. Multiple testing is accounted for by applying the Šidák correction (Šidák, 1967) to the alpha levels. Since this correction is rather conservative, the minimum trajectory size that might yield significant result at alpha = 0.05 is n = 6. Once the tests have been computed, RTMA uses their results (i.e. significance against a chosen alpha level, and the sign of their statistics) to classify and assign a label to each trajectory pairs meant to describe their geometric configuration by analogy to familiar relative movements (e.g. “pursuit”, see below). RTMA labels are thus purely descriptive summaries of the combined results of four statistical tests. Importantly, this means that the labels given by RTMA are not independently tested. Further, we stress that RTMA labels are only descriptive of the joint geometry of the two trajectories and do not imply causal links.
Formally, each test performed during RTMA can yield three results (either non-significant, significant with positive statistic, or significant with negative statistic) amounting to 34 = 81 possible combinations. However, not all combinations are equally probable. Many are symmetric counterparts (i.e. trajectory A approaching trajectory B is conceptually the same as trajectory B approaching trajectory A) and the dynamic correspondence test becomes irrelevant once convergence or divergence has been detected. As a result, we propose a taxonomy of 9 trajectory relationships recognized by RTMA: Parallel, Antiparallel, Convergence, Divergence, Approaching, Departing, Pursuit, Catch-up and Escape. If no test is found to be significant, RTMA labels the relationship as “non-significant”. The details of the relationships and their formal detection criteria are given in Table 1. Some relationships exist in “weak” versions, characterized by the relaxation of one of the statistical test requirements (Table 1). These weak versions of relationships denote that different combinations of significant tests can occur in qualitatively similar situations. Within RTMA, the dynamic correspondence test results are only useful if no significant convergence or divergence has been found, restricting its application to the detection of Parallel or Antiparallel relationships (Table 1) and solving the limitation posed by convergence tests (see section “Dynamic correspondence test”). Performing RTMA can thus be understood as navigating a network of statistical tests results that allow the attribution of a relationship to a pair of trajectories (Figure 2). Some combinations are not covered in Table 1 because they are deemed unlikely from a conceptual perspective (e.g. convergence found by the symmetric test with divergence found by both asymmetric tests). RTMA labels these as “unknown” when they occur.
The relationships recognized by RTMA can further be grouped to describe some important, high-order, properties. We recognize three higher-order groups that are not always mutually exclusive (Table 1, Figure 2):
• the Convergence group (Convergence and Approaching and their weak versions, as well as Catch-up) groups relationships where the distance between the two trajectories broadly decreases over time.
• the Divergence group (Divergence and Departing and their weak versions, as well as Escape) groups relationships where the distance between the two trajectories broadly increases over time.
• the Oriented group (Approaching and Departing and their weak versions, as well as Catch-up, Pursuit, and Escape) groups relationships where there is a qualitative asymmetry in the role of the two trajectories. Formally, oriented group relationships have either, only one significant asymmetric convergence test, or two significant asymmetric convergence tests with opposed tau. Many pairs of words may be adapted to describe the asymmetric roles of the two trajectories depending on the exact relationship (i.e. leader/follower, target/approacher…). For simplicity, we choose to use the terms of “back” and “front” trajectories to distinguish the two roles in the general case (see visualization in Table 1).
Table 1 - Typology of relative movement relationships recognized in Relative Trajectory Movement Assessment (RTMA) and formal detection method combining results from four statistical tests. In relationships belonging to the oriented group, the illustration depicts the “back” trajectory in black and the “front” trajectory in grey. Weak versions of some relationships exist when less restrictive test combinations can emerge from situations close to the archetype.
| Relative movement relationship | Symmetric convergence test | Asymmetric convergence tests (×2) | Dynamic correspondence test | Group(s) | Archetype (used in simulations) |
|---|---|---|---|---|---|
| non-significant | Non-significant | Both non-significant | Non-significant | No group, Null Hypothesis for RTMA |  |
| Parallel | Non-significant | Both non-significant | Significant, positive upsilon | No group | 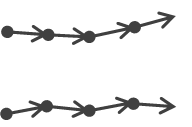 |
| Antiparallel | Non-significant | Both non-significant | Significant, negative upsilon | No group | 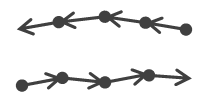 |
| Convergence (and Weak Convergence 1 & 2) | Significant, negative tau (non-significant in Weak Convergence 2) | Both significant with negative tau (both non-significant in Weak Convergence 1) | Not applicable | Convergence group | 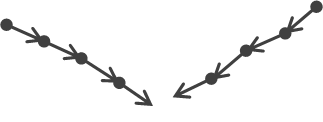 |
| Divergence (and Weak Divergence 1 & 2) | Significant, positive tau (non-significant in Weak Divergence 2) | Both significant with positive tau (both non-significant in Weak Divergence 1) | Not applicable | Divergence group | 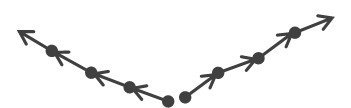 |
| Approaching (and Weak Approaching) | Significant, negative tau (non-significant in Weak Approaching) | One significant with negative tau | Not applicable | Convergence group & Oriented group | 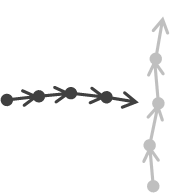 |
| Departing (and Weak Departing) | Significant, positive tau (non-significant in Weak Departing) | One significant with positive tau | Not applicable | Divergence group & Oriented group | 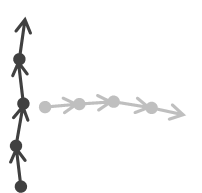 |
| Pursuit | Non-significant | Both significant with opposed tau | Not applicable | Oriented group |  |
| Catch-up | Significant, negative tau | Both significant with opposed tau | Not applicable | Convergence group & Oriented group |  |
| Escape | Significant, positive tau | Both significant with opposed tau | Not applicable | Divergence group & Oriented group |  |
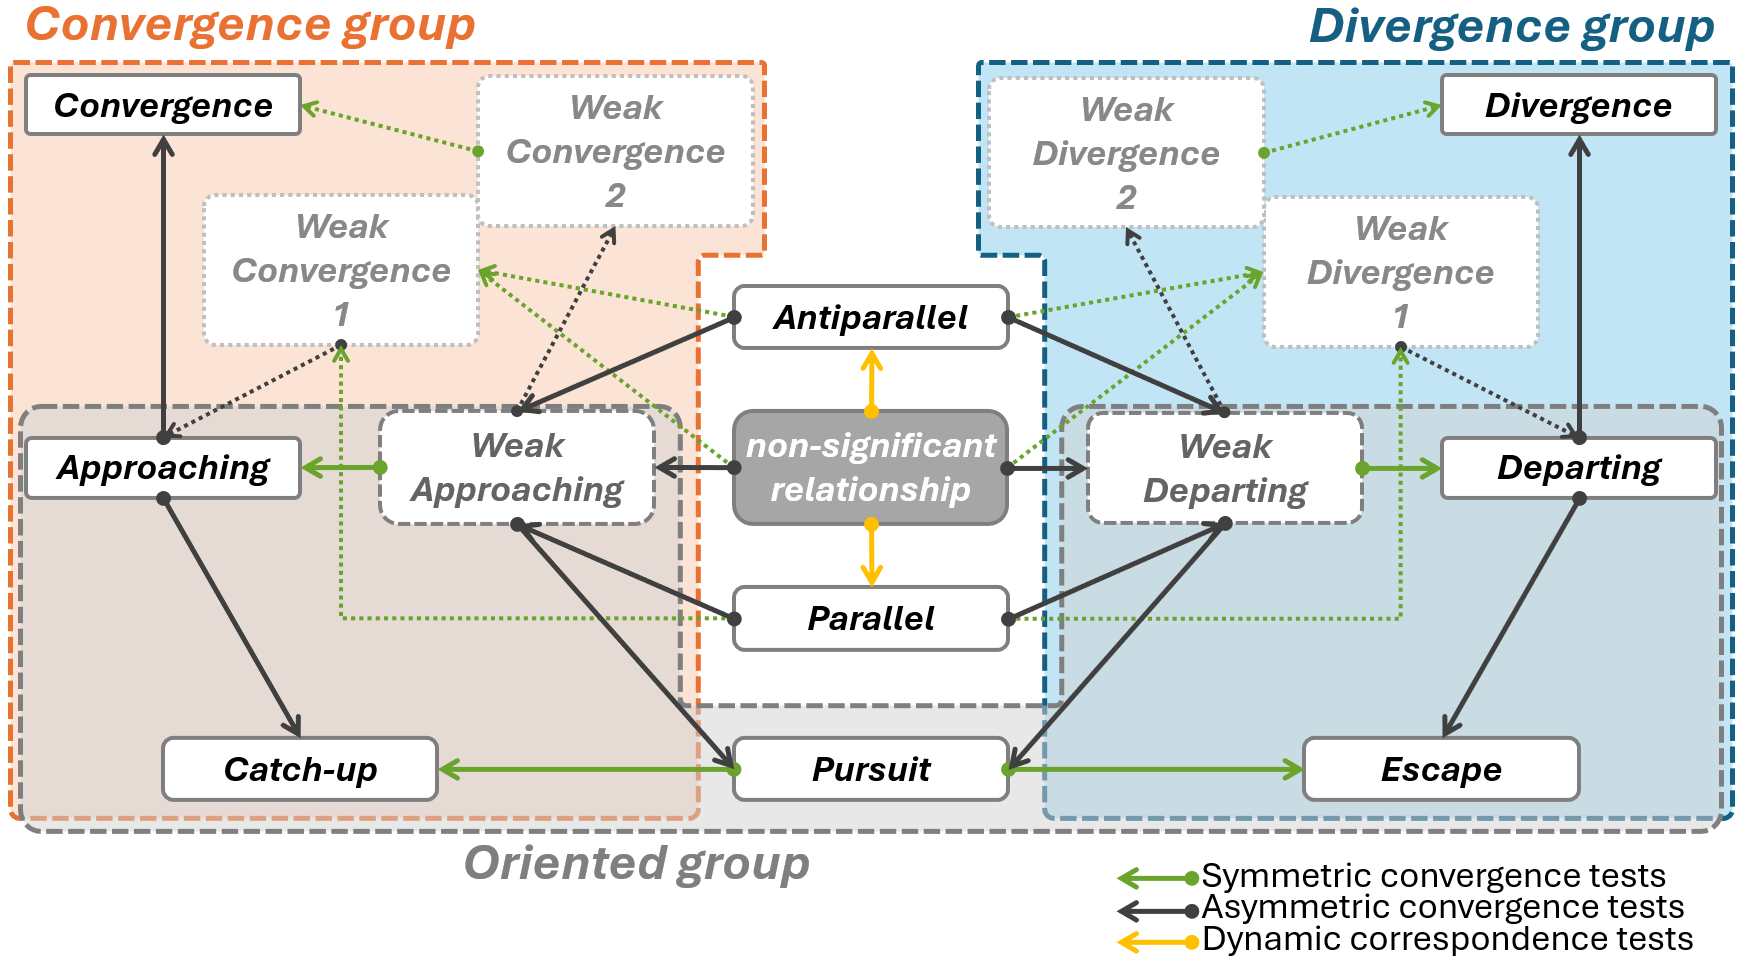
Figure 2 - Directed network showing how the different relative trajectory movement relationships (nodes) recognized by Relative Trajectory Movement Assessment (RTMA) are related to one another through statistical tests (arrows, pointing toward the relationship where the test is significant). Relationships “Convergence”, “Divergence”, “Approaching”, and “Departing” exist in weak versions (lighter-colored, dotted nodes). Three groups of relationships recognized by RTMA are highlighted as large colored boxes.
Simulation study
To evaluate the performance of RTMA under known relative movement relationships, we simulated pairs of trajectories for each of the ten archetypes of relative movement illustrated in Table 1 (corresponding to the nine relationships of RTMA plus a simulation of a “neutral” archetype used to illustrate an idealized non-significant relationship). Each archetype was tested under five levels of trajectory sizes (i.e. the number of ecological states constituting the trajectory), and five levels of sampling noise (independent Gaussian error term added). For simplicity, trajectories were defined in two dimensions, but noise effects were evaluated in 2, 5 and 20 dimensions. In each combination of simulated archetype, level of trajectory size, and noise, we ran 1000 replicates and assessed whether RTMA was able to recover the correct relationship given the archetype tested (Appendix S2, the number of permutations for the dynamic correspondence tests was set at 999).
In general, the simulation study demonstrated satisfactory behavior of RTMA for the ten archetypes (Figure 3). In terms of type 1 error, the method tends to be overly conservative with the Neutral archetype being considered non-significant in systematically more than 95 % of cases at alpha = 0.05 (Figure 3). As expected, detection of trajectory relationships was in all cases impaired by small trajectory size and high levels of noise (Figure 3). Increasing the dimensionality of noise (5 and 20 dimensions) had an effect similar to increasing noise while maintaining the same number of dimensions (Appendix S2). In our simulations, detection sensitivity of RTMA varied among trajectory relationships with Parallel and Antiparallel relationships being more consistently detected than others (detection over wider noise and trajectory size conditions, Figure 3). Our simulations further showed that, when RTMA fails to detect the correct relationships at a high level of noise and/or low sampling effort, it correctly attributes them a non-significant relationship in most cases (Appendix S2). Moreover, when an incorrect relationship attribution occurs, it generally involves a similar relationship (e.g. Divergence may be wrongly detected as Departing but not as Approaching or Pursuit; Catch-up may be detected as Approaching or Pursuit but not as Departing: details in Appendix S2). The most commonly misattributed relationships were weak versions of the Approaching and Departing relationships (Appendix S2). Because these relationships are very central in the network of tests that RTMA represents (they have the most connections with other relationships, Figure 2), it is likely that an error in one statistical test drives RTMA to characterize a relationship as either weak approaching or weak departing. Finally, combinations that were deemed unlikely and hard to interpret when designing RTMA (i.e. RTMA assigning “unknown”) were, as expected, very rare in our simulations.
Software
Functions performing and providing graphical representation for RTMA (see the ecological examples) have been developed in the R language (R Core Team, 2025) and included in the ecotraj package (De Cáceres et al., 2025) from version 1.2.1 available on CRAN and GitHub repositories (https://emf-creaf.github.io/ecotraj/).
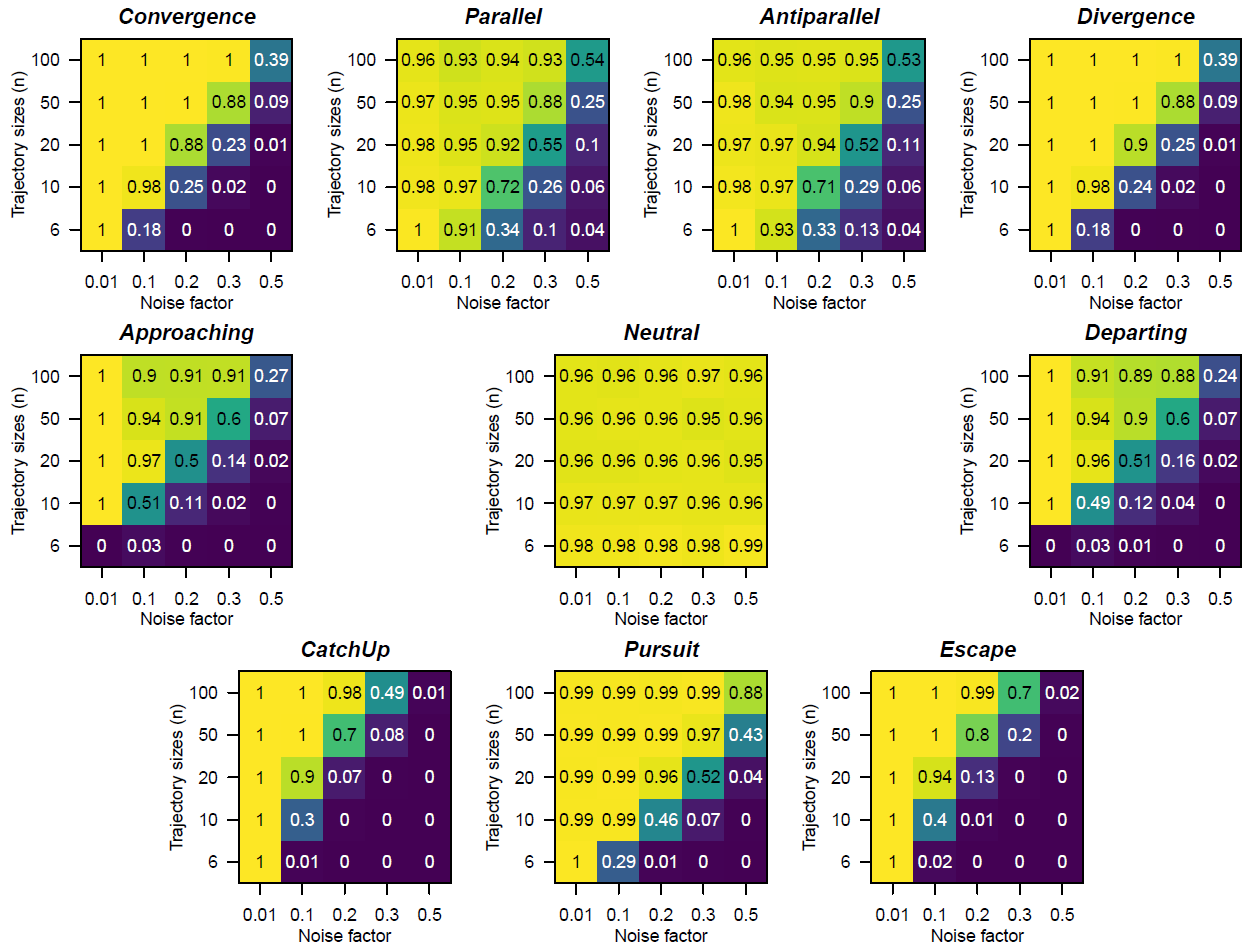
Figure 3 - Proportion of correct relationship attribution (over 1000 simulations) by Relative Trajectory Movement Assessment (RTMA) at alpha = 0.05 in pairs of trajectories simulated in two dimensions according to the 10 archetypes (see Table 1) with different trajectory sizes (y axes) and sampling noise (x axes). The Neutral archetype (middle) corresponds to the null hypothesis for RTMA and is the outcome considered correct when RTMA returns a non-significant result.
Ecological applications
Field-to-forest vegetation succession
To show how Relative Trajectory Movement Assessment (RTMA) is useful in ecological research, we first apply it to a dataset depicting secondary vegetation succession (Poorter et al., 2023). Secondary succession, in its most classic form, is a process in which a disturbed plant community changes over time from an unvegetated state to a forested state. Secondary succession is a well-known and fairly predictable ecological process with species marked by different traits successively dominating a plant community (from herbs to shrubs to trees, Meiners et al., 2015). The well-known and predictable nature of secondary succession (Myster & Pickett, 1990) makes it a good process for illustrating RTMA.
We use data from the Buell-Small Succession Study (BSS), a monitoring program that follows 10 fields (termed C3, C4, C5, C6, C7, D1, D2, D3, E1 and E2) in New Jersey, USA, 40°30’ N, 74°34’ W, from their agricultural abandonment between 1958 and 1966 to a late successional stage in 2025 (Meiners et al., 2015). Each BSS field is sampled at 48 permanent locations (1 m² plots) where plant community composition is measured as species percent coverage. The sampling frequency was annual at the start of the series (1958-1979) and switched to alternate years from 1980 onwards, with half of the field sampled on odd years, the other half on even years. Here, we average plot data at the field level and express dissimilarity between plant communities as percentage difference (alias Bray-Curtis dissimilarity; Bray & Curtis, 1957; Odum, 1950;), resulting in one trajectory per BSS field.
To more precisely illustrate how RTMA documents secondary succession, we divided each trajectory into four sub-trajectories, representing different successional stages defined by field age (Meiners, 2007; Myster & Pickett, 1990; Yurkonis & Meiners, 2006; Figure 4a). “Early succession” (2-14 years after abandonment) captured the transition from short-lived herbaceous plants like Ambrosia artemisiifolia and Daucus carota to perennial herbs such as Solidago sp. and Fragaria virginiana. “Middle succession 1” (years 15-28) was when opportunistic woody species such as Rubus allegheniensis, Rosa multiflora and Lonicera japonica became abundant displacing perennial forbs. “Middle succession 2” (years 29-42) represented canopy closure by early successional trees like Juniperus virginiana and Cornus florida. Finally, “Late succession” (years 43-56) was dominated by a canopy of Acer rubrum, Carya spp. and Quercus spp. With an understory dominated by Ageratina altissima. The sub-trajectories are built so that they have the same number of ecological states (n = 7), always separated by two years, making them all comparable with RTMA. A missing data point for field C4 at the late succession stage led us to exclude that sub-trajectory. The number of permutations for the dynamic correspondence test within RTMA was set to 999.
Visualization of the BSS trajectories and sub-trajectories through Principal Coordinate Analysis (PCoA) revealed a strong arch effect (Figure 4a), as expected in long ecological gradients with important species replacement (Legendre & Gallagher, 2001). The relative trajectory movement relationships detected by RTMA between the different sub-trajectories are presented in Figure 4b in a heat-map-like plot where each type of relationship is color coded and diagonal bars qualify oriented relationships. For instance, the relationship between early-succession trajectory C3 and early-succession trajectory C4 (two cells on both sides of the diagonal, top-left corner of the plot) indicates a weak convergence relationship (orange). This relationship is oriented, and the diagonal bar in the cell below the diagonal indicates that the corresponding row trajectory is “in front” (here early-succession trajectory C4). Broadly, the features revealed by RTMA in Figure 4b are consistent with expectations of secondary succession. First, when comparing sub-trajectories representing the same successional stages (groups highlighted by black boxes along the diagonal of Figure 4b), we see a dominance of Parallel relationships in early and mid-successional stages, and of non-significant relationships in later successional stages. This is consistent with communities from different fields following similar successional paths until reaching late successional stages where trajectories lose directionality as succession slows down communities stabilize (see also Li et al., 2016). When comparing sub-trajectories across different successional stages (away from the diagonal in Figure 4b) we find a dominance of the Approaching relationship and its weak version, both belonging to the oriented and convergence groups. Importantly, in the oriented group relationships, the trajectory in front was always a later successional stage, reflecting the strong directionality of succession (Figure 4b). Taken together, the high directionality of succession and the strong dominance of relationships from the convergence group suggest that the process slows down over time, again consistent with expectations on secondary succession and previous studies on this system (Anderson, 2007; Li et al., 2016; Myster & Pickett, 1994).
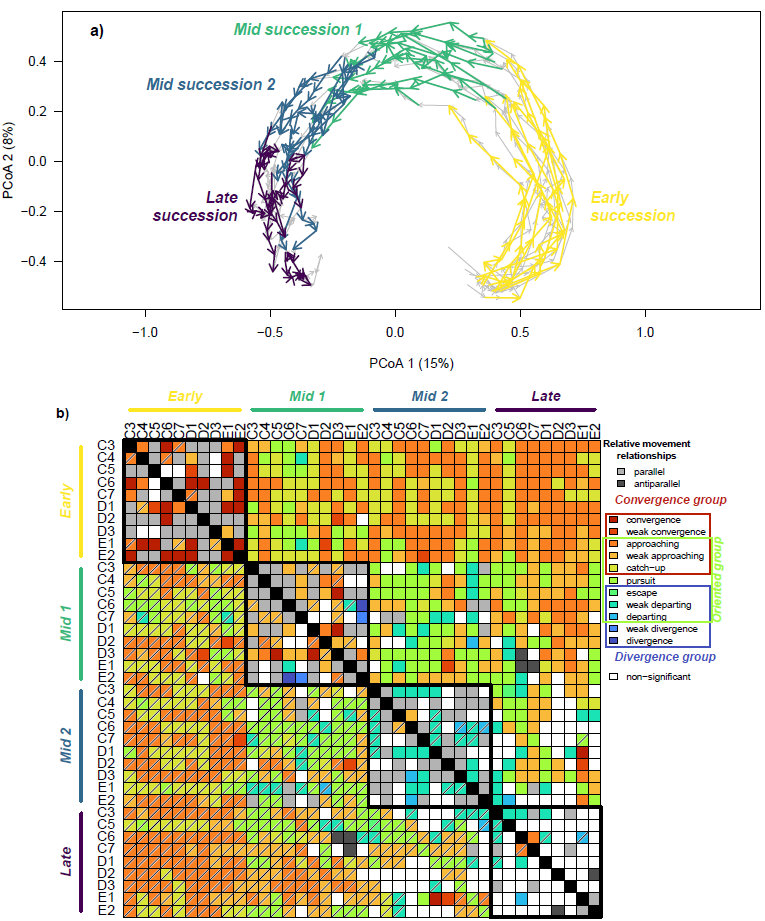
Figure 4 - Application of Relative Trajectory Movement Assessment (RTMA) to field-to-forest secondary succession in plant communities sampled at the Buell-Small succession study (New Jersey, USA) between 1958 and 2025. a) main trajectories and sub-trajectories corresponding to different successional stages represented using Principal Coordinate Analysis (PCoA). b) RTMA results establishing the different relative movement relationships (see legend) between the sub-trajectories. Barred cells indicate that the corresponding row sub-trajectory is the “front” trajectory in an oriented relationship.
Forest size structure dynamics
At its core, RTMA labels the relative movement of pairs of trajectories with a verbal descriptor. One limitation of such labelling may occur when studying large datasets with many trajectories where it is not obvious which trajectory comparisons are of interest. In this second ecological example, we show how this difficulty can be alleviated by combining RTMA with trajectory clustering. We revisit a dataset used in the original ETA paper (De Cáceres et al., 2019) describing temporal dynamics in the size-structure of monodominant mountain beech (Fucospora cliffortioides) forest plots in the Craigieburn Forest Park (Southern Alps, South Island, New Zealand, 43°10’ S, 171°35’ E; Harcombe et al., 1998). Trajectories in this dataset are primarily driven by tree growth and arrival of new recruits, particularly in response to disturbances (a snowstorm and associated pathogens in 1973; Harcombe et al., 1998 ; as well as a magnitude 6.7 earthquake in 1994; Allen et al., 1999) that left a legacy in the size structure of those forests (Coomes & Allen, 2007). Following De Cáceres et al. (2019), we use data from nine surveys (1970-1972, 1974, 1978, 1983, 1987, 1993, 1999, 2004 and 2009), from 250 plots representatively sampling the forest. The trunk diameter of each tree was measured and binned into 13 size classes (from 2.25 to 64 cm) to represent forest size structure. Abundances were log-transformed and dissimilarities between communities were computed as Manhattan distances according to their cumulative abundance profile, a method allowing to represent differences in size structure (De Cáceres et al., 2013). The dissimilarity between the trajectories of the different plots was then computed as symmetrized directed segment path dissimilarity DSDSP (De Cáceres et al., 2019), a dissimilarity measure that takes into account the shape, direction and position of ecological trajectories. We then used these dissimilarities to reproduce the 5 trajectory clusters obtained in (De Cáceres et al., 2019) by k-means clustering based on the SSI criterion. Instead of presenting all the RTMA relationships between individual trajectories, we focus on relationships between trajectories belonging to different clusters.
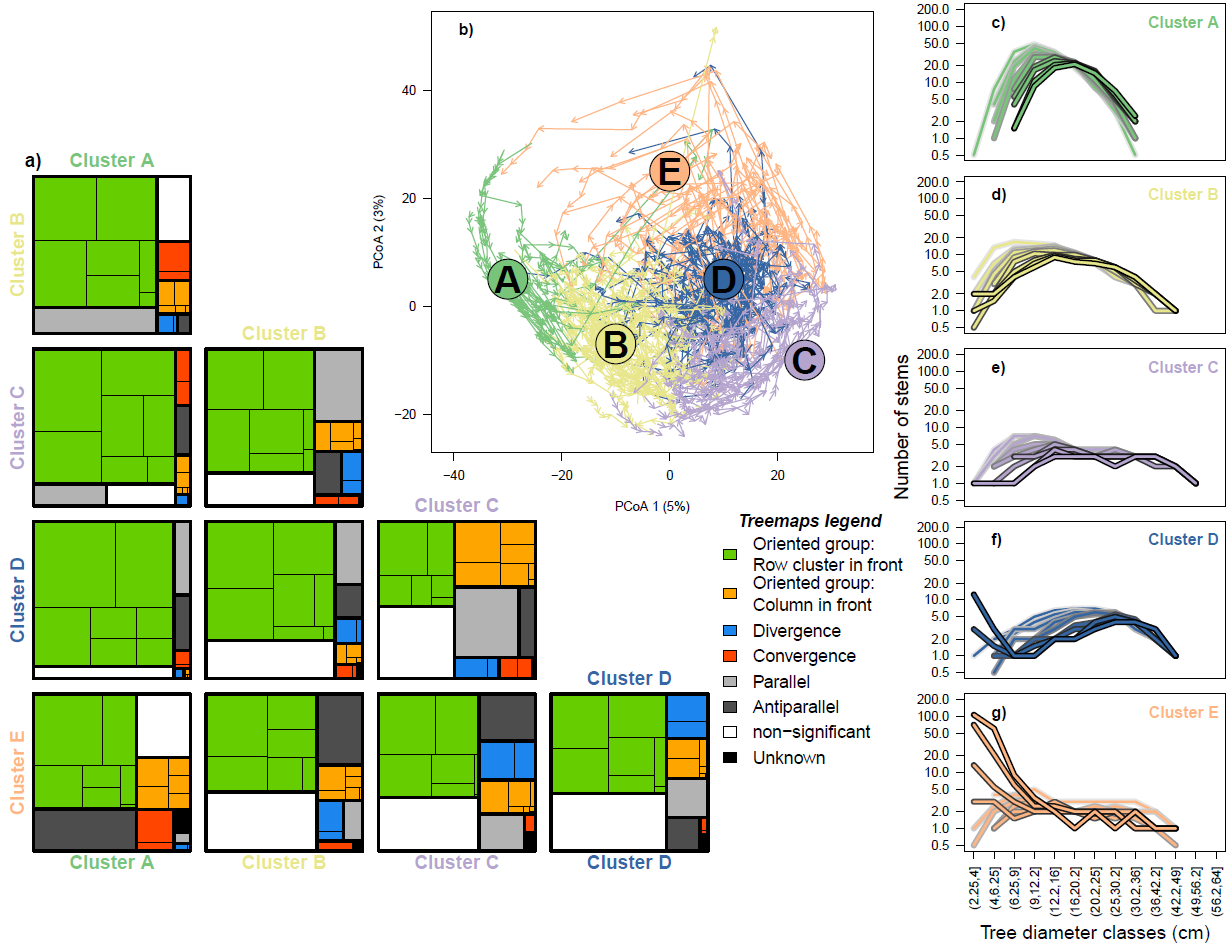
In Figure 5a, trajectory relationships obtained by RTMA (999 permutations for the dynamic correspondence test) are presented as treemaps showing the proportions of different relationships found between trajectories belonging to distinct clusters. The clusters themselves are presented in Figure 5b and the corresponding median tree community size structures in Figs. 5c-g. Different trajectory clusters occupy different positions in the PCoA space (Figure 5b). The treemaps show that oriented relationships are predominant (Figure 5a) and suggest that trajectory clusters are generally ordered A -> B -> C/D -> E from the most “in the back” to the most “in the front”. This progression corresponds to an increase in tree sizes and decrease in abundance (Figs. 5c-g) consistent with forest growth and self-thinning. It is moreover interesting to note that trajectories from cluster E are often involved in Antiparallel relationships with trajectories from other clusters (in particular cluster A, Figure 5a). Cluster E is characterized by many small trees and a few particularly large ones (Figure 5g), a size structure that may be explained by high mortality rates in large trees (Hurst et al., 2011) resulting in free space and light for new recruits. In this context, antiparallel relationships can be interpreted as a “return”, opposed to the main growth dynamic, and linked primarily to recruitment. RTMA therefore suggests that, in addition to the main dynamic of forest growth and self-thinning, an important proportion of trajectories from cluster E represent recruitment events allowing stand re-initiation after a gap-creating disturbance.
Figure 5 (next page) - Application of Relative Trajectory Movement Assessment (RTMA) to the size structure development of monodominant mountain beech forests in the Craigieburn Range (Southern Alps, South Island, New Zealand, 1970-2009). a) Treemaps representing the proportion of different RTMA relationships found between trajectories from five different clusters. The unlabeled rectangles correspond to individual relationships composing the groups highlighted by the treemaps. b) Principal Coordinate Analysis (PCoA) displaying the trajectories and the associated clusters. c-g) median size-structure in each of the cluster over time (lighter curves: beginning of the series, darker curves: end of the series).
Discussion
Using simulations and ecological applications, we have shown that the movement analogies used by ecologists to compare ecological dynamics can be enriched and diversified and that Relative Trajectory Movement Assessment (RTMA) is a valuable framework for this purpose. We believe RTMA creates a unique place among the tools and concepts available to ecologists, complementing the description of single trajectories (Bagchi et al., 2017; De Cáceres et al., 2019; Lamothe et al., 2019) and allowing finer interpretation of how two dynamics relate to each other. Nonetheless, we believe RTMA is not without limitations, of which the users should be well aware.
Limitations and recommendations
A first important limitation of RTMA is its categorical nature. Relationships between trajectories are expressed as verbal, categorical descriptors lacking a quantification of effect size (although the statistics of the different tests combined in RTMA are still available). Such quantification is complex as the relationships between two trajectories is multifaceted (e.g. difference in position, difference in main direction of travel (if any), difference in speed…) and how these different facets should be reflected or weighted is unclear. Although we believe the categorical labels provided by RTMA are already useful, further developments could therefore seek to make RTMA, or alternative frameworks investigating relative trajectory movements, more quantitative and continuous.
The second limitation of RTMA is that it fundamentally relies on Mann-Kendall trend tests and as such, it is not well suited to describe changing (i.e. non-monotonic) relative movements of trajectories. This is generally the case when the trajectories present complex movements with numerous turns. Even with simpler and/or straighter trajectories, non-monotonicity in relative movements will occur when two trajectories first converge and then diverge (or the opposite), for example: if they cross each other’s paths, or if one trajectory undergoes a sharp directional change (e.g. a 180° turn). Non-monotonicity can cause convergence tests to become non-significant and make RTMA overly likely to find Weak Approaching and Weak Departing relationships due to their high connectivity to other relationships (Figure 2).
Regarding those limitations, we make three recommendations: First, when making ecological interpretations, the relationships recognized by RTMA should not be regarded as strictly different but rather as part of a continuum going from Divergence to Convergence in a U shape in Figure 2 (i.e. Divergence is alike Departing, Departing is alike Escape, and so on). In this context, and as shown in our ecological examples, working at the level of relationships groups (i.e. oriented group, convergence group and divergence group) may be valuable. Parallel and Antiparallel relationships do not fall within this continuum nor in any group and, in our opinion, are better left as qualitatively different. We recommend that detailed interpretation of RTMA relationships should be undertaken carefully and accompanied as much as feasible by individualized visualization of the target pair of trajectories in ordination diagrams to prevent misinterpretation. Third, if the trajectories are long enough (based on long and/or high resolution time series), it is possible to apply RTMA on trajectories defined according to moving windows (de la Casa et al., 2025). By breaking down complex dynamics into shorter and simpler parts, a moving window-based RTMA has the potential to greatly reduce issues associated with non-monotonic relative trajectory movements.
Finally, the null model assumed by RTMA (as well as in the new test of dynamic correspondence) is a very simple model of no trajectory movement (i.e. ecological stability, stationarity without autocorrelation). However, other null models, such as random walks, could be deemed suitable to represent “neutral” trajectory movement. With the present formulation of RTMA, application to random walks may yield significant results because of autocorrelation in ecological states. Adapting RTMA to more complex null-models able to adequately consider random walks will require more development.
Potential applications and conclusions
Provided that enough time points are available, and that recorded dynamics are not too noisy, RTMA should find a wide range of applications in ecology. Because it belongs to the flexible, distance-based, Ecological Trajectory Analysis framework (De Cáceres et al., 2019), RTMA can be applied on a variety of data types from community compositions and size structures (as shown here), trait-based community representations (Palacio et al., 2025) to stable isotope data (Sturbois et al., 2022). This flexibility should allow RTMA to be fruitful in a wide range of applications, from applied ecology and restoration to more descriptive analyses of changes in the biosphere. Our ecological applications showcase potential use in succession studies (Meiners et al., 2015). In ecological restoration, RTMA may allow assessment of whether an ecosystem receiving a restoration action follows another system known to have completed satisfactory restoration. At larger scales, and for more descriptive goals, RTMA may be used in the context of global change studies. For instance, there is concern that the biosphere is undergoing homogenization (loss of beta diversity; Li et al., 2020; Magurran et al., 2015; Olden et al., 2018). Homogenization would be expected to generate relationships from the convergence group in RTMA. Global change also leads to tropicalization and deborealization patterns with species generally migrating polewards to accommodate change (Chust et al., 2024; Maire et al., 2019; McGinty et al., 2021). In this context, it could be expected that trajectories representing the taxonomic or functional composition of communities in different latitudes would follow each other (Pursuit relationships, or more generally, relationships belonging to the oriented group in RTMA). Our second ecological example further suggests that RTMA may be used to piece together different time series, obtained from different places, to reconstruct longer dynamics that were not observed in their entirety. In that sense, RTMA may help to perform hybrid analyses that combine time series and space-for-time substitutions (Pickett, 1989).
At a more fundamental level, we believe the relationships identified by RTMA can be interpreted as ecological patterns that were previously difficult to detect and qualify. Having the ability to detect and describe those patterns may foster links with theory and help uncover the underlying ecological processes, a vexingly complicated task in ecology (Ovaskainen et al., 2019). A particularly promising way to achieve this might be to apply RTMA simultaneously to different descriptions of communities (e.g. taxonomic, phylogenetic, functional, Leibold & Chase, 2017), as was already fruitfully done using convergence and divergence (Fukami et al., 2005; Li et al., 2015; McLean et al., 2019).
To conclude, by providing a methodology to assess the relative movements of ecological trajectories, RTMA opens a new way to compare and describe ecological dynamics, enriching the notions of convergence and divergence familiar to many ecologists. RTMA does so using simple tests that are able to consider the full complexity of ecological data (i.e. dimensionality reduction is not needed when working on multidimensional data) and can accommodate many different data types.
Acknowledgements
We want to acknowledge the many people and institutions that have initiated and maintain the long-term ecological datasets used in this article (Buell-Small Succession Study, USA; Craigieburn Forest Park mountain beech dynamics held in New Zealand’s National Vegetation Survey Databank). Our knowledge of our changing world would be much less detailed without them.
Preprint version 2 of this article has been peer-reviewed and recommended by PCI Ecology (https://doi.org/10.24072/pci.ecology.100993; Mammola, 2026). We thank the reviewers and recommenders for ther interest and insightful comments on this article.
Funding
This work was supported by ISblue project, Interdisciplinary graduate school for the blue planet (ANR-17-EURE-0015) and co-funded by a grant from the French government under the program “Investissements d’Avenir” embedded in France 2030.
Conflict of interest disclosure
The authors declare that they comply with the PCI rule of having no financial conflicts of interest in relation to the content of the article.
Data, scripts, code, and supplementary information availability
Supplementary information for this article is available in HAL, along the article preprint : https://hal.science/hal-05478532/ (Djeghri et al., 2026b).
All the code and data needed to reproduce the simulations and ecological examples presented in this paper are freely available at Zenodo: https://doi.org/10.5281/zenodo.18381756 (Djeghri, 2026).
Finally, new functions performing the dynamic correspondence test and RTMA are now implemented in the ecotraj R package (De Cáceres et al., 2025), https://emf-creaf.github.io/ecotraj/) available on CRAN.