

 CC-BY 4.0
Introduction
Calcareous nannofossils (~1-30 μm) are biomineralized calcitic remains produced by calcareous nannoplankton: coccolithophores (i.e., coccoliths), marine photosynthetic algae, and some incertae sedis (Siesser & Winter, 1994), present in the marine sedimentary archives. Initially rare in the Late Triassic marine sediments, nannofossils became increasingly abundant, eventually reaching an optimum around ~120 Ma, in the Cretaceous (Suchéras-Marx et al., 2019), profoundly modifying the carbonate and oceanic carbon cycle dynamics (Erba, 2006). Among nannofossils present in the Cretaceous, the genus Nannoconus presents heavy calcite skeletons (micaliths; ~200-1400 picogram; Tremolada & Young, 2002; section 4.2, chapter 4 of Chowdhury, 2025) and is considered as the main planktonic carbonate bio-producer in the Early Cretaceous seas (~152-120 Ma) (Bown, 2005). The transfer of these massively produced biocalcites to the marine sedimentary record during this long-time interval probably had an effect on the chemistry of the seas, with possible consequences on the marine biosphere, which underwent an important period of planktonic diversification (Hart et al., 2003; Kooistra et al., 2007) matching with the end of the climax of the Nannoconus genus (Erba, 1994). In spite of its significance in terms of carbonate production, the site of biocalcification of the Nannoconus skeleton (intra versus extracellular) and its action as a controlling factor on the elemental chemistry of biocalcites are unknown.
Nannoconus is a genus (Kamptner, 1931) of the family of Nannoconaceae (Reinhardt, 1966). Lees & Bown (2016) assigned this family to the order of Braarudosphaerales (Aubry, 2013), which they emended. This order also includes the family Braarudosphaeraceae, that shares a strong evolutionary link with the family Nannoconaceae as described by Lees & Bown (2016) and Aubry (2025). The skeletons of both families are composed of calcitic pieces, called micaliths (Aubry, 2025). A 3D reconstruction of the micalith of Nannoconus done by our team for the first time showed that each micalith is formed by a combination of 12 segments defined by interlocking arrangement of flat, triangular calcite lamellae (length ~0.50-1.00 µm, thickness ~0.10 µm), creating a wall around a central canal (Chowdhury et al., 2026a). Braarudosphaera bigelowii, an extant species of Braarudosphaeraceae with fossil representatives first occurring 100 Myr ago, calcifies Mg-enriched micaliths, typical of nannoplankton calcifying their skeleton extracellularly (Hagino et al., 2016). Therefore, an Mg enrichment in the calcite lamellae of the Nannoconus micalith could be expected if the site of calcification was extracellular. A first study conducted by Renard et al. (2007) showed that Nannoconus-dominated fractions selected from Cretaceous calcareous sediment, are enriched in Mg and Sr. To date, the composition in both major (e.g., Ca) and trace elements (e.g., Mg and Sr) of the individual micalith of Nannoconus is unknown. It is noteworthy that calcareous nannofossils are often subjected to several post-depositional processes such as diagenesis and contamination by clay minerals. These processes can significantly alter the elemental compositions (Prentice et al., 2014; Suchéras-Marx et al., 2016, 2021; Bottini et al., 2020) of the biocalcite, i.e., the calcite produced solely through biocalcification. Thus, to ensure accurate inferences based on elemental chemistry, it is essential to remove any potential effect(s) of these post-depositional alterations. High-resolution chemical characterization of the biocalcite of Nannoconus, could reveal the primary composition of its micalith while minimizing the effects of possible clay contamination, and/or diagenesis.
With technical developments in the field of imaging, several characterization techniques at submicron-scale resolution have been successfully applied to biocalcites, preserved as nannofossils, as well as produced by extant nannoplankton. These techniques include Atomic Force Microscopy (Henriksen et al., 2004), 3D-Focused Ion Beam-Scanning electron microscopy (Hoffmann et al., 2015) or cryo-Transmission electron microscopy (TEM) (Triccas et al., 2024). In addition, several spectroscopic and X-ray scattering techniques using synchrotron radiation have also been applied, such as X-ray Coherent Diffraction (Beuvier et al., 2019) or Ptychographic X-Ray Computed Tomography (PXCT) (Chowdhury et al., 2026a), 2D (Suchéras-Marx et al., 2016, 2021; Bottini et al., 2020; Bordiga et al., 2023) and 3D (Walker et al., 2024) micro X-ray fluorescence (μ-XRF) spectroscopy. Particularly, synchrotron-based μ-XRF is a highly effective method for isolating and mapping various elements in nannofossil biocalcite. In this study, we analysed the chemical composition of several micaliths belonging to three different Nannoconus species and of two other nannofossils with different ultrastructure for comparison, using synchrotron-based μ-XRF. The other two nannofossils are: 1.Tubodiscus verenae Thierstein, 1973: a heterococcolith i.e., coccolith composed of crystal-units of variable shape and size, which are typically arranged in cycles with radial symmetry (Braarud et al., 1955a, 1955b) produced intracellularly and, 2. Micrantholithus obtusus Stradner, 1963: whose micalith is formed by “identical, imbricated segments that are stacks of lamellae of similar shape” (Aubry, 2025), as Nannoconus, belonging to the order of Braarudosphaerales. To the best of our knowledge, this is the first time, a value for the Mg concentration (in the form of Mg/Ca ratio) is given for the biocalcite of a single ~150 Myr old nannofossil (i.e., Nannoconus). The high-resolution 2D maps of 15 different elements (e.g., Mn, Mg, Sr) obtained from this experiment enabled a detailed assessment of the effects of diagenetic alteration and significant clay mineral contamination on the biocalcite of Nannoconus.
Materials and Methods
Materials
Calcareous nannofossils analyzed in the experiment were selected from three drilled marine sediment samples. Two samples come from the DSDP Leg 93, Hole 603, Site B drilled on the continental rise of the western margin of the North Atlantic and corresponds for the first one: to a nannofossil-rich claystone of Barremian age (Core 55, section R3, interval 102-103 cm), and for the second one: to a silt-rich nannofossil claystone of Aptian age (Core 44, section R3, interval 115-116 cm) (Covington & Wise, 1987). The third sample comes from the Tuxen Formation drilled in the North Jens-1 well of the Danish Central Trough and corresponds to an argillaceous chalk of middle Barremian age (Unit T3, 7521.4’) (Ineson, 1993). Scanning electron microscopy (SEM) images of the nannofossils encountered in these sediments show that they are well-preserved (Covington & Wise, 1987; Mutterlose & Bottini, 2013). Here, “well-preserved” refers to micaliths which are morphologically intact without any breakage and devoid of post-depositional growth of calcite, that often obscure the ultrastructure of nannofossils. We have selected 13 micaliths of Nannoconus belonging to three different species from the sediments of both DSDP cores and North Jens-1 well, one coccolith of Tubodiscus verenae from the sediments of the Barremian DSDP core (Optical microscopic images are presented in Figure 1a and supplementary Figures S1a-S1k), and one micalith of Micrantholithus obtusus (Optical microscopic image: Figure S1l) from the North Jens-1 well (Table 1).
Sample Preparation
The experiment required nannofossils embedded in a thin slice of epoxy resin (1350306 EpoxiCure 2 Resin, containing 50-100 weight% of Bisphenol A-Epichlorohydrin polymer). The slices are typically ~0.50 cm long and ~10 µm thick, which are prepared by cutting blocks of epoxy resin mixed with sediments containing the nannofossils (section 2.2, chapter 2 of Chowdhury, 2025). The resin blocks were sliced using a microtome (Leica RM2265/LN22). These slices are then deposited on thin ultraclean plastic foils (Ultralene®, thickness ~4 μm) suitable for trace element measurements by µ-XRF. Both optical and scanning electron microscopy images of one slice with micaliths of Nannoconus are illustrated in Figures 1a and 1b.
Table 1 - 15 nannofossils selected for the present experiment, with their identification, associated sample origin, age, corresponding UJF-ID numbers of the samples (repository: OSUG, 2021; see the section of “Data, scripts, code, and supplementary information availability”). The dwell time, X, Y dimension and step-size of each of the nannofossils applied during the experiment are presented. Dwell time: the time (in seconds), the beam stays at a given pixel location; X, Y dimension: length and breadth (in micrometers) of the area where the chemical mapping was performed; Step-size: the size (in micrometer) of a pixel of the chemical mapping; N: Nannoconus; T: Tubodiscus; M: Micrantholithus; L: longitudinal view (i.e., central canal is parallel to plane of the paper); T: transverse view (i.e., central canal is perpendicular to plane of the paper) of different micaliths of Nannoconus. The figure numbers for light microscope images (photomicrographs) and elemental maps of each nannofossil, analyzed in this experiment are given. Except for the first nannofossil, these images correspond to the supplementary images.
Identification | Sample origin | Age | OSUG | Dwell time (s) | X, Y dimensions | Step-size | Figure numbers (Photomicrograph) | Figure numbers (elemental maps) |
N. steinmannii subsp. minor (L) | DSDP, Leg-93, Site-603, Hole-B, core-44, section-R3, interval-115-116 cm | Aptian | UJF-ID.18523 | 1 | 30×30 | 0.5×0.5 | 1a | 3, 4 and 5 |
N. globulus (T) | 1 | 36×36 | 0.5×0.5 | S1a | S3a | |||
N. globulus (L) | 1 | 40×40 | 0.5×0.5 | S1b (red box) | S3b (red box) | |||
N. truittii subsp. truittii (L) | 1 | 40×40 | 0.5×0.5 | S1b (green box) | S3b (green box) | |||
N. steinmannii subsp. minor (L) | DSDP, Leg-93, Site-603, Hole-B, core-55, section-R3, interval-102-103 cm | Barremian | UJF-ID.18531 | 3 | 20×20 | 0.5×0.5 | S1c | S3c |
N. globulus (T) | 3 | 24×20 | 0.5×0.5 | S1d | S3d | |||
N. truittii subsp. rectangularis (L) | 3 | 24×20 | 0.5×0.5 | S1e (red box) | S3e | |||
N. globulus (L) | 3 | 24×20 | 0.5×0.5 | S1e (green box) | S3f | |||
N. steinmannii subsp. steinmannii (L) | 0.5 | 40×40 | 0.5×0.5 | S1f | S3g | |||
N. steinmannii subsp. steinmannii (L) | 0.5 | 50×50 | 0.5×0.5 | S1g | S3h | |||
N. globulus (T) | 3 | 30×30 | 0.5×0.5 | S1h | S3i | |||
N. globulus (T) | 3 | 26×26 | 0.5×0.5 | S1i | S3j | |||
N. globulus (L) | 3 | 30×30 | 0.5×0.5 | S1j | S3k | |||
T. verenae | 3 | 30×30 | 0.5×0.5 | S1k | S3l | |||
M. obtusus | North Jens-1, depth-7521.40 ft | Barremian | UJF-ID.18507 | 2 | 50×50 | 0.5×0.5 | S1l | S3m |
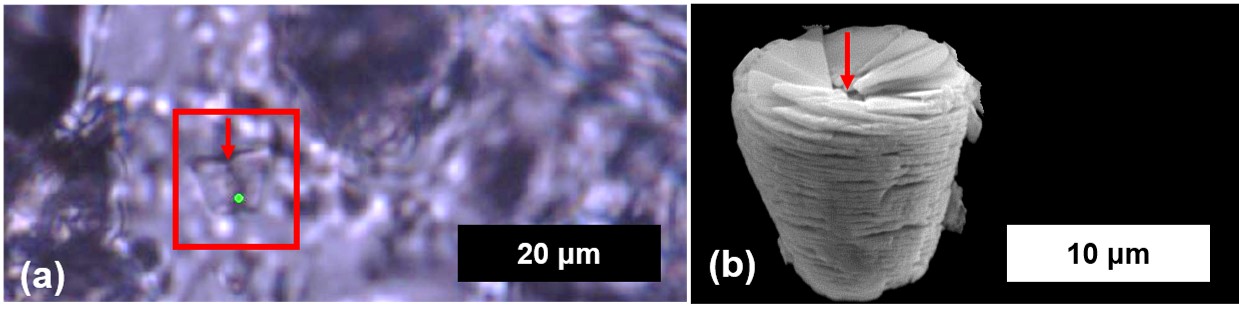
Figure 1 - Sample of resin slices containing micaliths of Nannoconus, used in synchrotron radiation micro X-ray fluorescence. (a) Photomicrograph of one micalith of Nannoconus steinmannii subsp. minor (in the red box) embedded in resin, captured in a light microscope with 50X magnification in plane polarized light. (b) Scanning electron microscopy (SEM) image of one micalith of N. steinmannii subsp. minor (same species but different micalith than in a). The red arrows in both of the images indicate the central canal of the micaliths.
Micro X-ray fluorescence (μ-XRF) experiment
Micro X-ray fluorescence (μ-XRF) measurements were performed at beamline ID21 of the European Synchrotron Radiation Facility (ESRF; Grenoble, France; storage ring energy: 6.03 GeV; Beamline design: Salomé et al., 2013; Cotte et al., 2017). A Si(111) double-crystal monochromator was used for X-ray energy selection and a compact Kirkpatrick–Baez mirror system (KB), based on elliptically shaped, fixed-focus Ni-coated mirrors, was used for focusing the X-ray beam down to 0.3 μm (vertical) × 0.7 μm (horizontal). Chemical maps of each nannofossil were performed at two different incident energies: E1 = 2.4 keV (below the Ca K-edge, and above the Mg K-edge and Sr L1-edge), and E2 = 7.2 keV (above the Ca K edge) under vacuum. Mapping below the Ca absorption edge allowed a better detection for zones with lower Mg and Sr concentrations. Maps for each of the nannofossils were performed with different length, breadth and dwell times. These informations are provided in Table 1. The analysis of the raw data gives a μ-XRF spectrum at each pixel of the map. μ-XRF spectra of each nannofossil obtained from the experiment were normalized by the photon flux measured during acquisition and by the respective dwell time (Table 1). The fitted spectrum was generated with the sum of photons for all pixels of nannofossil divided by the total number of pixels. Spectral fitting was performed in the pyMCA5.8.7 software (Solé et al., 2007) using Hypermet function in combination with the sensitive nonlinear iterative peak (SNIP) algorithm. Applying a least squares procedure, using Poisson weights based on their respective surfaces, peaks were categorically fitted.
It is important to note that the slices contain numerous unwanted particles, such as clays, which can contaminate the nannofossils. These particles are indeed visible in the optical microscopic images of the slices (Figures S1a-S1l) analyzed in this experiment. However, we observed that the micalith of N. steinmannii subsp. minor illustrated in Figure 1a, is isolated from any surrounding particles and hence removes the possibility of contamination. This micalith is then used as a reference to describe the resulting µ-XRF spectra and the subsequent analyses. In the fluorescence spectrum of this micalith, 15 elements were identified (Figure 2). Na, Mg, Al, Si, P, Cl, K, Ca, Ti, V, Cr, Mn, and Fe are identified based on their K-lines. Zr is identified based on its L-line. Sr, however, is not recognized in the spectrum, based on its L-line. The L X-ray emission line of Sr is ~1.80 KeV, which is close to the K X-ray emission line of Si (~1.74 KeV). So, it is possible that the L-line of Sr is subdued under the highly intense K-line of Si. The L-line of Sr is shown separately by the dotted blue curve in Figure 2. Therefore, two elements (Zr and Sr) are recognized based on their L-line. The fluorescence spectra of all nannofossils show that these 15 elements (K-line: 13 elements and L-line: two elements) are consistently identified. Quantitative analyses were done by calibration using the AXO-standard. This is then used to generate elemental maps of each element identified from the spectrum. Bivariate plots of the counts of the selected elements have been obtained by generating workflows in Orange, a suite for machine learning and data mining, through Python scripting and visual programming (Demšar et al., 2013).
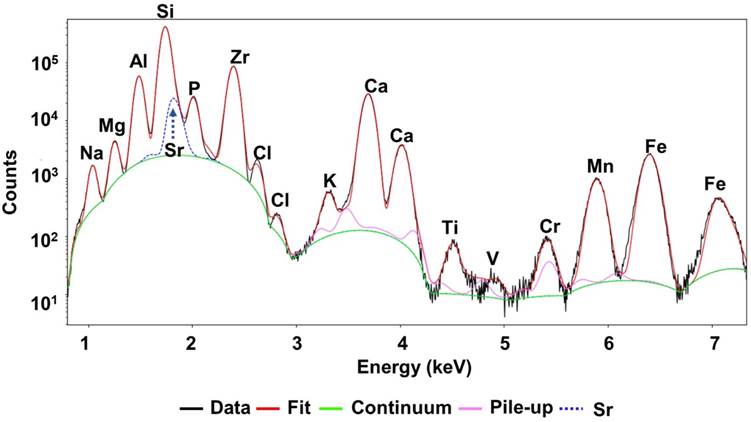
Figure 2 - μ-XRF spectrum of one micalith of N. steinmannii subsp. minor with the 15 identified elements. Except Zr and Sr (identified by the L-line), rest of the elements are identified by their K-lines. The L-line of Sr, that is potentially subdued by the K-line of Si, is shown separately by the dotted blue curve.
Results
Elemental distribution
We have generated 15 maps to represent the individual 2D distributions of all elements recognized from each μ-XRF spectrum. As described in Suchéras-Marx et al. (2016), we compared the map of individual elemental distribution to the morphology of the micalith of N. steinmannii subsp. minor and classified all the elements in a total of four groups. These groups are:
Group 1: Ca and Mn
The Ca signal is distributed homogeneously, following the morphology of the micalith in the map shown in Figure 3a. The green part in the Ca-map results from the partial volume effect (i.e., the total thickness of the sample analyzed by the X-rays is lower at the boundary than at the center of the micalith). Among all the elements, Ca shows the maximum counts in the order of 106 counts per second (cps). A transect (AB) has been made in a direction perpendicular to the central canal. The distribution of Ca along this transect shows high counts in the wall and a small decrease of counts in the central canal of the micalith (Figures 3b and 3c). The Mn-map morphologically mimics the Ca-map of the micalith (Figure 3d) with good linear correlation (r~0.90) between their counts (Figure S2). The counts of Mn are in the order of 104 counts per second (cps). Other elements do not mimic the morphology of the micalith. The counts of each of these elements show poor or no linear correlation with the counts of Ca and Mn (Figure S2). However, based on their inter-element correlations of counts, we have classified them into three additional groups:
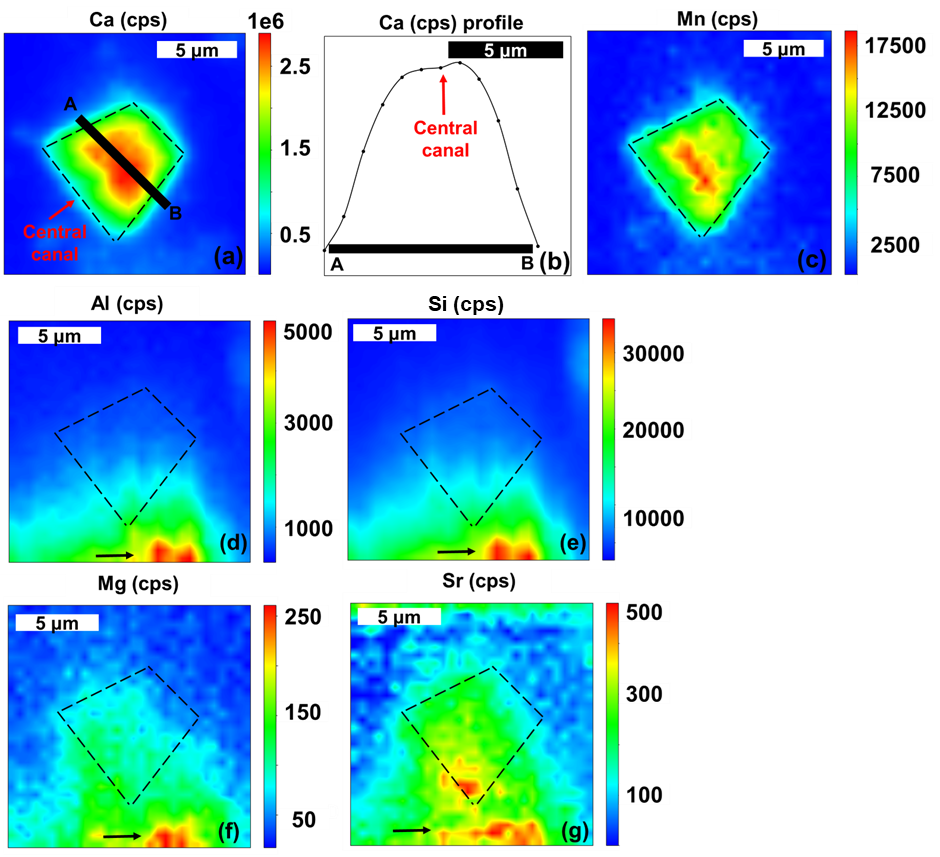
Figure 3 - 2D distribution maps presented in photon counts per second (cps) of elements of group 1, 2 and 3 of one micalith of N. steinmannii subsp. minor. The micalith is presented in longitudinal (L) view, where the central canal is parallel to the plane of the paper. Morphology of the micalith is outlined by dashed black lines. Black arrows indicate particles, outside the morphology of the micalith, showing high Al, Si, Mg and Sr counts. (a) Elemental map of Ca. A linear transect (AB) of the Ca-counts perpendicular to the direction of the central canal is made to show the Ca-profile. (b) The profile of Ca-counts (cps) along the AB-transect. (c) Elemental map of Mn. (d) Elemental map of Al. (e) Elemental map of Si. (f) Elemental map of Mg. (g) Elemental map of Sr.
Group 2: Al and Si
The Al and Si distribution do not resemble the morphology of the micalith (Figures 3d and 3e). Moreover, the Al and Si counts are very low in the part corresponding to the micalith, whereas they are higher in the particles surrounding it (marked by black arrows in Figures 3d and 3e). The linear correlation between the counts of Al and Si (Figure S2) is very high (r~0.99) and their distributions mimic each other. The counts of Al and Si are in the order of 103 and 104, respectively. Si presents the highest counts among all the identified elements, with the exception of Ca (and Mn for the micaliths of Aptian Nannoconus).
Group 3: Mg and Sr
The Mg and Sr distribution do not resemble the morphology of the micalith. Their distributions mimic neither the distribution of group 1 (Ca and Mn) nor of group 2 (Al and Si) elements. Mg and Sr are present both in the micalith (outlined by black dashed lines) and in the external particles (marked by black arrows in Figures 3f and 3g) that are characterized by high Al and Si counts. These two elements, however, follow each other’s distribution (Figures 3f and 3g) and their counts are well-correlated (r~0.79) (Figure S2) with each other. Each of these elements show very low counts (in the order of 102 cps) compared to all the elements of the group 1 and 2.
Group 4: Na, P, Zr, Cl, K, Ti, V, Cr, and Fe
All the elements of group 4 show no resemblance to the morphology of the micalith (Figure 4). Na and Cl show a homogenous distribution, whereas the rest of the elements display heterogeneous distributions. Distribution of Ti, Cr, and Fe appear to be limited to the micalith (dashed outlines). V and Zr present a highly scattered distribution. K exhibits high intensity of counts in two particles external to the micalith, highlighted by two black arrows. These particles also show elevated Fe-counts. In the elemental maps (Figure 4), the elements do not present any inter-correlation. All the elements in this group except P show the lowest counts (<102 cps) among all the recognized elements. The counts of P are less than 103 cps.
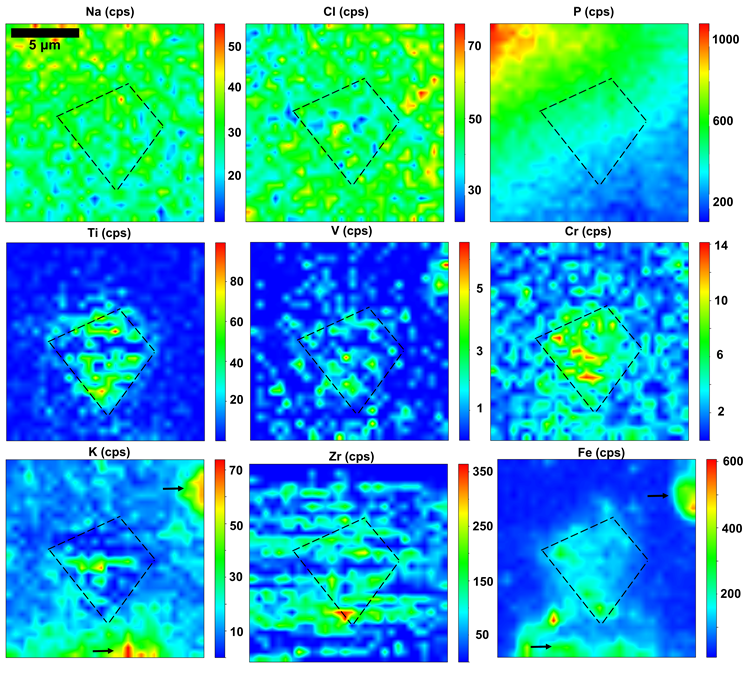
Figure 4 - 2D distribution presented in photon counts per second (cps) of group 4 elements of one micalith of N. steinmannii subsp. minor. The micalith is presented in its longitudinal view (L) same as Figure 3. Morphology of the micalith is outlined by dashed black lines. Two black arrows indicate particles, external to the micalith, with elevated K, and Fe-counts.
The elemental maps obtained for micaliths of other Nannoconus specimens (Figures S3a - S3k), selected from the DSDP site-603B samples (i.e., Aptian and Barremian), show: 1. The Ca map mimics the morphology of the micaliths. 2. The Mn distribution resembles the Ca maps only for the micaliths of Aptian Nannoconus. For the micaliths of Barremian Nannoconus: the Mn distribution matches the Ca maps only for four out of nine micaliths (Figures S3d, S3e, S3h, and S3j). The Mn counts of the micaliths of Aptian Nannoconus is 2-10 times those of the micaliths of Barremian Nannoconus. 3. The elements of the group 2, 3, and 4 show similar distribution patterns for all the micaliths, regardless of the Nannoconus species.
Both for the coccolith of T. verenae (DSDP site-603B, Barremian age; Figures S3l) and micalith of M. obtusus (North Jens well-1, Barremian age; Figures S3m), the elements of all four groups (except Mn in M. obtusus) present the same distribution, consistent with those observed for micaliths of Barremian Nannoconus (DSDP site-603B). The Mn distribution in micalith of M. obtusus, however, follows its morphology and matches the Ca map, unlike the Nannoconus micaliths.
Elemental ratios
For each μ-XRF spectrum, pyMCA5.8.7 provides the mass fraction per pixel for each detected element. Mass fraction values of each element are extracted exclusively from the nannofossils (e.g., the area of micalith of N. steinmannii subsp. minor, enclosed by dashed lines in Figure 3). Relative concentration of each of the identified elements, normalized to Ca, is calculated from the values of mass fraction per pixel for every nannofossil (Tables containing mass fractions of individual elements for each nannofossil are provided in the supplementary material). The mass fraction calculation is based on the following considerations: 1. The mean mass fraction of all the pixels of i (i represents any element) and Ca respectively, are Mmf[i], and Mmf[Ca]. 2. The molecular weight of i and Ca are considered Mw[i], and Mw[Ca], respectively. The relative elemental ratio of “i” with Ca (i.e., i/Ca) in mmol/mol is obtained using the following equation:
\(\left\lbrack \frac{i}{Ca} \right\rbrack = \ \left\lbrack \left\{ \left( \frac{Mmf\lbrack i\rbrack}{Mmf\lbrack Ca\rbrack} \right) \times \left( \frac{Mw\lbrack Ca\rbrack}{Mw\lbrack i\rbrack} \right) \right\} \times 1000 \right\rbrack\)
Among all the elements of the four groups, Ca that belongs to group 1, is the major element in the biocalcite of nannofossils. The other element of group 1 i.e., Mn presents a similar distribution as Ca in the Aptian and different distribution in the Barremian nannofossils. Elements of group 2, Si and Al, show the highest counts among all the identified elements after Ca (and Mn for the Aptian Nannoconus). Finally, elements of group 3, i.e., Mg and Sr, are important trace elements that can potentially provide key information such as the calcification site (intra versus extracellular) (Nehrke et al., 2013), growth and calcification rates, and sea-water temperature (Stoll & Schrag, 2000; Stoll, 2002) in relation to the biocalcification of nannofossils. Therefore, based on their relevance, the elemental ratio of Mn, Al, Si, Mg, and Sr normalized to Ca (i.e., the major element) for each of the 15 nannofossils analyzed in this experiment, are calculated (Table 2). These values are calculated from the areas restricted to the nannofossils and thereby avoiding the elemental signals from the surrounding. The values in Table 2 reveal that the Mn/Ca varies between 0.07 to 1.70 mmol/mol. The Al/Ca and Si/Ca range between 6.01-175.06 mmol/mol and 7.53-238.01 mmol/mol, respectively. The Mg/Ca ratio ranges between 3.54-96.15 mmol/mol while the Sr/Ca falls within the range of 1.44 to 26.87 mmol/mol.
Table 2 - Values of the i/Ca ratio for the 15 specimens of nannofossils analysed in the present experiment. Here, (i) = Mn; Al; Si; Mg; and Sr; N: Nannoconus; T: Tubodiscus; M: Micrantholithus; L: longitudinal view; T: transverse view of the specimen of Nannoconus. For each nannofossil, the values are calculated from the areas, limited to nannofossils themselves, excluding the surrounding signals.
Identification | Mn/Ca (mmol/mol) | Al/Ca (mmol/mol) | Si/Ca (mmol/mol) | Mg/Ca (mmol/mol) | Sr/Ca (mmol/mol) |
N. steinmannii subsp. minor (L) | 1.39 | 4.61 | 7.53 | 3.54 | 1.44 |
N. globulus (T) | 1.25 | 6.01 | 12.13 | 6.02 | 3.93 |
N. globulus (L) | 1.72 | 8.85 | 17.78 | 7.40 | 3.79 |
N. truittii subsp. truittii (L) | 1.15 | 19.49 | 35.02 | 9.06 | 4.59 |
N. steinmannii subsp.minor (L) | 0.22 | 119.16 | 232.35 | 21.19 | 26.87 |
N. globulus (T) | 0.19 | 49.50 | 111.84 | 10.47 | 11.33 |
N. truittii subsp. rectangularis (L) | 0.20 | 175.06 | 238.01 | 49.65 | 26.28 |
N. globulus (L) | 0.11 | 89.00 | 167.76 | 96.15 | 16.59 |
N. steinmannii subsp. steinmannii (L) | 0.07 | 17.43 | 30.30 | 7.41 | 1.48 |
N. steinmannii subsp. steinmannii (L) | 0.08 | 8.37 | 19.76 | 10.32 | 1.47 |
N. globulus (T) | 0.15 | 36.43 | 112.80 | 19.79 | 1.91 |
N. globulus (T) | 0.65 | 32.36 | 57.32 | 7.54 | 3.18 |
N. globulus (L) | 0.22 | 9.29 | 27.61 | 13.17 | 3.46 |
T. verenae | 0.12 | 28.95 | 63.51 | 24.83 | 2.47 |
M. obtusus | 0.53 | 10.30 | 9.24 | 18.86 | 3.40 |
Interpretation
Due to the distinctively varied distribution of elements of each of the four groups, it is important to first identify their source(s). Calcareous nannofossils and therefore Nannoconus, are subjected to undergo post-depositional processes, in particular, diagenesis and contamination that can alter the elemental concentrations of their biocalcite, i.e., the calcite formed exclusively through biocalcification. One such process is diagenetic alteration (Prentice et al., 2014; Suchéras-Marx et al., 2021), involving the dissolution of the biocalcite and subsequent recrystallization on or outside of the nannofossils. This process creates an inorganic overgrowth of calcite on the biocalcite of nannofossils (Sexton et al., 2006; Prentice et al., 2014). Another process affecting the primary elemental concentrations is clay minerals contamination (Prentice et al., 2014; Suchéras-Marx et al., 2016, 2021) of the nannofossils. Hence for Nannoconus, considering these three potential sources: biocalcite, diagenetic alteration, and clay contamination, we here infer the origin(s) of individual elements across the four groups.
Group 1: Ca and Mn
Ca is the major element in the biocalcite of nannofossils and, therefore, Nannoconus. In the micalith of the Aptian N. steinmannii subsp. minor (described in the section of elemental distribution) the Ca-counts mimic its morphology and lie between (0.40-2.50)×106 cps (Figure 3a) and the values higher than 1.00×10⁶ cps, originate from the biocalcite of Nannoconus. This homogenous distribution of the Ca (counts >1.00×10⁶ cps) mimicking the morphology of the micalith is observed in all the micaliths of Nannoconus analyzed in the experiment. This makes us confident that the source of Ca is mostly the biocalcite of Nannoconus.
Mn has robust affinity for carbonate (Astilleros et al., 2002) specifically through diagenetic overgrowth (Boyle, 1983). Suchéras-Marx et al. (2021), based on their analysis of Mn distribution and valency in six calcareous nannofossil species from different ages (Recent to Jurassic) and geological settings (land sections and deep ocean core-tops) and with different microstructures reported that Mn is present in the form of (Ca, Mn)CO3, as a product of diagenetic recrystallization. Our results show that in Aptian Nannoconus micaliths, the Mn map resembles both their morphologies and the corresponding Ca maps. In Barremian Nannoconus, the Mn-maps of four out of nine micaliths show distributive similarities with their Ca-maps and their morphologies. For the rest of the micaliths, the Mn maps counts do not show any resemblance with either Ca-maps or morphologies. The measured Mn/Ca ratios among all the micaliths of Nannoconus range between 0.07 and 1.72 mmol/mol. Mean values, however, differ significantly between the two ages: 1.37 mmol/mol for Aptian micaliths and 0.21 mmol/mol for Barremian micaliths. These observations can be explained in two ways: 1. Mn was originally incorporated into the biocalcite of Nannoconus. This primary Mn is visible in the Aptian micaliths of Nannoconus. Particularly for the Barremian micaliths, the Mn was partially or fully dissolved out from the biocalcite during diagenetic alteration and released in the environment. This explains its presence in four out of the nine micaliths. 2. Mn was not originally incorporated into the biocalcite of Nannoconus. Therefore, its distributions do not match that of their morphologies consistently across both ages and at least even within a single age, similar to the Ca. Then Mn was added in the biocalcite during diagenetic recrystallization, where the Mn is sourced from the sea-water. This therefore indicates a change in Mn incorporation during the recrystallization, from relatively low Mn content in micaliths of Barremian Nannoconus to much higher Mn content in micaliths of Aptian Nannoconus.
Group 2: Al and Si
Al is documented to be nearly absent in the biocalcite of nannofossils (Prentice et al., 2014) and considered to have originated from contamination by clay minerals. In biomineralized calcite of living nannoplankton, reported values for Al/Ca are <1.00 mmol/mol (Prentice et al., 2014). However, it is suggested that Si can be present in the biocalcite formed by extant nannoplankton (Lee et al., 2016; Bordiga et al., 2023) or in the biocalcite of nannofossils (Bordiga et al., 2023). The individual maps of Al and Si exhibit elemental signals coming from both the micalith and its surroundings (Figures 3d and 3e). However, the bivariate plots of Al and Si counts versus Ca counts (Figures 5a and 5b) indicate two distinct clusters: 1. high Al (>2000 cps) and Si (>10,000 cps) counts associated with lower Ca counts (<1.0×10⁶ cps), and 2. lower Al (<2000 cps) and Si (<10,000 cps) counts associated with higher Ca counts (>1.0×10⁶ cps). As previously interpreted, Ca counts exceeding 1.0×10⁶ cps originate from the micalith. The higher Al and Si counts of the first cluster are therefore, inferred to come from the areas surrounding the micalith. The counts of Al and Si are highly (r~0.92) correlated (Figure 5c) with each other and therefore, indicating their source from clay minerals. This interpretation holds true, even though the micalith appears isolated from clay contamination under optical microscopy (as described in the section of μ-XRF experiment). The second cluster, characterized by high Ca counts (>1.0×10⁶ cps), thus, corresponds to the micalith. It is necessary to remove the surrounding Al-Si signals in order to better assess the distribution of the second cluster.
To remove the elemental signals coming from outside of the micalith (i.e., from the surrounding), the pixels that do not follow its morphology have been masked (Figures S4a-S4f), using a python-script (Van Rossum & Drake, 2009; code: Chowdhury et al., 2026b; provided in the supplementary materials). The resulting maps of Al and Si are presented in Figures 6a and 6b. Given the strong linear correlation (Figure 5d) between Al and Si counts (r~0.99), and the absence of a linear correlation between Al and Si with Ca counts of the micalith, we suggest that the Al and Si, that are present on the micalith, originate from clay minerals. This masking approach of isolating the biocalcite signal, successfully removes the Al and Si (Figures 6a and 6b) of the surrounding clay minerals. Contrastingly, the approach cannot remove the Al and Si signals of clay contamination, present as intimately associated with micalith. The large range of nearly 170 mmol/mol for Al/Ca values (i.e., between 6.01 and 175.06 mmol/mol) and nearly 230 mmol/mol for Si/Ca values (i.e., between 7.53 and 238.01 mmol/mol) reported from all micaliths of Nannoconus in the present study (Table 2), could therefore be explained by this clay contamination. This contamination is certainly related to the clay-dominated lithology of the selected samples (i.e., claystones for both sites).
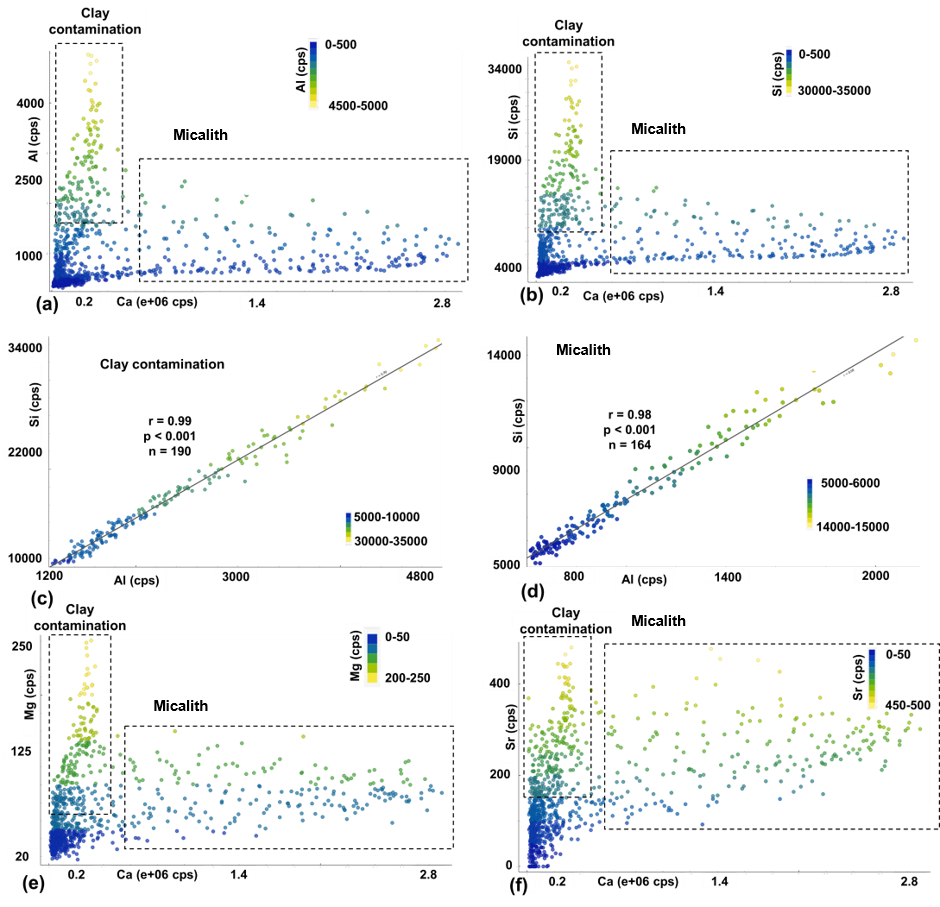
Figure 5 - Bivariate plots among the counts of Ca, Al, Si, Mg and Sr for the micalith of N. steinmannii subsp. minor. (a) Ca-Al. (b) Ca-Si. (c) Al-Si of the cluster, explained by the clay contamination. (d) Al-Si of the cluster present on the micalith. (e) Ca-Mg. (f) Ca-Sr. In the plots a, b, e and f, two clusters of elemental distribution are visible, one related to clay contamination (associated with lower Ca-counts) and the other one to the micalith (associated with higher Ca-counts). Here, r: Pearson’s coefficient of correlation; p: probability; n: total numbers of counts (pixels) of the selected region. Plots were obtained using Quasr software (Demšar et al., 2013).
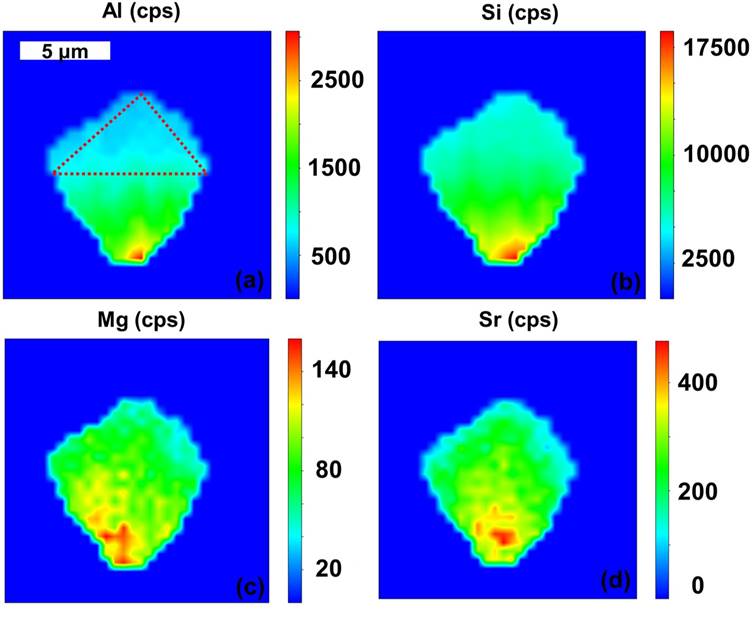
Figure 6 - 2D distribution (in cps) of group 2 and 3 elements for the micalith of N. steinmannii subsp. minor after masking the signals coming outside the micalith. (a) Elemental map of Al. The region marked by the red dotted line in the Al-map shows the least Al counts. (b) Elemental map of Si. (c) Elemental map of Mg. (d) Elemental map of Sr.
Group 3: Mg and Sr
Mg and Sr are both present in the biocalcite of nannofossils (Stoll, 2002; Prentice et al., 2014; Suchéras-Marx et al., 2016, 2020) by replacing Ca2+. These elements are also present in the post-depositional clay minerals associated with the nannofossils (Prentice et al., 2014). The results of the present experiment applied on Nannoconus show that Mg and Sr both present relatively low counts (in the order of 102 cps) compared to the group 1 and 2 elements, indicating their lower concentration. In the case of Sr, the counts are low not only due to its lower concentration but also because it is detected through its L-line, as the L-line of an element presents lower counts compared to its K-line. As interpreted earlier, the micalith of N. steinmannii subsp. minor, is indeed extensively contaminated by clay minerals, which are present both on and surrounding the micalith. Since Mg and Sr are reported to be present in clay minerals as major and trace elements, respectively (Lerouge et al., 2010), the clay minerals potentially, therefore, contaminated the Mg and Sr concentration of the biocalcite. This is also indicated by the good correlation of the counts of Mg and Sr (r>0.70) (Figure S2) with the counts of Al, the element, which is interpreted to originate only from clay minerals. The bivariate plots of Ca-Mg (Figure 5e) and Ca-Sr (Figure 5f) counts (cps), present two different clusters, similar to the Al-Si counts. The first cluster shows higher counts of Mg (>100 cps) and Sr (> 180 cps) associated with lower counts of Ca (<1.0×10⁶ cps). Same as the Al-Si, the Mg-Sr signals from the first cluster come from the outside of the micalith, originating from clay minerals present in the surrounding of the micalith. However, these signals are removed by masking the pixels that are outside of the micalith (Figures S4a-S4f), using the same process and code (provided in supplementary materials) as mentioned in the previous section. The remaining signals belong to the second cluster and show the Mg-Sr coming from the micalith (Figures 5e and 5f) and are respectively presented in Figures 6c and 6d.
As clay minerals seem to cover the micalith (see the interpretation of group 2 elements), they definitely have contaminated the primary signals of Mg and Sr. The process of masking pixels, however, does not remove the clay minerals that are present on the micalith. Thus, the way to get the closest concentrations of Mg and Sr of the primary biocalcite is to reduce the effect of the contamination as much as possible. Among the nannofossils, the micalith of the Aptian N. steinmannii subsp. minor shows the lowest Al/Ca value (~4.60 mmol/mol) (Table 2). This micalith can thus be considered as the one with the least clay contamination among all the nannofossils. Within this micalith, we isolated a region of interest of the masked Al-fluorescence map showing the lowest Al counts (Figure 6a, Al-map) to further minimize the effect of clay contamination. In the isolated part, a high positive correlation (r>0.90) between counts (cps) of the three different elements considered (i.e., Ca, Mg, and Sr) is observed (Figures 7a and 7b). The values of Mg/Ca and Sr/Ca obtained in this isolated region are ~3.27 mmol/mol and ~1.33 mmol/mol, respectively. If all elemental signals of the isolated fraction originate from the micalith, the Mg and Sr counts essentially reflect the concentrations of these elements in its biocalcite. However, as discussed earlier, part of the total Mg and Sr signal is contaminated by clay minerals present on the micalith. Therefore, the Mg and Sr concentrations measured in the isolated part with the least clay contamination can be considered as the upper limits (i.e., the maximum values) of their respective concentrations in the biocalcite of Nannoconus.
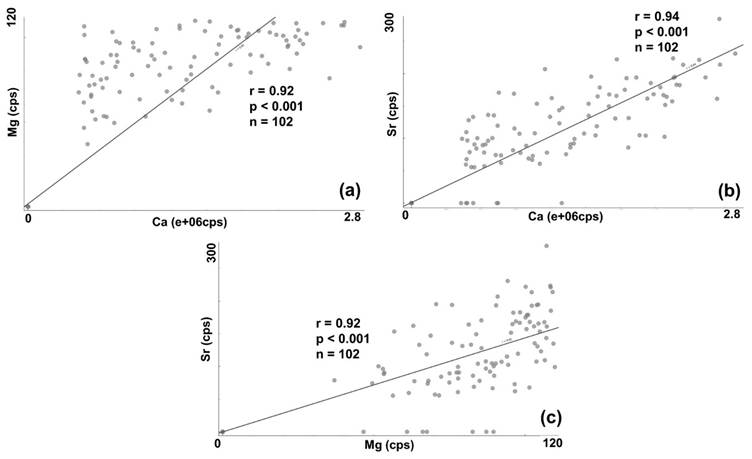
Figure 7 - Bivariate plots of Ca-Mg, Ca-Sr and Mg-Sr counts (cps) for a region of interest, with least clay contamination, (red triangle in Figure 6a) of the micalith of N. steinmannii subsp. minor. (a) Mg and Ca, (b) Sr and Ca, and (c) Sr and Mg. Here, r: Pearson’s coefficient of correlation; p: probability; n: total numbers of counts (pixels) of the selected region.
Diagenesis may affect the primary signals of Mg and Sr (Prentice et al., 2014). This phenomenon reportedly increases the Mg-concentration in the biocalcite. Particularly for Mg, any value of Mg/Ca equal to or greater than 10.00 mmol/mol is considered to be the result of diagenetic recrystallization (Prentice et al., 2014). However, for Sr, this relation is exactly the opposite (Prentice et al., 2014; Dedert et al., 2014). This means that, in case of diagenetic alteration, the Mg content will increase, and Sr will decrease with respect to their primary concentration. In the case of the micalith of N. steinmannii subsp. minor, the counts (in cps) of Mg and Sr show a good correlation (r~0.79) between each other (Figure S2). Thus, we infer that there is no considerable effect of diagenetic alteration on the Mg and Sr concentration for the micalith of N. steinmannii subsp. minor. The correlation between the counts (cps) of Mg and Sr is also observed for all the micaliths of Nannoconus considered in this study. Thus, we can infer that diagenetic alteration has very little effect at all on the elemental concentration of Mg and Sr of the micaliths of Nannoconus, analyzed in this experiment.
Group 4: Na, P, Zr, Cl, K, Ti, V, Cr, and Fe
Cl is documented to be present in the surface (Bottini et al., 2020) and in the interstices (Suchéras-Marx et al., 2016) of the biocalcite of calcareous nannoplankton and nannofossils. V and Fe are reported to be absent in the biocalcite of the culture-grown nannoplankton (Bottini et al., 2020). These two elements, along with the Ti, K and Cr are proposed to be present as a result of diagenetic alteration and/or clay contamination in nannofossils (Suchéras-Marx et al., 2016). In this study Na and Cl show very homogeneous distribution without following the morphology of the micalith of N. steinmannii subsp. minor (Figure 4). The homogeneous distribution of these elements indicates a homogeneous source, likely the epoxy resin that contains the nannofossils. The epoxy resin is bisphenol A-epichlorohydrin polymer, a Cl containing polymer. It is synthesized by reacting bisphenol A (BPA) with epichlorohydrin (ECH) (Kajiyama et al., 2025; Moutik et al., 2024). This synthesis includes a step where, the hydroxyl groups of BPA are converted into functional ionic groups (e.g., -O⁻Na⁺) using sodium hydroxide (NaOH) as a catalyst. The ionic groups then open the epoxide ring of ECH, forming a BPA-ECH bond (Kajiyama et al., 2025). Therefore, both Na and Cl obtained from this experiment possibly have originated from the epoxy resin. The distributions of P and Zr are heterogeneous, and they do not mimic any other elemental distribution or the morphology of the micalith. This leaves no proper understanding of their source(s). We have already inferred that there is contamination by clay minerals on and surrounding the micalith. Thus, one of the possible sources of K, Ti, V, Cr and Fe could be clay minerals. In the micalith of Barremian N. globulus (Figure 8a; Figure S3k), the central canal exhibits higher counts of Fe, Cr, and V (Figures 8b-8f), associated with the higher Mn-counts, with respect to the rest of the micalith. In optical microscopy, this part with higher Fe-Mn-Cr-V concentration in comparison to the rest of the micalith, appears as a black particle (Figure 8a). This suggests that the Fe, Mn, Cr and V in the central canal of the micalith originated from a particle, non-related to the biocalcite of Nannoconus. In deep sea sediments Cr, V are normally associated as trace elements (Tribovillard et al., 2006) in the nodules/micronodules of Fe-Mn-(oxy)-hydroxides (Addy, 1978; Liao et al., 2019). Therefore, the black particle inside the central canal could be interpreted as a “micronodule” of Fe-Mn-(oxy)-hydroxides.
The coccolith of Tubodiscus verenae (Figure S3l, Barremian age, DSDP site-603B, western Atlantic Ocean), exhibits elemental distributions and counts across the four groups that are similar to those observed in the micaliths of Nannoconus, of both the same age and geological setting. Similarly, the micalith of Micrantholithus obtusus (Figure S3m) of Barremian age but of a different geological setting: North Jens-1 well, Danish Central Trough, presents the same elemental distributions and counts as those observed in the micaliths of Barremian Nannoconus. However, Mn counts in micalith of M. obtusus are nearly three times higher than those in the micaliths of Nannoconus. Accordingly, the elemental compositions of the coccolith of T. verenae and of the micalith of M. obtusus are interpreted to have the same origins as those identified in the micaliths of Nannoconus. The syntheses of all the sources corresponding to each of the elements based on the explained interpretation, are presented in Table 3.
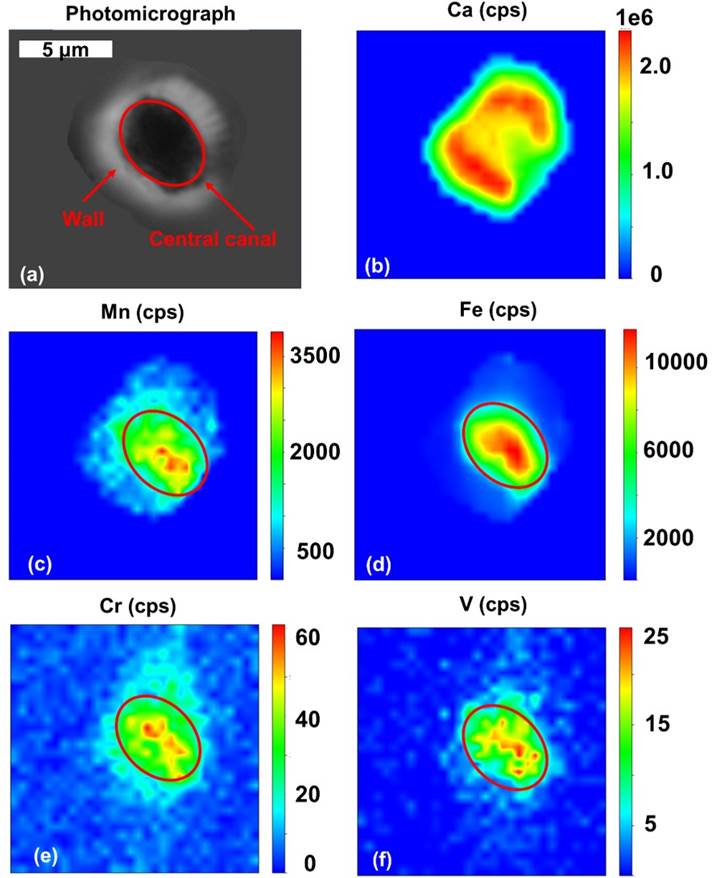
Figure 8 - Photomicrograph and 2D distribution (in cps) of Mn and group 4 elements for the micalith of N. globulus. (a) The photomicrograph of the micalith in cross-polarized light, captured in light microscopy. A black particle corresponding to a micronodule of Fe-Mn-(oxy)-hydroxides in the central canal is marked in the red circle. (b) Elemental map of Ca. (c) Elemental map of Mn. (d) Elemental map of Fe. (e) Elemental map of Cr. (f) Elemental map of V. The position on the micronodule is presented in the elemental maps (c-f) with the red circle.
Table 3 - Three groups of elements identified from the micalith of N. steinmannii subsp. minor with their assigned origins.
Group | Elements | Origin |
Group 1 | Ca | Biocalcite |
Mn | Biocalcite and/or recrystallized calcite, Mn-(oxy) hydroxides | |
Group 2 | Al | Clay minerals |
Si | Clay minerals | |
Group 3 | Mg | Biocalcite, clay minerals |
Sr | Biocalcite, clay minerals | |
Group 4 | Na | Resin |
P | Not possible to assign sources | |
Zr | Not possible to assign sources | |
Cl | Resin | |
K | Clay minerals | |
Ti | Clay minerals | |
V | Clay minerals, Mn-(oxy) hydroxides | |
Cr | Clay minerals, Mn-(oxy) hydroxides | |
Fe | Clay minerals |
Discussion
In calcareous nannoplankton, during the biocalcification, cations Mg2+ and Sr2+ often replace Ca2+ (Stoll, 2002; Prentice et al., 2014; Suchéras-Marx et al., 2016) of the calcite. If the site of calcification is intracellular (i.e., within the cell), cations follow a selective ion transport mechanism (Brownlee & Taylor, 2004; Nehrke et al., 2013), also known as Trans-Membrane Transport (TMT) (Langer et al., 2006; Nehrke et al., 2013). This creates a fractionation, particularly for Mg2+ limiting its concentration in the biocalcite. Therefore, in intracellular calcification, this mechanism results in lower Mg content in the biocalcite compared to the extracellular calcification, where unfractionated elements reach the site of calcification (Nehrke et al., 2013). Braarudosphaera bigelowii, an extant species belonging to the order of Braarudosphaerales (Aubry, 2013) as Nannoconus, is reported to calcify its micaliths extracellularly (Hagino et al., 2016). These micaliths are pentagonal and composed of five trapezoidal segments, each formed by parallel stacking of the lamellae. The pentagonal micalith is templated by an extracellular organic layer, divided into five parts, resembling the five trapezoidal segments. Simultaneously, the consecutive parallel lamellae of each segment are likely divided by thin organic layers (Hagino et al., 2016). These micaliths cover the cell and create a micasphere (Aubry, 2025). Such micaspheres in their intact and broken forms are recorded from extant and fossilized B. bigelowii. The organic layer, templating the calcification of the micalith is hardly preserved in fossil records; however, observations from Oligocene sediments of North Sea (Hochuli, 2000) indicate that it could be some “non-hydrolyzable biopolymer” (Hagino et al., 2016). In case of the Nannoconus, the individual micaliths are explained as a combination of 12 spiral segments, stacked in an interlocking organization (Chowdhury et al., 2026a). The only image of an intact micasphere of Nannoconus in sediments has been reported by Trejo (1960), (plate III) and suggests that thick and large micaliths “enclose a tiny central cell” (Aubry, 2025). Given that the Nannoconus micaliths are several folds larger than their cell, Aubry (2025) argued that the calcification of an entire micalith inside the cell (i.e., intracellular) is impossible, indicating an extracellular calcification for Nannoconus. In intracellularly calcifying nannoplankton and in Cenozoic calcareous nannofossils, Mg/Ca values are in the range of 0.10-3.00 mmol/mol (Stoll et al., 2001; Müller et al., 2011; Blanco-Ameijeiras et al., 2012; Prentice et al., 2014). However, it is also reported that in culture-based calcification of some nannoplankton this Mg/Ca ratio can be extremely high in tens to hundreds of mmol/mol (Stanley et al., 2005). It is noteworthy that with the present study, it is for the first time that Mg/Ca (in mmol/mol) value is given for an individual Mesozoic calcareous nannofossil. For Nannoconus, we have obtained for Mg/Ca, an upper limit of 3.27 mmol/mol. Thus, the biocalcite of Nannoconus is characterized by Mg/Ca value lower than 3.27 mmol/mol, which is in the range of the values reported for both living calcifying nannoplankton and Cenozoic nannofossils (i.e., 0.10-3.00 mmol/mol), and no Mg enrichment is observed in the analyzed micaliths of Nannoconus. It is noteworthy that there are no values reported till date for the molar ratio of Mg/Ca (in mmol/mol) of the micaliths of B. bigelowii. The molar Mg/Ca ratio (in mmol/mol) of the biocalcite of Nannoconus is therefore very similar to intracellular calcite despite its probable extracellular calcification. This could be explained as: the calcification of the micaliths of Nannoconus did indeed occur extracellularly like B. bigelowii, but with a “possible” regulation in the Mg2+ ion-transport from the sea-water, created by a “membrane”, extending from the cell-exterior. This resulted in similar Mg-concentration in the biocalcite of Nannoconus as observed in biocalcite produced by nannoplankton’s intracellular calcification with the same ion-transport regulation mechanism. Based on the 3D microstructural reconstruction of the micalith of Nannoconus, it has been proposed that it could calcify from an extracellular organic layer template (Chowdhury et al., 2026a; Figure S5), same as the organic layer of B. bigelowii, templating its micalith calcification. Such a layer can therefore assign the regulation of the Mg2+, during the calcification, restricting the Mg/Ca ratio in the biocalcite of Nannoconus. This hypothesis, however, is based on the elemental ratio obtained from one single micalith of N. steinmannii subsp. minor. Therefore, further studies with higher numbers of micaliths are necessary to study the Mg/Ca ratio for better deciphering the site of calcification for Nannoconus. The amount of Sr in the intracellularly produced biocalcite of calcareous nannoplankton, is dependent on primary productivity (Stoll & Schrag, 2000), calcification rates and sea-water temperature (Stoll, 2002), sea-water Sr/Ca ratio (Stoll & Ziveri, 2004), or can be species-dependent (Hermoso et al., 2017). In relation to the TMT, i.e., Trans-Membrane-Mechanism of intracellular biocalcification discussed earlier, unlike Mg2+, Sr2+ is not selectively regulated through the membrane (Allen & Sanders, 1994; Nehrke et al., 2013). In living nannoplankton produced in culture, Sr/Ca values fall in the range of 2.80-10.10 mmol/mol (Stoll & Bains, 2003; Bottini et al., 2020). For Cenozoic nannofossils (~34 Ma), reported values of Sr/Ca range within ~0.80-4.00 mmol/mol (Prentice et al., 2014). Sr/Ca has been reported as low as ~0.30 mmol/mol to as high as ~10.00 mmol/mol for Middle Jurassic (~170 Ma) calcareous nannofossils (different genera; Suchéras-Marx et al., 2020). In a Cretaceous (~121 Ma) carbonate fraction dominated by Nannoconus, Renard et al. (2007) reported a value of Sr/Ca ~8.72 mmol/mol. In the present study, the maximum value of Sr/Ca for the biocalcite of Nannoconus is 1.33 mmol/mol. This value is lower than those obtained by Renard et al. (2007) from the Nannoconus dominated carbonate fraction, which also contained other calcareous nannofossils and abiotic calcite particles. Provided numerous variables influencing the Sr concentration in the biocalcite, it is difficult to make any firm inference based only on the upper limit of Sr/Ca for micaliths of Nannoconus.
Additionally, we have established that the Mn concentration in micaliths of Nannoconus could have resulted from either biocalcification or post-depositional recrystallization. For some Middle Jurassic calcareous nannofossils, values of Mn/Ca range between 0.78 and 1.33 mmol/mol (Suchéras-Marx et al., 2016). In the present study, the Mn/Ca ratios obtained for 13 micaliths of Nannoconus (Barremian to Aptian ages), are between 0.07 mmol/mol to 1.72 mmol/mol. But the average value of Mn/Ca for the micalith of Aptian Nannoconus is 7.2 times higher than that of the micalith of Barremian Nannoconus of DSDP site-603B. As discussed in the interpretation of group 1, considering that the Mn in the biocalcite of Nannoconus was originally incorporated during biocalcification, we proposed: the primary Mn-concentration is recorded in the Aptian micaliths and in the Barremian micaliths it is partially or fully dissolved and released into the surrounding environment. This creates the lower Mn-content and therefore, lower Mn/Ca ratio (mmol/mol) than the Aptian specimens. This would indicate that, in Barremian the condition(s) were favorable for Mn dissolution. Wang et al. (2009), in their study on ferromanganese crusts (age ~70 Ma) formed on basaltic seamounts, found in the Pacific Ocean (depths >1000m), proposed a possible mechanism for Mn-dissolution from nannofossils during their deposition. The authors suggested that in the water column, the CaCO3 of the nannofossils is subjected to dissolution that releases hydroxyl (OH-) groups: [CaCO3 + H2O → Ca2+ + HCO-3 + OH-] slightly increasing the alkalinity of the environment. This promotes the formation of Mn4+ from Mn2+ which subsequently precipitates as Mn-oxides/Mn-(oxy)-hydroxides: [Mn2+ + 2H2O → Mn(4+)O2 + 4H+]. This process might explain the precipitation of Mn as Mn-oxides (Mn4+) at the expense of the primary Mn (Mn2+) of the biocalcite. This process can be triggered by environmental changes, such as the transition to anoxic conditions when nannofossils descend into the oxygen minimum zone (OMZ). In optical microscopy, black particles, corresponding to micronodules of Mn-oxy-hydroxides (see the interpretation of the group 4 elements), are often observed in the Barremian sediments of the DSDP site-603B. On the contrary, they are rarely found in the Aptian sediments of the same setting. Considering some of them as the Fe-Mn-(oxy)-hydroxides, we can infer that the Mn-oxy-hydroxides were abundantly precipitated during the Barremian, resulting from the dissolution of Mn from the biocalcite of Nannoconus and therefore, generating lower Mn-counts and Mn/Ca ratio in the Barremian micaliths. However, considering all of the Mn counts resulted from diagenetic recrystallization, it can be inferred that the availability of Mn2+ was lower in the Barremian, resulting in lower Mn and Mn/Ca (mmol/mol) ratio in Barremian nannofossils than the Aptian ones. In deep-sea sediments, for such recrystallization, one of the main sources of the Mn ions are Mn-(oxy)-hydroxides (Tribovillard et al., 2006), where the Mn is present as Mn4+. These Mn-(oxy)-hydroxides dissolve below the oxic-anoxic interface, leading to the reduction of Mn4+ to Mn2+, a more soluble Mn ion. Mn2+ can then be precipitated replacing Ca2+ during recrystallization in biocalcite (Tribovillard et al., 2006). Thus, the availability of the Mn2+ necessary for the recrystallization is dependent on the position of the oxic-anoxic interface with respect to the sediments containing the nannofossils. The difference could be explained by different availability of the Mn-ion during the recrystallisation process between both time periods. The presence or absence of Mn-oxy-hydroxides could possibly be one of that dominant control(s). Their dissolution would release the Mn2+, creating the availability of these Mn2+ required for recrystallization. This potentially has increased the Mn concentration in the recrystallized calcite of the Aptian Nannoconus. This phenomenon can only occur if the sediments of the DSDP site-603B were above the oxic-anoxic interface in the Barremian and below it in the Aptian. We have also interpreted that the biocalcite Nannoconus, regardless of its origin and geological settings, is contaminated by clay minerals. The μ-XRF spectrum of micaliths of Nannoconus shows that, except for the Ca (and the Mn for the Aptian Nannoconus), the Al and Si exhibit the most intense counts among all the detected elements. The signals of Al and Si are inferred as originating from clay minerals present as contamination in and surrounding the micaliths. Contrastingly, the Ca and Mn signals are obtained only from the biocalcite and recrystallized calcite, respectively. Hence, higher counts of Al and Si compared to Ca and Mn (except the Aptian Nannoconus), suggest that the clay contamination has masked the signals of the biocalcite of Nannoconus. This contamination has also affected the concentration of Mg and Sr. The Al/Ca and Si/Ca ratios of T. verenae (Barremian age, DSDP site-603B) are 15.19 and 43.63 mmol/mol, respectively (Table 2). The Al/Ca and Si/Ca ratios of the micalith of M. obtusus (Barremian age, North Jens-1) are 10.30 and 9.24 mmol/mol, respectively (Table 2). This also indicates extensive clay contamination in the other nannofossils (Figures S3l and S3m). Thus, to obtain uncontaminated primary elemental signals exclusively of biocalcite, alternative experimental approaches are required. Microscopic techniques with elevated resolution, like Field Emission Gun scanning electron microscopy (FEG-SEM), Transmission Electron Microscopy (TEM) can be used for this. Secondary Ion Mass Spectrometry (SIMS), which allows sputter cleaning to remove surface contamination (Prentice et al., 2014), is another viable method.
Conclusion
Nannoconus, a calcareous nannofossil, was the main pelagic carbonate contributor in Early Cretaceous seas for ~30 million years. It calcified a sophisticated, massive skeleton composed of micaliths consisting of imbricated segments that are stacks of calcitic lamellae around a central canal. However, the site of calcification of the skeleton, whether intra- or extracellular, is unknown. In calcifying marine organisms, calcite produced extracellularly is typically enriched in Mg compared to calcite produced intracellularly. In order to assess the Mg content of the biocalcite of Nannoconus, a chemical characterization based on synchrotron micro X-ray fluorescence was applied. A total of 13 micaliths encompassing three Nannoconus species from DSDP Site 603B (western Atlantic Ocean), along with one coccolith of Tubodiscus verenae and one micalith of Micrantholithus obtusus from the North Jens-1 well (Danish Central Trough), were analyzed in this experiment. A set of 15 elements was identified from the μ-XRF spectra of each of the nannofossils. The identified elements were classified into four groups based on how closely their 2D distribution corresponded with the morphology of the respective nannofossils. Overall, the distributions of the elements are interpreted to result from three processes: incorporation in the biocalcite during the calcification, post-depositional diagenetic recrystallisation and clay contamination. The distribution of Ca distinctively resembles the morphology of the micaliths and corresponds to the biocalcite of Nannoconus. The concentration of Mn resulted from biocalcification and/or recrystallization. Si and Al show the highest concentrations, except for Ca (and Mn in the case of Aptian Nannoconus), sourced from clay mineral contamination on and around the micaliths. Recrystallization and clay contamination also significantly affected the chemistry of two other nannofossils, namely T. verenae and M. obtusus. In a selected zone of the micalith of one Nannoconus, showing the lowest clay contamination, the Mg/Ca and Sr/Ca of the biocalcite could nevertheless be measured and are below 3.27 mmol/mol and 1.33 mmol/mol, respectively. This is the first time that a value of Mg/Ca (in mmol/mol) is given for a single calcareous nannofossil of Mesozoic age. This value is in the range of values obtained from Cenozoic and extant intracellular coccoliths, showing that there is no specific enrichment in Mg in the biocalcite of Nannoconus, unlike what was observed in Braarudosphaera bigelowii, a species calcifying its micalith extracellularly, that belongs to the same order (i.e., Braarudosphaerales) as Nannoconus. The question of extra versus intracellular calcification of the skeleton of Nannoconus can then not be conclusively solved only with chemical analysis. In the future, chemical characterization of the micalith can be applied using microscopic technique with finer resolution (e.g., FEG-SEM, TEM).
Appendices
The supplementary information is deposited in the Zenodo repository. The DOI of the repository are provided in the section “Data, scripts, code, and supplementary information availability”.
Acknowledgements
We acknowledge ESRF for providing access to synchrotron radiation on the ID21 beamline through proposal: 20225295. We are thankful to Cinzia Bottini, Daniel Chevrier, one anonymous referee, and the editor, Emilia Jarochowska for their valuable remarks and comments to improve this publication. We would like to extend our warmest thanks to Joerg Mutterlose, Emma Sheldon, Nicolas Rudolph Thibault and Lena Wulff for sending us samples from North-Jens-1. Preprint version 4 of this article has been peer-reviewed and recommended by Peer Community In Paleontology (https://doi.org/10.24072/pci.paleo.100439; Jarochowska, 2026).
Funding
This work was supported by the Tellus Program of CNRS-INSU, OSUG@2020, and IODP-France.
Conflict of interest disclosure
The authors declare that they comply with the PCI rule of having no financial conflicts of interest in relation to the content of the article.
Author contributions
Conceptualization: L.C.C.H., H.C-M., A.F-M., and F.G. Investigation: R.C., B.S-M., L.C.C.H., H.C-M., A.F-M., and F.G. Methodology and Formal analysis: R.C., B.S-M., L.C.C.H., A.F-M., and F.G. Resources: F.G., and A.F-M. Supervision: F.G., and A.F-M. Writing - Original Draft: R.C. Writing - Review and Editing: R.C., B.S-M., L.C.C.H., H.C-M., A.F-M., and F.G.
Data, scripts, code, and supplementary information availability
Rock samples and associated nannofossil samples used for the experiment are curated at the Collections de Géologie de l’Observatoire des Sciences de l’Univers de Grenoble (OSUG), with an appropriate UJF-ID number. OSUG-COLLECTIONS is a database of rocks, minerals, and fossils, https://web.collections.osug.fr, OSUG, UGA (https://doi.org/10.17178/OSUG-COLLECTIONS.all; OSUG, 2021). The supplementary materials are put into a folder named as “Supplementary Information” and uploaded in the Zenodo repository (https://doi.org/10.5281/zenodo.20608908; Chowdhury et al., 2026b), containing the following files:
1. A document (in .pdf format) of all the supplementary images mentioned in the manuscript (i.e., Figures S1-S5), and the UJF-ID numbers of the samples as curated at the OSUG Collection
2. An Excel workbook (in .xlsx format) that provides the identification, age, and geological settings of all the nannofossils described in the manuscript, each assigned a serial number. The mass fractions of the 15 identified elements for each nannofossil are sequentially included in separate sheets within the same file, organized according to the corresponding serial number.
3. A code (in .txt format) using python script used for masking selected pixels of the elemental maps of Al, Si, Mg, and Sr.
4. A subfolder named as “Data” containing five excel workbooks (in .csv format), each containing the pixels and counts of the individual elemental maps of Ca, Al, Si, Mg, and Sr.
The supplementary material can be accessed online (https://doi.org/10.5281/zenodo.20608908, Chowdhury et al., 2026b).