


 CC-BY 4.0
Introduction
Environmental health pollution poses increasingly complex challenges to societies and, more broadly, to the planet. The growing production of synthetic chemicals is now recognized as one of the planetary boundaries since the rate at which new entities are created and released exceeds the global capacity for assessment and monitoring. (Persson et al., 2022). This expanding production of made-man chemicals generates the accumulation of residues that contaminate various environments, leading to concentrations reaching critical thresholds that hinder effective regulation and risk management (Boudia et al., 2021). Among these pollutants, per- and polyfluoroalkyl substances (PFAS), also known as “forever chemicals”, constitute a highly significant case. Several scientists have recently argued that PFAS alone could be considered a planetary boundary due to their persistence and bioaccumulative properties, which raise significant concerns (Cousins et al., 2022).
According to the latest OCDE definition (OECD, 2021), PFAS are, with a few noted exceptions, any chemical with at least a perfluorinated methyl group (−CF3) or a perfluorinated methylene group (−CF2−). PFAS thus constitute an extensive family and, according to the previous OECD definition published in 2018, there were approximately 4,700 compounds with CAS numbers (Wang et al., 2021). However, under the 2021 OECD definition, a substantially larger number is anticipated (Schymanski et al., 2023). Within this extensive group, compounds can be categorised into two main subgroups: polymers and non-polymeric compounds. The latter subgroup can be further categorised based on structural characteristics, e.g. specific functional groups, the nature of the fluoroalkyl chain, the presence of ether functions, etc. Since their introduction in the 1950s, PFAS have been used in an exceptionally wide range of products, from non-stick cookware coatings to textiles and medical devices. Their widespread use stems from a unique combination of properties, including resistance to chemicals and heat, low surface energy, low friction, amphiphilic character (i.e. both hydrophobic and hydrophilic), dielectric properties, and more (Evich et al., 2022).
Beyond their extensive industrial use, these chemicals have become a major source of environmental and health concern over the last decades. They have raised growing concerns due to their high persistence in the environment, while their occurrence in virtually every environment and organism on Earth has been extensively documented with a few exceptions (i.e. polymers) (Calafat et al., 2007; Boisvert et al., 2019; Cousins et al., 2022). In addition to their bioaccumulative properties, certain non-polymeric PFAS may also biomagnify, leading to elevated concentrations in apex predators, including humans (Munoz et al., 2017; Macorps et al., 2022). Recent research has also broadened the scope of health concerns related to PFAS, highlighting associations with endocrine disruption, thyroid dysfunction, reprotoxicty and increased risks of testicular and kidney cancers, among other adverse outcomes (Gaillard et al., 2025; Kramer et al., 2026). In response to mounting evidence of their multifaceted toxicity, numerous experts advocate for regulating PFAS as a chemical class, rather than relying on the traditional substance-by-substance strategy (Kwiatkowski et al., 2020; Cordner et al., 2024). This concern is central to the proposed universal PFAS restriction submitted by Germany, the Netherlands, Denmark, Sweden, and Norway in March 2023 (and updated in October 2025), which advocates for a group-based regulatory approach to address the persistent risks posed by these substances. Despite this proposal, the current risk assessment of PFAS continues to adhere to a “molecular bureaucracy” involving the evaluation of substances one by one (Hepler-Smith, 2019). This approach has proved to be increasingly unsuited to the sheer diversity and complexity of PFAS. For instance, although the International Agency for Research on Cancer (IARC) has recently classified PFOA as carcinogenic to humans and PFOS as possibly carcinogenic (Group 2B) (Zahm et al., 2024), potentially thousands of structurally related PFAS remain unassessed within existing regulatory frameworks. Understanding and addressing PFAS contamination is complicated by the challenge of obtaining the necessary data and knowledge, including information on their sources, extent, and potential health risks. These difficulties are exacerbated by both deliberate corporate strategies to obscure information (Richter et al., 2021) and by structural forms of “undone science” (Frickel et al., 2010; Hess, 2016), that is the systematic underproduction of knowledge in areas that are politically or economically inconvenient, reflecting the unequal capacities of industry and social movements to shape research agendas. This paucity of accessible data – or, when it exists, the difficulty in accessing it – highlights the need for new modes of knowledge production that integrate researchers from multiple disciplines (including the social sciences), journalists, and civil society actors, while adhering to FAIR data principles (Wilkinson et al., 2016), in order to address persistent issues of data accessibility, transparency and reuse.
In the United States, from the early 2000s onward – following the work of lawyer Robert Bilott, who exposed water contamination by DuPont in West Virginia (i.e. groundwater, surface water and drinking water), and the efforts of the Social Science Environmental Health Research Institute at Northeastern University – several initiatives emerged, including the PFAS Project Lab co-directed by Phil Brown and Alissa Cordner1. One of the key outputs of this initiative was a public map of PFAS pollution, created through collaborations between researchers, activists, and journalists2. These initiatives are giving rise to new forms of knowledge production and mobilisation around these issues (Cordner et al., 2019; Garrett et al., 2025).
In Europe, public concern about PFAS is more recent but has also led to original collaborative projects. In early 2023, the Forever Pollution Project (FPP)3, a cross-border investigation by 16 European newsrooms, revealed nearly 23,000 confirmed PFAS-contaminated sites and 21,500 additional sites considered likely to be polluted. The project compiled data from national sources, scientific publications, and grey literature to create the first Europe-wide PFAS contamination map. To establish this map, each newsroom in the project researched PFAS contamination data in their country. PFAS concentrations were also searched in scientific publications, and grey literature was used to search for presumptive contamination sites. The data was published by Le Monde newspaper alongside a map, and the methodology developed for the project was published as a peer-reviewed article (Cordner et al., 2024).
In France specifically, public mobilisation began in late 2022, particularly in response to journalistic investigations into PFAS contamination in the “chemical corridor” located south of Lyon, highlighting the urgent need for systematic data collection regarding PFAS contamination in this region and also nationally in various sample types (e.g., soil, groundwater, drinking water, biota...). The French National Center for Scientific Research (CNRS) has quickly engaged in this issue through conferences and other initiatives to mobilize the research community4. In this context, it became clear that access to comprehensive, reliable, and up-to-date data on confirmed and potential PFAS contamination sites was a major priority for research, policy, and public engagement. Building on the work of Le Monde and the FPP, in January 2024 the CNRS decided to launch the PFAS Data Hub (PDH) project to address these needs, i.e. preserving these data, implementing regular updates using dynamic sources, and making them openly accessible along with detailed metadata and methodological documentation.
The objectives of the PDH project include maintaining regular updates of the dataset and improving its quality by removing limitations from the FPP dataset — which only retained certain individual PFAS concentrations, the total concentration sum, and values above 10 ng/L — and by eliminating manual processing steps to ensure methodological robustness and transparency. The project also seeks to publish a public website providing both geospatial visualisations and downloadable data exports. Finally, it aims to foster collaboration and reusability by applying the FAIR principles (Wilkinson et al., 2016) and by publishing all source code under an Open Source/Free Software license, in line with the principles outlined in (National Academies of Sciences & Medicine, 2018)
The long-term ambition of this project is to use this platform as a pilot project for developing a tool to be initially focused on PFAS but adaptable to other environmental contaminants such as heavy metals, microplastics, pesticides, and other pollutants. This data paper constitutes an important step in this process.
Methods
Data acquisition
The starting point of the project was the list of datasets from the FPP. We wished to follow a different methodology (cf. introduction), which made it necessary to integrate each of these datasets from scratch.
Data from the Forever Pollution project
Some data points were listed manually by the FPP, for example the list of facilities producing PFAS, or the list of military bases where we can reasonably suspect that fire-fighting products containing PFAS were used. Most of the data however, was obtained by the FPP team from different sources: (i) health or environment institutions - each journalist of the project tried to obtain PFAS pollution data from their local or national authorities, either by press or “Freedom of Information” requests, (ii) research papers that provided open data from their measurement campaigns; (iii) open sources for presumptive contaminated sites, like the website ourairports.com, which provides a list of active and former airports, or the list of wastewater treatment plants in the European Union. This original data search was conducted during 2023.
It is worth noting that, when we reintegrated the data of each FPP source, we often kept many more data points than the FPP, because (i) we did not filter the data based on total PFAS concentration, and (ii) kept all the values for each coordinates, instead of the highest or most recent value.
In some cases, data that was present in the FPP could not be included in the PDH dataset. This corresponded to situations where PFAS concentrations were only present as sums instead of individual values, or where localisation was only given in terms of place names.
Data added during the PDH project
Besides reprocessing the FPP data, we added new data, either that we proactively searched for, or that was shared with us. In looking for data to add, we focused on sources that regularly publish PFAS concentration data on a platform or in an open data repository (for example, drinking water quality monitoring data, which is often publicly available on a dedicated portal). We added this data in a dynamic way, querying new data monthly in an automated way.
Datasets and data sources
We define a “dataset” as data originating from a single source, identified by a dataset ID and a dataset name. The data source is the third party that published the data orthe source where the data was found for data that was directly listed by the FPP. The raw data for each dataset, along with the code used to process it, is published on GitLab. This allows for the investigation of any suspected errors in the final data. No manual operations have been performed on the data.
In some cases, there is no raw data file, because the data is obtained dynamically - either downloaded from a website or obtained via an Application Programming Interface (API) - and directly saved under our standardized format. Such data sources are queried each 30 days, allowing for the data to be kept up to date. Such datasets are marked as “dynamic” on the datasets page5.
The methodological notes about each dataset and its processing are written directly in the code that processes them. These notes are also available on the datasets page of the PDH website.
Categories of points
The PDH includes four categories of points: (i) PFAS production facilities, (ii) Known PFAS users, (iii) Presumptive contaminations and (iv) Measurements. This categorisation is close to that developed by the FPP (Cordner et al., 2024), which itself was largely based on the peer-reviewed methodology of the PFAS project Lab map6 (Salvatore et al., 2022). We renamed the category Known contaminations into Measurements, as it includes numerous sampling points where PFAS were measured, but not detected. We also introduced a new category PFAS production facilities, which were previously classified in the Known contaminations category. This was based on the assumption that PFAS contamination is highly likely in the vicinity of production sites. We chose to separate these categories because it makes them clearer from the data perspective: Measurement points now refer exclusively to points where we have concentration value(s), including points where PFAS were measured but not detected.
For the four categories of points, the data compiled by the PDH project should not be considered to be exhaustive.
Category: PFAS production facilities
Current and legacy PFAS producers are industrial facilities currently manufacturing PFAS, and industrial facilities which have manufactured PFAS in the past, including polymers. PFAS producers are companies which:
-
synthesise PFAS to sell them as ‘ingredients’ to PFAS users (= strictly producers)
-
synthesise PFAS and use them to manufacture their own fluoropolymers (e.g. PTFE and PVDF), side-chain fluorinated polymers, perfluoropolyethers, fluoroelastomers) (= both producers and users)
The list of 20 facilities was established by the FPP, asking each of the companies to confirm or disconfirm PFAS production at these facilities. At the time of FPP publication (early 2023), 3 from these 20 facilities were no longer active. We researched the status of these 20 plants in November 2025 in grey literature. Three more facilities have stopped PFAS production (Lanxess in Leverkusen, Germany, Chemours in Villers St Paul, France; Solvay in Salindres, France); one facility has announced stopping PFAS production in near future (Dyneon in Gendorf, Germany, Solvay inBad Wimpfen, Germany); eleven facilities apparently still produce PFAS.
It should be noted that this list of PFAS producers was established in 2023 and is not likely to be exhaustive, as the team did not search for manufacturers of pharmaceuticals, biocidal products and plant protection products that are PFAS according to the OECD, 2021 definition (OECD, 2021). A further search targeting such producers would be worthwhile in future.
Category: Known PFAS users
The category Known PFAS users was introduced in the FPP. They are industrial facilities with evidence of PFAS use, but without PFAS concentration data, and which can be considered likely to be contamination sources.
For example, companies that buy fluoropolymers such as PTFE, ECTFE or FEP in the form of pellets to manufacture their own branded products containing PTFE or thermoplastics items, or aqueous film-forming foam (AFFF) manufacturers.
The list of Known PFAS users was established by the FPP projects, and the proof of usage of PFAS products was often collected from the companies’ websites.
Category: Presumptive contaminations
Presumed sites of PFAS contamination are sites which can be expected to be contaminated on the basis of scientific investigations and expert advice (Salvatore et al., 2022). This approach posits that, “in the absence of high-quality data to the contrary, PFAS contamination is probable near facilities known to produce, use, and/or release PFAS, and to protect public health, the existence of PFAS in these locations should be presumed until high-quality testing data is available”.
The list of such sites with presumptive contamination was established during the FPP, and the methodology is detailed in Cordner et al. (2024). It consists of (i) fluorinated aqueous film-forming foam (AFFF) discharge and storage sites, and (ii) industrial facilities listed in the European Pollutants Transfer and Release Register (E-PRTR), filtered on their activity codes and (iii) sites related to PFAS-containing waste.
The methodology did not change, but we updated the data where possible (for example with newer data about airports, from the E-PRTR or concerning wastewater treatment plants).
Category: Measurements
Measurement sites are where PFAS concentrations have been measured within air, water, biota or solids. These data points have extra fields that indicate the details of the concentrations found (matrix type, sampling date, concentration for each substance, etc.). Measurements are the only type of point with details of which kind of PFAS is present.
Identifying PFAS
We kept data about any substance fulfilling the OECD, 2021 PFAS definition (OECD, 2021). In practice, we used PubChem7 to determine whether a substance should be considered as a PFAS, using the classification section.
Each individual PFAS is identified by its CAS number, supplemented where necessary with an isomer description (i.e. branched or linear). We kept these isomer values separated in the processed data and we always added a “total” substance when it was not present in the source data.
Data from institutional sources, for example about routine monitoring of drinking water, is usually gathered by using APIs or by scraping websites which contain PFAS and non-PFAS concentration values. We needed a “reference list” in order to filter such data sources. This reference list was first based on the 4729 PFAS8 established by the 2018 OECD PFAS definition (OECD, 2018), then extended manually each time that a data source was encountered with a PFAS that was missing on the list. Recognizing that this reactive approach was insufficient, we proactively extended our reference list by looking for lists of known PFAS, adding those that were missing. We considered (i) a list of 66 PFAS pesticide from Donley et al. (2024); (ii) a list of 192 pharmaceuticals corresponding to the OECD, 2021 PFAS definition (Hammel et al., 2022), and (iii) the substances listed in the parameter group “PFC (PFOA, PFOS)”9 of the SANDRE10 referentiel (used by French authorities). As of 19/11/2025, our list of PFAS contains 4948 substances and is published on GitLab11.
In order to properly identify PFAS in the different datasets, a list of PFAS synonyms was established12. It lists the denomination of the substance found in the source data, and the corresponding CAS number, plus the isomer indication if any (i.e. branched or linear). This list was first based on the “Synonyms” column of the 2019 OECD list of PFAS, then extended manually each time a dataset presented an unknown name for a PFAS. Research to identify the substance was carried out in the grey literature and using PubChem13.
Isomers
In some datasets, the distinction is made between branched and linear isomers of the same PFAS. We kept these values separated in the processed data and always added a “total” substance when it was not present in the source data.
Values below the limits of detection/quantification
When a PFAS is not detected, we only know that the concentration of this PFAS is zero or below the method’s limit of detection (LOD) or, if used as the reporting threshold, the limit of quantification (LOQ). The values of the LODs and LOQs were sometimes indicated, and in such cases we kept the data. In very few cases, the original data had values marked as “0”, “undetected” or “< LOD” without indicating the LOD; such data was discarded. Very few datasets mentioned both the LOD and LOQ. In such cases we considered that:
-
values <LOD are necessarily also <LOQ, but where marked as “less than [LOD]”
-
values >LOD but <LOQ were marked as “less than [LOQ]”
Units
The values in the source datasets were reported using various units, largely depending on the matrix in which the measurement was conducted. We converted the values so they are expressed as what is normally considered as part per trillion. In details:
-
concentrations in liquid volume were converted in nanograms per litre [ng/L]
-
concentrations in gas volume were converted in picogram per cubic metre [pg/m3]. Please note that we encountered some lines with units referring to concentrations in gas volume, but the values were always 0, with no indications of the LOD. As a result, these lines were skipped and there are currently no values for such concentration in the final dataset.
-
concentrations in wet weight were converted in nanograms per kilo (wet weight) [ng/kg fw]
-
concentrations in dry weight were converted in nanograms per kilo (dry weight) [ng/kg dw]
-
Concentrations in weight, with no precision of wet or dry, were converted in nanograms per kilo [ng/kg]
Deduplication
We kept only one value per dataset, coordinates, date, substance, matrix. If more than one value for the same combination of these fields was present in a dataset, we kept only the highest value, to highlight potential contamination.
Minimum information
We only retained data sources that included a defined geographical scope, preferably with coordinates, or at least with a city name. This excludes, for example, data from human biomonitoring samples. Regarding Measurements, we only considered individual values: we discarded values that corresponded to the average of different analyses over time, or to the sum concentrations for several PFAS.
Results
The PFAS Data Hub website
A website has been developed and published to share the PDH data. It is hosted by the CNRS at the address https://pdh.cnrs.fr, using Huma-Num14, a research infrastructure devoted to providing IT solutions for social sciences and humanities projects.
The website offers explanations about the project, its methodology, the technical processing of the data, the datasets and their sources and a geovisualisation tool to explore the results as well as options to download the data.
The code of the website is published on GitLab15 under the GNU AGPLv3 licence16. Most of the content is static, except the page describing the datasets, and the map, which are based on the data that is processed each night.
The website is multilingual, and is available in English and in French, although for now, most of the content is only available in English. The map has been fully translated into French.
The geovisualisation tool
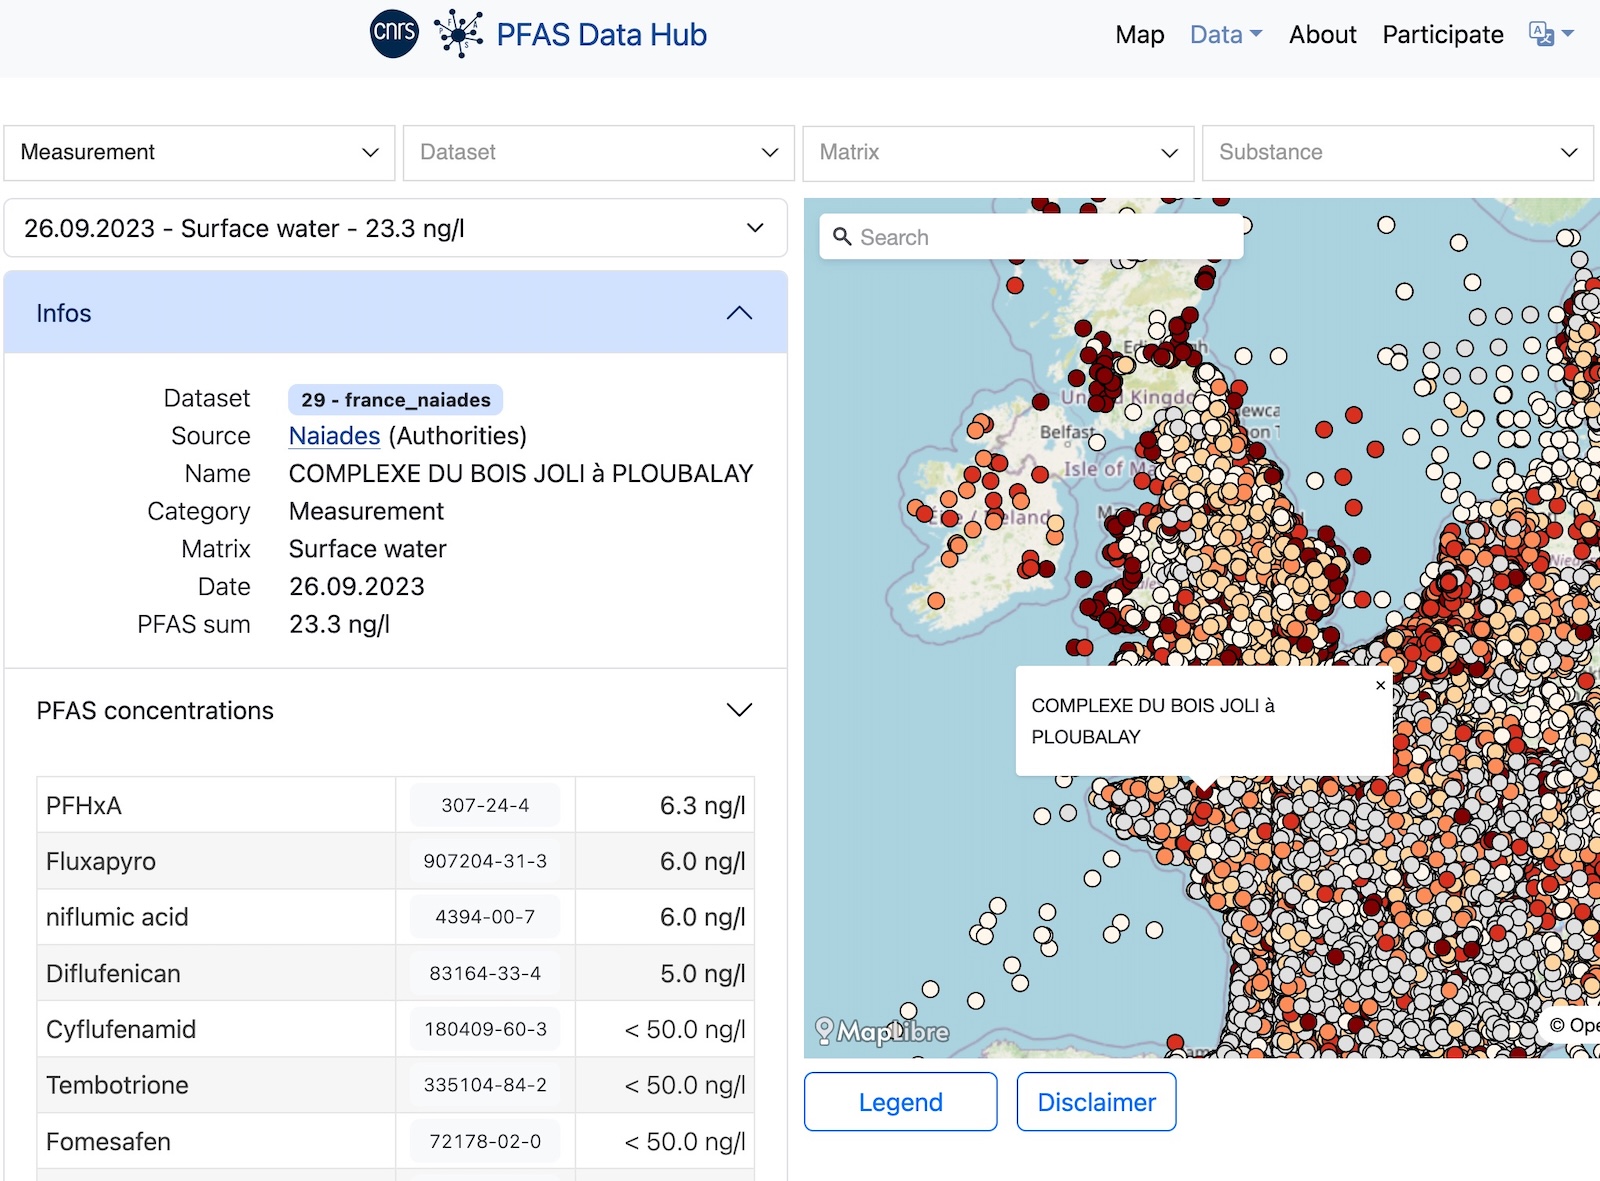
The map17 can be used to explore the PDH data in an interactive way. The points are displayed on the map and clicking on these leads to more details appearing on the left of the map, as shown in Figure 1.

Figure 1 - Screenshot of the geovisualisation tool of the PDH website - Nov. 2025
It is possible to filter the data points by category (Measurements, PFAS production facilities, Known PFAS users, Presumptive contaminations. However, only one can be selected, so that the map only shows one category at a time), by dataset, by matrix (surface water, groundwater, biota, etc) or by PFAS compound. It is possible to export the filtered data in formats: file format (csv or parquet); having the PFAS concentrations in a JSON array or as separate columns; including or not the “details” column, which is a JSON object containing extra fields that we could not represent in our data model.
Contact email
Although basic, the creation of a contact email (pdh.cnrs@proton.me) enables users to contact us easily regarding any technical or interpretation questions about the data, or to indicate new datasets to consider for integration.
Data download
The complete PDH data is available on the download page18, as a csv file or as a Parquet file. It can also be downloaded per dataset from the datasets page, and the map offers the option to apply filters and export the filtered dataset.
The PFAS Data Hub dataset
The data produced by the PDH project is updated daily, its most recent version is available on the PDH website: https://pdh.cnrs.fr/download. The following analysis was done on the data of April 17, 2026, which is available here for reference: https://doi.org/10.5281/zenodo.19627467.
From a data science perspective, the PDH provides spatiotemporal series tracking the contamination of various environmental matrices across space and time in Europe.
In the PDH, the different spatiotemporal series are aggregated within a single tabular structure, which can be exported in CSV and Parquet formats via the portal. Here, having a single table removes the need to assign an ID to each row, and to ensure the consistency of such ID. Each row corresponds to a specific data point in space for PFAS production facilities, Known PFAS users, Presumptive contamination points (spatiotemporal series of size 1); and in space, time and for a given matrix and unit for Measurement points (spatiotemporal series of size N). Each data point of each series is associated with multiple features specifying:
-
its provenance (dataset_id, dataset_name, source_text, source_type, source_url, data_collection_method);
-
its location (lat, lon, country, city, name);
-
nearby human activities (category, type, sector);
-
its measurements (date, year, matrix, unit, pfas_values, pfas_sum);
-
its additional metadata (details).
Measurement values for a given data point are nested inside the pfas_values field. Each value is associated with 4 other features specifying the substance measured, its CAS number, its isomer and the unit of measurement. Additional metadata are nested inside the details field as key-value pairs.

Figure 2 - Distribution of data points per category of point
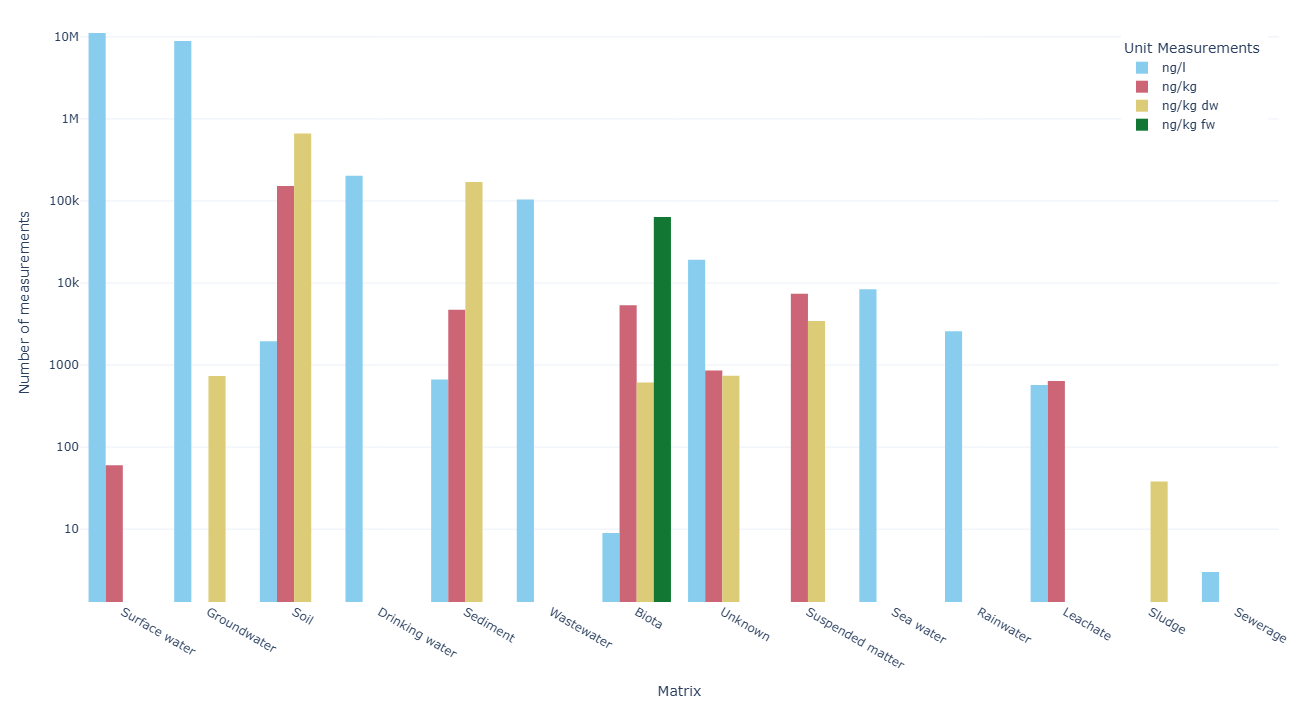
As of April 2026, the PDH contains 21,473,889 individual PFAS concentration measurements nested inside 939,852 Measurement data points (98.7% of all data points) form more than 97,186 spatiotemporal series of size N, as illustrated in Figure 2. As shown in Figure 3, the sizes of the spatiotemporal series are highly irregular and vary between 1 and 838. For now, most series are small, consisting of only a few points. This could change in the future, as new data are regularly ingested into the PDH.
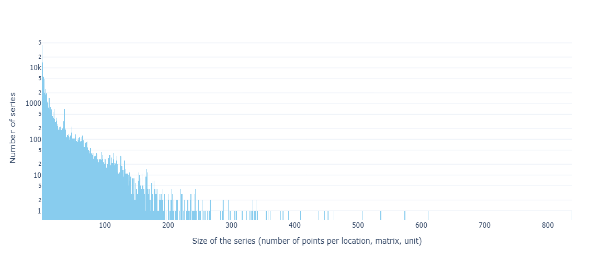
Figure 3 - Size of the PDH spatiotemporal series
In terms of spatial distribution, the data points of the PDH are spread across 33 countries in Europe. Figure 4 shows the distribution of data points – as well as unique locations and measurements – per country. Most are located in France (71.5%), Belgium (6.2%) or in the rest of central-western Europe (Italy, Germany, the UK, the Netherlands, etc.).

Figure 4 - Distribution of unique locations19, data points and measurements per country
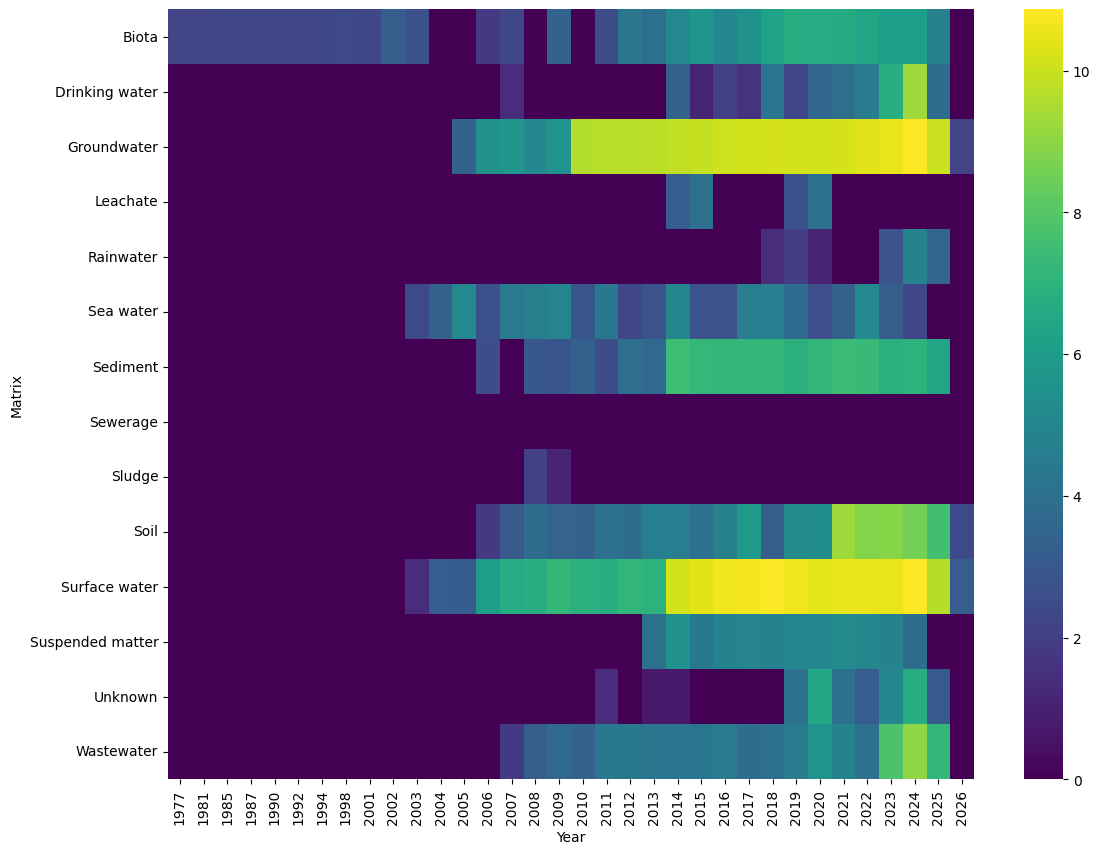
In terms of temporal distribution, the data points are spread across 49 years, from 1977 to 2026. However, as shown in Figures 5 and 6, most of the points are associated with dates after 2010. The PDH provides some data covering the 2000s, and the rest are more marginal points located in the United Kingdom. Overall, only a few countries have uniform coverage of the more recent collection period (after 2010), namely France, Germany, Italy, the United Kingdom and Belgium after the mid-2010s. It should also be noted that the volume of new data produced on PFAS contamination has remained stable over the past ten years. If this trend continues over the next few years, it is therefore reasonable to expect that the volume of data contained in the PDH could continue to increase at a rate of at least 2 million new measurements (or 80,000 new points) per year.

Figure 5 - Distribution of unique locations, data points and measurements per year

Figure 6 - Distribution of data points per year and country. Colours represent the log of each co-occurrence frequency
Discussion
Data limitations
Selection bias
The first search for data about PFAS contamination was carried out by the team of the FPP, which was based in 13 different European countries, leaving out European countries where the data research was not as thorough. For example, Poland or Austria appear almost empty on the map, at least for Measurements.
Another type of bias exists upstream of the PDH data process: the selection of which PFAS are searched within samples. For instance, we currently have very little data on trifluoroacetic acid (TFA, the shortest PFAS) because its occurrence had hardly been investigated by institutions or in research papers until recently. On the contrary, concentration values of some PFAS pesticides are very common in our data, because they have been included in certain countries’ routine surveillance of surface or groundwater for many years, without having been labelled as PFAS.
The FPP searched for data in 2023, in the scientific literature, open source information, and via requestss to national or local authorities. During the PDH projects we looked for new institutional sources of data but did not search again in the scientific literature, although new data is certainly available because concern about PFAS pollution has grown since then.
Heterogeneous sources
As of November 2025, we gathered 116 different datasets, from which 105 only contain Measurement points. Although these datasets are similar in their function (i.e., they all show the results of measurement campaigns), they greatly differ in their formats, units used, coordinate systems, and in the logic that was applied to their data. These semantic differences should be carefully studied and addressed before any analytical processing of the data using algorithms based on notions of distance (among others).
Users of the PDH data should be aware of the different data sources and seek to understand the limitations of each of the datasets they use. Also, if one project uses only data coming from a single dataset, it would probably be more relevant to use the data directly from that source.
We will now list potential sources of mistakes or inaccuracy that we have identified during the project.
Rounded or inaccurate coordinates
On multiple occasions we found errors in coordinates in the data that we used, like interverting latitude and longitude. Some datasets present data with rounded coordinates, which are both hard to detect and misleading, since it is displayed on the map on a very precise point that could be a few kilometers away from the actual point.
Units
We encountered all sorts of units in the different datasets of the project, and converted them in Parts per Trillion (see units). For concentrations in solids, units were either expressed as concentration in kg of dry matter, kg of fresh matter (i.e., biota), or sometimes without precision as concentrations per kg of matter. Caution is therefore advisable when comparing concentrations in solids.
Identification of PFAS compounds
Surprisingly, identifying the individual PFAS compound corresponding to the concentrations found in the dataset was not a trivial task. PFAS were either referred to by their name (in different languages), their commercial names, their acronyms, or their chemical formulas. We established a list of “PFAS synonyms”. For example, the 30 synonyms we encountered for PFHxA, CAS number 307-24-4, are given in table 1:
Table 1 - Synonyms for PFHxA, CAS number 307-24-4, sorted by length
|
PFHxA |
|
pfhxa |
|
PFHXA |
|
NSC 5213 |
|
TaAn_PFHxA |
|
PFHxA μg/L |
|
PFhexncAcid |
|
PFHxA (ng/L) |
|
Perfluorhexansyre |
|
Perfluorhexansäure |
|
PFHxA incl precursor |
|
Perfluorocaproic acid |
|
Perfluorohexanoic acid |
|
Undecafluorocaproic acid |
|
Perfluorhexansäure PFHxA |
|
Undecafluorohexanoic acid |
|
Perfluorhexansäure (PFHxA) |
|
PFHxA (Perfluor-n-hexansäure) |
|
PFHxA (PerfluoroHexanoic Acid) |
|
PFHxA (PerfluoroHexanoic Acid); |
|
PFHxA Perfluoro-n-hexanoic acid |
|
Acido Perfluoroesanoico (PFHxA) |
|
Acidoperfluoroesanoico(ng/L)PFHxA |
|
PFHxA (acide perfluorohexanoique) |
|
Perfluoro-1-pentanecarboxylic acid |
|
Perfluorohexanoic acid (ng/L) PFHxA |
|
Acido Perfluoro Esanoico (ng/L) PFHxA |
|
perfluoro-n-hexanoic acid (PFHxA) μg/kg DS |
|
Hexanoic acid, undecafluoro- (6CI,7CI,8CI,9CI) |
|
2,2,3,3,4,4,5,5,6,6,6-Undecafluorohexanoic acid |
It is likely that we made mistakes in identifying substances, although we tried to automate this as much as possible to avoid copy-paste mistakes at least. Correcting the list of synonyms and subsequently rerunning the extraction and normalisation of the data should correct such errors.
PFAS compound forms
PFAS identification was performed using CAS numbers; consequently, the same substance may be represented by distinct identifiers if reported in both acid and salt forms. For example, we have data about CAS number 2795-39-3, which is the potassium salt of PFOS (CAS number 1763-23-1). We believe that such data about PFAS salt forms actually results from confusions, as the anion is always the analyzed species. Aligning the CAS numbers of these different forms to the CAS number of the acid form could be a potentially effective enhancement to the project.
We assessed the frequency of this issue and found around 7800 entries for salt forms of PFAS among the 20,77 millions values of the database (0.038% of the total), indicating that this is not a common problem.
The choice of geovisualisation
The implementation of the PDH and its intrinsic mode of data visualisation follows in the wake of the Forever Pollution Project, aiming to provide a cartographic representation of locations containing data on PFAS pollution, measured or suspected. The desire to represent pollution data cartographically is not trivial, and the interpretation of such data through maps must be approached with an awareness of the biases that such a representation can introduce. Countless studies have proposed cartographic representations of pollution, whether these were measured or modeled, current or future, and focused or not on a strictly defined site or a broader geographic area. The scientific literature is full of examples addressing the spatialization of pollution through various cartographic representations: contamination maps, exposure maps, hazard maps, vulnerability maps, and actual risk maps (Lahr & Kooistra, 2010). However, the cartographic representation of past pollutioncan only be undertaken if spatialized pollution data exist; moreover, such representation cannot compensate for the limitations or biases inherent in this data — such as selection bias — which are discussed in the following section. Nevertheless, representing past pollution (in terms of concentrations and/or spatial extent) poses significant technical challenges which make doing so extremely complex. The primary goal of PDH seeks to optimize the visualisation of PFAS data from various sources.
The geovisualisation on the website was initially developed as a practical solution to verify that the data processing had been carried out correctly. It offers great value as a data exploration tool but can also be misinterpreted, especially if it is used without taking the time to read the methodology. Geovisualisation catalyzes the transition from raw data to informative data (Caillard, 2017). The decision to represent data through a point symbology on a cartographic medium reflects our deliberate choice for simplification, emphasizing the geographic coordinate pair – i.e., a location – linked to the pollution data. Points that correspond to Measurements are coloured based on the total concentration of all measured PFAS, expressed in ppt Parts per Trillions (i.e. ng/L for liquids, ng/kg for solids). This means that a concentration of 100 ng/L in surface water is represented similarly to a 100 ng/kg in biota or in sediment. For points with multiple measurements over time, the colour is based on the highest value for the sum of PFAS concentrations recorded for this sampling point. Thus, a point may show up as dark red for a single old high value (historical values for each point are displayed in the left panel of the map that appears upon clicking on this specific point). Establishing a finer solution for the colouring the concentration data points on the map would be an interesting future development of the project.
Some Measurements exhibited all PFAS concentrations below the LOD and are represented in light-grey. This could give a false impression of contamination-free zone because (i) early datasets often had a very high LOD, (ii) some Measurements only include values for very uncommon PFAS, while the most commonly monitored ones were not measured. For example, numerous Measurements in France’s drinking water dataset (# 124) only have concentrations for PFAS pesticides that have been included in routine surveillance for many years. The non-detection of these PFAS does not imply that other PFAS are also present at low concentrations. The geovisualisation tool enables a transformation from raw data to knowledge via an intermediate step of information processing: merging data within a common framework to enable co-visualisation, leveraging an interactive interface for selective representation (i.e., filtering), and ensuring a meaningful representation of the selected data to facilitate critical reading (Caillard, 2017). In this regard, the map in the era of GeoWeb is no longer merely a tool for representing spatialized data but serves as an interface for navigating and exploring increasingly massive and heterogeneous digital datasets (Mericskay, 2021). In our case, data can be potentially filtered and is rendered using a vector tile system that ensures high performance and rendering capabilities (Lienert et al., 2012). This shift in cartographic function aligns with broader trends in digital geography, where maps serve as dynamic platforms for real-time data integration, hypothesis generation, and decision support in environmental governance. Mapping can be considered as a tool, whether for examining spatiotemporal evolutions of potentially pathogenic emission sources or simply for communicating about a specific phenomenon. This tool may be used both within the academic sphere and in civil society and advocacy groups.
This dual ambition defines the PDH map: a tool for both communication and data exploration. More advanced analyses are not incorporated within the PDH interface, although it does allow users to export (in csv or Parquet format) all or part of the database for subsequent analysis by expert users. Such an approach balances accessibility with scientific rigour, thus ensuring that PDH serves as both a public engagement tool and a gateway for specialized research. The geovisualisation of PFAS contamination through the PDH tool, which inherently relies on dated data (i.e., measurements can be dated from a few days ago to several years ago), results in an interpretation that intertwines “certainty” and “uncertainty” (Arnaud & Davoine, 2009). Certainty is embedded in the Measurements data, which are represented with numerical values, timestamps, and geographic locations: a specific pollutant was measured at a specific place, at a specific time, with specific concentration levels. Geovisualisation states nothing beyond this and does not predict the persistence of the pollution over time, indicate potential migration pathways, or allow for an estimation of future concentration trends or variations. The choices made regarding the type of data represented — measured concentrations, suspected PFAS presence, or records of known PFAS users — introduce different forms of uncertainty. Measured data provide localized and temporally bounded evidence, yet they may not reflect broader contamination patterns. Suspected presence relies on indirect indicators or incomplete knowledge, which are inherently more uncertain. Data on known users of PFAS does suggest potential sources but does not necessarily translate into actual environmental releases or current detectable contamination levels. Bringing together these heterogeneous layers in a single map may create an impression of coherence, while in fact masking the diverse origins, degrees, and meanings of uncertainty associated with each data source. Geovisualisation should be understood as a communication device. By making data available through a map, it may create an impression of transparency and accessibility, while in practice the information remains difficult to interpret for non-specialists. This performative dimension – ”making data visible” without necessarily making them understandable geovisualisation can reinforce the perception that sufficient information has been provided, whereas the map may in fact conceal as much as it reveals. Consequently, users must engage critically with the PDH interface, acknowledging both its strengths and limitations, reinforcing the need for complementary modeling approaches.
Point-based mapping of PFAS contamination and potential interpretation biases
The use of point-based representations to map locations where PFAS have been measured or are suspected to be present carries inherent risks of misinterpretation. These risks stem, in part, from cognitive and perceptual mechanisms extensively studied in Gestalt theory (Koffka, 1922). When presented with complex and scattered information — such as a spatial distribution of discrete data points — the human brain tends to impose structure and patterns to simplify comprehension. While this cognitive process aids in understanding visual data, it can also introduce biases that may lead to incorrect conclusions about the spatial distribution and intensity of contamination. A key limitation of point-based mapping is its reliance on datasets that are not uniformly collected across space. The PDH database, for instance, integrates data from a variety of sources, including regulatory monitoring programmes, independent research studies, and local investigative initiatives. Many of these data points originate from drinking water catchment areas, which are spatially heterogeneous and not systematically sampled across the entire study region. Additionally, localized concerns about potential contamination often trigger targeted measurement efforts, which may, in turn, lead to further testing in the same areas. This feedback loop can create clusters of data points that may be mistakenly interpreted as regions of higher contamination, when in reality, they may simply reflect areas of intensified monitoring. It is therefore critical to caution users of the PDH database about these potential biases, particularly users without prior experience of spatial data interpretation. To this purpose, a disclaimer was incorporated into the PDH interface to help minimize potential misinterpretations of the visualized data. The gaps observed in the map primarily reflect data deficiencies rather than pollution-free areas. Consequently, while point-based representations are valuable tools for communicating the locations of known PFAS contamination, they can also inadvertently exaggerate spatial patterns of pollution, reinforcing misleading perceptions about contamination severity and distribution.
In summary, while point-based mapping provides an essential first step in visualizing and centralizing PFAS-related data, it is crucial to acknowledge its limitations. Misinterpretations can arise due to cognitive biases, non-uniform data collection, and the inherent simplifications of discrete point representations.
Concluding remarks
The PFAS Data Hub represents a significant step toward the centralization, documentation, and dissemination of environmental data on a group of contaminants that remains insufficiently monitored across Europe. By integrating heterogeneous sources, applying transparent methodologies and undertaking careful data normalization, the PDH not enables the geovisualisation of PFAS pollution but also facilitates data reuse for research and/or expertise. The project is rooted in the FAIR principles and thus embraces a collaborative and open science approach. It enables researchers, journalists, policymakers, environmental organizations, and citizens to explore and understand the scope and nature of PFAS contamination. It promotes transparency and empowers stakeholders to make informed decisions and take evidence-based action.
Nonetheless, several limitations must be acknowledged. Selection biases, source heterogeneity and challenges in interpreting geovisualised data may affect how the information is understood and used. In particular, while point-based mapping is essential for accessibility and public communication, it does not reflect the full complexity of PFAS contamination dynamics. The PDH does not aim to provide predictive models, but rather to serve as a reliable, up-to-date basis on which such models may be built.
Several directions for potential improvements have already been identified. These include the integration of PFAS data published in academic literature after 2023, the systematic collection of drinking water monitoring data, especially in light of forthcoming EU regulatory requirements in 2026, and a targeted effort to gather data from underrepresented regions, particularly in Eastern Europe. In this context, the scientific community is also invited to contribute by contacting us about PFAS data that has been published elsewhere to help expand and enrich the database. Some limitations of the geovisualisation tool could be addressed by assessing users’ understanding of the information presented, and adapting the visualisation default view, and / or the possible filtering options.
In this sense, the project provides a critical first layer of knowledge and engagement. Its ongoing enrichment offers promising perspectives for advancing long-term environmental monitoring and research on PFAS contamination.
Appendices
Appendix 1: Supplementary material - detailed quantitative description of the PDH dataset. DOI: https://doi.org/10.5281/zenodo.17761605
Acknowledgements
The authors would like to thank the Forever Pollution Project, whose innovative work was the ground layer on which this project was built; and in particular Stéphane Horel, who was the connection between the FPP and the CNRS.
Before the launch of the project and at different points during its course we organised calls with a broader group of researchers interested in the topic of PFAS and in the data resulting from the FPP. We thank them all for their valuable input.
We warmly thank Huma-Num, the research infrastructure hosting our server, for their kind and efficient support.
Preprint version 3 of this article has been peer-reviewed and recommended by Peer Community in PCI Ecotoxicology and Environmental Chemistry (https://doi.org/10.24072/
pci.ecotoxenvchem.100286 Charles, 2026).
Funding
This project was undertaken at the initiative of CNRS Humanities & Social Sciences, with funding from the French Ministry for Higher Education and Research.
Conflict of interest disclosure
All the authors declare that they have no known competing financial interests or personal relationships that could have appeared to influence the work reported in this paper.
Data, scripts, code, and supplementary information availability
The raw data sources and all data treatments are available on Gitlab, as well as on Zenodo with a DOI identifier, in the version of November 21st, 2025. For readiblity, there are two separate projects:
-
Data project
Gitlab: https://gitlab.com/pfas-data-hub/pdh-data
DOI: https://doi.org/10.5281/zenodo.17672526 -
Website project:
Giltab: https://gitlab.com/pfas-data-hub/pdh-web
DOI https://doi.org/10.5281/zenodo.17672648
-
Since 2015, the PFAS Project Lab has conducted interdisciplinary research on the social, scientific, and political dimensions of PFAS contamination. Initiated by the Northeastern University’s Social Science Environmental Health Research Institute, it is supported by grants from the National Science Foundation, the National Institute of Environmental Health Sciences, and Whitman College, https://pfasproject.com↩︎
-
https://experience.arcgis.com/experience/12412ab41b3141598e0bb48523a7c940/↩︎
-
The CNRS has actively contributed to structuring scientific discussions on PFAS issues by organizing dedicated events, including the international conference in Lyon Environmental and occupational health: from data to evidence in May 2023 and the conference PFAS: Challenges and Alternatives in December 2023.↩︎
- ↩︎
-
Excel with the PFAS list: https://www.oecd.org/content/dam/oecd/en/topics/policy-sub-issues/risk-management-risk-reduction-and-sustainable-chemistry2/pfas-report-support-materials/global%20database%20of%20per%20and%20polyfluoroalkyl%20substances.xlsx↩︎
-
https://www.sandre.eaufrance.fr/v2/page/referentiel-technique-sandre↩︎
-
https://gitlab.com/pfas-data-hub/pdh-data/-/blob/main/data/settings/substances.csv↩︎
-
https://gitlab.com/pfas-data-hub/pdh-data/-/blob/main/data/settings/substance_synonyms.csv↩︎
-
Unique pair of coordinates (lat, lon).↩︎
-
↩︎
The few illogical values, like concentration in Biota in ng/l, corresponds to error in the source data.