


 CC-BY 4.0
Extended Online Report
In an effort to facilitate the understanding and reproduction of all the details of the study, analyses and results—both for peer review and for future reuse—we have provided what we call an “Extended Online Report” (EOR) alongside this research paper: an interlinked, executable documentation site going well beyond a conventional supplementary PDF. It contains everything needed for the practical implementation of the research, as well as additional information on their rationale and the reasoning behind our choices, including exploratory analyses and narrative context not included in this manuscript for space. This report, produced using the R package structure for reproducibility (see Wickham & Bryan, 2023), is available here: https://m-delem.github.io/aphantasiaEmotions/. Throughout this manuscript, citations of the form EOR: Page name, §Section point to a specific page and section of that site, rather than to the repository or the website in general. Beyond this specific study, the underlying reporting structure is intended as a reusable template so that other researchers may adapt it for their own use. The underlying code is permanently archived in a registration with a DOI alongside public materials on the Open Science Framework (https://doi.org/10.17605/OSF.IO/WCAVX).
Introduction
Aphantasia is a phenomenon defined as a diminished or complete absence of visual mental imagery (Zeman et al., 2015). The Vividness of Visual Imagery Questionnaire (VVIQ, Marks, 1973) is the most commonly used instrument to assess aphantasia. Participants are asked to visualize mentally different scenes and to score the vividness of the mental image created. The total score ranges from 16 (complete aphantasia) to 80 (hyperphantasia), but the cut-off score below which people are considered aphantasics varies substantially across studies: most commonly it is 32 (e.g., Ale & Burns, 2024; Keogh et al., 2021; Liu & Bartolomeo, 2023; Wicken et al., 2021), but there are also studies that use stricter thresholds such as 25 (e.g., Bainbridge et al., 2021), 23 (e.g., Monzel et al., 2024a; Zeman et al., 2020), or 16 (e.g., Le Clézio et al., 2026; Reeder et al., 2024). Recent studies (see Wright et al., 2024) have estimated the global prevalence at approximately 1% for complete aphantasia (i.e., total absence of visual images), 3% for hypophantasia (weak visual imagery), 90% for typical imagery ability and 6% for hyperphantasia (extremely vivid imagery). Rather than being considered as a deficit, aphantasia is increasingly described as a neutral form of neurodivergence (Monzel et al., 2023a, 2023b), though whether it carries any broader impact on socio-professional functioning remains an open question rather than a settled absence of effect. Individuals with aphantasia are often unaware of this specific cognitive profile and seem to rely on alternative strategies for mental representation (Delem et al., 2025; Reeder et al., 2024). Notably, a growing body of evidence shows that they perform comparably to individuals with typical imagery abilities on a wide range of tasks traditionally assumed to depend on visual imagery. These include working memory paradigms (e.g., Keogh et al., 2021; Knight et al., 2022; Reeder et al., 2024), mental comparison tasks (Liu & Bartolomeo, 2023), as well as assessments of declarative memory in both visual and verbal domains, such as Pattern Recognition Memory and Verbal Recognition Memory tasks (Pounder et al., 2022). However, an increased incidence of face recognition impairment has been reported (Maw et al., 2025) and performance in two cognitive domains does appear to be consistently modulated by aphantasia: autobiographical memory and emotional sensitivity are diminished in aphantasics (Argueta et al., 2025; Dawes et al., 2020, 2022; Monzel et al., 2024a, 2024b; Watkins, 2018; Wicken et al., 2021).
While most psychological theories of emotion do not consider visual imagery as a pre-requisite for emotional feeling (Moors, 2024), several authors put forward the hypothesis that certain components of emotions may rely on visual imagery, such as the ability to evoke, amplify and sustain emotions based on past memories (e.g, Boccaccio et al., 2024; Holmes & Mathews, 2010; Küssner et al., 2019). The operational process behind this hypothesis could be that mental imagery would help to navigate from a semantic or symbolic representation to an experiential one. According to this framework one may expect that a diminished or absent visual imagery should impair some emotional components. In this study, following the hypothesis of a functional link between visual imagery and emotions, we aimed at testing whether the level of visual imagery ability, absent for complete aphantasia, was related to the level of subjectively perceived emotional difficulties, which are high in what’s known as alexithymia. Historically, the term “alexithymia” was created in the 1970s to describe the condition of patients with somatoform disorders associated with emotional difficulties. In more recent decades, the field has shifted towards describing alexithymia as a relatively stable personality trait rather than a categorical disposition of individuals (i.e., alexithymic vs. non alexithymic), and it is supposed to be normally distributed in the general population, with higher alexithymia scores in clinical populations (Yeung et al., 2025). Alexithymia is defined as a three-faceted personality trait characterized by difficulties identifying one’s feelings (DIF), difficulties describing one’s feelings (DDF), externally oriented thinking (EOT), and a cognitive style characterized by low introspection and attention to feelings (Luminet & Nielson, 2025). It is considered as a transdiagnostic factor for psychopathology and physical health conditions (Luminet et al., 2026). From a mechanistic point of view, alexithymia has been observed to moderate different cognitive processes involved in emotion regulation (Luminet et al., 2021). The trait is mainly measured by self-report instruments, the most popular of which is the twenty-item Toronto Alexithymia Scale (TAS-20, Bagby et al., 1994). While total alexithymia scores are most frequently used in the literature, empirical evidence supports a differentiated moderating role of the three facets of alexithymia (DIF, DDF, EOT) on cognition, which warrants a facet-level approach when studying this trait, e.g., the link between DDF and the propensity to suppress emotions (Luminet & Nielson, 2025).
Consistent with the hypothesis of a relationship between aphantasia and alexithymia, a recent experimental study by Monzel et al. (2024a) suggested a link between visual imagery ability and alexithymia, measured respectively by the VVIQ and the TAS-20. In this study, 30 participants with weak or no visual imagery (VVIQ ≤ 23) showed significantly higher scores at the DDF and EOT subscales of the TAS-20 than 75 typical imagers (VVIQ > 32). However, a recent study by Kvamme et al. (2026) presented a more complex picture. Their primary reported result concerns a large sample in which the authors observed opposite linear relationships between the VVIQ and the total TAS-20 scores in an “aphantasia” group defined as VVIQ ≤ 32 (N = 153) and a “control” group with VVIQ > 32 (N = 680). In the control group, as expected, the lower the VVIQ, the higher the TAS-20. Conversely, in the aphantasia group, the higher the VVIQ, the higher the TAS-20. The authors subsequently compared directly what they called core aphantasia (VVIQ 16-23) against hypophantasia (VVIQ 24-32) within their own sample, and found hypophantasics consistently scoring higher on alexithymia than core aphantasics, though this specific comparison did not reach conventional statistical significance in their smaller subsample. At first glance these results seemed difficult to reconcile or understand within a unified framework and highlighted that to progress on the understanding of the link between aphantasia and alexithymia, several methodological limitations had to be addressed: 1) the sample size is likely to have a major impact on the granularity of the trends observed, particularly in Monzel et al. (2024a), 2) the two teams used different VVIQ thresholds to define visual imagery ability categories, 3) Kvamme et al. (2026) did not analyse the TAS-20 subscales (it was not the main focus of their study), and 4) the two teams used different analysis methods (t-tests between groups vs. correlations within groups).
The present study aims to unify these findings and clarify the nature of the relationship between visual imagery and alexithymia using the VVIQ and TAS-20. To this end, we sought to: 1) increase the sample size by gathering as much data as possible on these two questionnaires to obtain robust results; 2) use a refined categorisation of the VVIQ into 4 groups that has proven to be highly relevant in recent research on aphantasia (e.g., Delem et al., 2025; Le Clézio et al., 2026; Purkart et al., 2024; Reeder et al., 2024; Wright et al., 2024), in particular by differentiating between complete aphantasia, i.e., no visual imagery (VVIQ = 16) and hypophantasia, i.e., weak visual imagery (16 < VVIQ < 33); 3) formally compare a broad space of linear, categorical, and non-linear models to test the stability of the patterns described by Kvamme et al. (2026) with a data-driven method independent of arbitrarily defined groups, rather than committing to a single analytical approach in advance; and 4) analyse the TAS-20 subscales to identify possible differences between the three facets of alexithymia. This analysis plan was designed to increase the reliability and reproducibility of the results obtained from the study of the VVIQ and TAS-20, thereby enabling conclusions to be drawn with confidence about the links between the spectra of visual imagery and alexithymia.
Methods
Questionnaires
The Vividness of Visual Imagery Questionnaire (VVIQ; Marks, 1973) is a self-report questionnaire used to assess visual imagery ability. It is a 16-item scale that asks participants to visually imagine a person and several scenes and to rate the vividness of these mental images using a 5-point scale ranging from 1 (“No imagery at all, you just know you’re thinking about the object”) to 5 (“Perfectly clear and as vivid as normal vision”). Scores range from 16 to 80. The internal reliability (Cronbach’s α) of the original VVIQ is .88 (McKelvie, 1995). The VVIQ was also validated in French (Landry et al., 2025), showing excellent reliability (McDonald’s ω = .94). Recent studies have shown that the psychometric properties and distributions of VVIQ scores were stable across different languages (Wright et al., 2024). In the present work, four categories were defined based on VVIQ scores, following the classification proposed by Reeder et al. (2024) (see Data analysis below for the exact cut-offs).
The twenty-item Toronto Alexithymia Scale (TAS-20; Bagby et al., 1994) assesses alexithymia using three subscales, namely Diffoculty identifying feelings (DIF, 7 items, e.g. “I have feelings that I can’t quite identify”), Difficulty describing feelings (DDF, 5 items, e.g. “It is difficult for me to find the right words for my feelings”) and Externally-oriented thinking (EOT, 8 items, e.g. “I prefer talking to people about their daily activities rather than their feelings”). Participants must indicate the extent to which various statements involving emotions identification, description or avoidance apply to them on a 5-point scale ranging from 1 (“Strongly disagree”) to 5 (“Strongly agree”). Total score range from 20 to 100. A frequent use of the TAS-20 is to categorize participants or patients as falling above or below a “clinical cut-off” of ≥ 61. This cut-off, or clinical threshold was based on the distribution of a general population and has been questioned since (Luminet & Nielson, 2025). The TAS-20 was also validated in French, showing similar properties to the English version (Watters et al., 2019). The three-factor structure and psychometric properties of the TAS-20 demonstrated good generalisation across different languages, with average estimates of subscale reliability (McDonald’s ω) of .84, .75 and .62 for DIF, DDF, and EOT, respectively (Schroeders et al., 2022). The EOT scale is often found to have lower internal consistency than the other two, which has been attributed to possible response bias and the inclusion of unique constructs (valuation of emotional life and pragmatic thinking, see Bagby et al., 2020; Luminet & Nielson, 2025).
In the present sample (comprising data pooled from 5 different studies), reliability was excellent for both questionnaires (McDonald’s ωVVIQ = .98; ωTAS = .89; see EOR: Sample description,§Questionnaire reliability for the full breakdown). At the subscale level, DIF and DDF showed comparably strong reliability (ω = .91 and .85, respectively), while EOT was comparatively weaker (ω = .73), mirroring the pattern already reported for this scale across the wider literature and worth bearing in mind alongside its comparatively weaker effects reported below.
Datasets used
Two original and previously unpublished datasets were used in the present study. These data were collected in two different laboratories as part of larger research projects. The first, referred to as “Ruby_2025” in Figure 1 (dataset archived in Delem, 2026a), was collected from February 2025 to January 2026 in France by Perrine Ruby, senior researcher at the Lyon Neuroscience research Center (France), in an online experiment dedicated to the investigation of the sensory and emotional characteristics of autobiographical and dream memories. A total of 225 French participants (180 females, 42 males, 3 “other”, Mean age = 36, SD = 16.1, range: 10-82), recruited by an announcement on social media and on mailing lists dedicated to research volunteers in Lyon and Paris, completed VVIQ and TAS-20 together with sensory and emotional scales to describe the one autobiographical memory from the day before and the one dream memory from the night before they had to report. The inclusion criterion was to have a memory of a dream from the night before when filling in the questionnaire. No information enabling identification was collected, and the study was carried out following the French ethical regulations (Loi Jardé n◦2012-300) and the Declaration of Helsinki. Participants were not compensated for their participation, which lasted most of the time between 15 and 35 min. The second dataset, referred to as “Mas & Luminet_2025” in Figure 1 (dataset archived in Delem, 2026a), was collected by the second and third authors as part of a preregistered lab experiment on alexithymia and mental representations (Mas, 2025). 123 French-speaking participants (110 females, Mean age = 19.78, SD = 1.15, range: 18-24) were recruited in exchange for course credit for the completion of a research methodology course being part of a Psychology Bachelor’s Degree. Participants were invited to the lab and completed the VVIQ and TAS-20 along with other measures and socio-demographic information (see Mas, 2025). No inclusion or exclusion criteria were specified. All participants signed informed consent prior to the study, which was approved by the Ethical Commission of the Institute for Psychological Sciences, UCLouvain (file number 2025-21, approval date: March 14, 2025).
These data were combined with three datasets retrieved from previous studies. Ale & Burns (2024) collected VVIQ and TAS-20 data as part of a study on aphantasia, alexithymia and PTSD symptomatology. 192 English-speaking participants (122 females, 3 other genders, Mean age = 38.7, SD = 11.4, range: 18-86) were recruited via social media platforms. Monzel et al. (2024a) collected VVIQ and TAS-20 data as part of a study on aphantasia, alexithymia and affective processing. 105 English-speaking participants (74 females, Mean age = 27.9, SD = 9.29, range: 18-59) were recruited via the authors’ database of the Aphantasia Research Project Bonn. Their dataset is available through a view-only link on the Open Science Framework (OSF; https://osf.io/y9c8g/?view_only=1e6bd8670a3f4eacb1cf0f600343205e). Finally, Kvamme et al. (2026) collected VVIQ and TAS-20 data as part of a study on mental imagery, mental health, subjective interoception and alexithymia. 833 English-speaking participants (426 females, 5 other genders, Mean age = 40.5, SD = 13.4, range: 18-83) were recruited through Prolific and a pre-existing database of individuals with aphantasia to cover the full range of imagery vividness. The authors gave their consent for their data to be reused in the present study.
All datasets used in this study, cleaned and merged into the single pooled file our analyses run on, as well as each individual dataset separately, are openly available in the “Files” of this study’s own OSF project (https://osf.io/b837s/files/osfstorage), regardless of the original access route of each individual dataset described above. All the original authors have given their consent for their VVIQ and TAS-20 datasets to be reused and made publicly available.
Data analysis
We considered six candidate models, summarised in Table 1, reflecting three ways VVIQ can enter a model: as an unstructured continuous predictor, as a set of discrete groups, or as a continuous predictor whose relationship to TAS-20 is allowed to change shape. As a baseline, we fitted a naive linear model treating VVIQ as a single continuous predictor with a constant slope across its full range. We then fitted two categorical models: the four-group classification defined above (aphantasia, VVIQ = 16; hypophantasia, VVIQ ∈ [17, 32]; typical imagery, VVIQ ∈ [33, 74]; hyperphantasia, VVIQ ≥ 75), and a coarser two-group split (VVIQ ≤ 32 vs. above) matching the threshold most commonly used elsewhere in the literature (e.g., Ale & Burns, 2024; Kvamme et al., 2026). To allow for a non-linear relationship without assuming its shape in advance, we fitted a generalised additive model (GAM) using a thin-plate regression spline smooth term, with no manual selection of knot count or placement. We further fitted a segmented (broken-stick) model with a single freely-estimated breakpoint k, seeded by a fast, frequentist spline search (via the earth package, Milborrow S. Derived from mda:mars by T. Hastie and R. Tibshirani., 2018) rather than fixed a priori. Finally, motivated by a marked concentration of low TAS-20 scores specifically among participants at the very floor of the VVIQ scale (VVIQ = 16, where within-group VVIQ variance is necessarily zero), we fitted what we call a “floor-group model”: a linear model in VVIQ with an additional term allowing a group-specific mean shift only for this floor group (i.e., complete aphantasics), rather than a freely-estimated breakpoint anywhere on the continuum.
We compared these six models using approximate leave-one-out cross-validation (loo, Vehtari et al., 2017), which estimates each model’s expected out-of-sample predictive accuracy (expected log pointwise predictive density, or elpd) rather than in-sample fit alone. We report pairwise differences (elpd _diff) relative to the best-fitting model, together with their standard errors; a difference much larger than its standard error indicates the two models are reliably distinguishable, while a difference within roughly one standard error indicates the models are effectively equivalent in predictive performance (Vehtari et al., 2017). We selected our final model on this basis, prioritising models within this top-performing cluster, and additionally on grounds of parsimony and mechanistic interpretability among models that performed comparably well.
Model | Formula | VVIQ treated as |
|---|---|---|
Naive linear | TAS ∼ VVIQ | continuous |
2-group categorical | TAS ∼ group2 | aphantasia (VVIQ ≤ 32) vs. rest |
4-group categorical | TAS ∼ group4 | aphantasia / hypophantasia / typical / hyperphantasia |
GAM | TAS ∼ s(VVIQ) | continuous, smooth non-linear |
Segmented | TAS ∼ a + b1VVIQ + b2(VVIQ−k) · I(VVIQ>k) | continuous, one estimated break-point k |
Floor-group | TAS ∼ VVIQ + complete_aphant | continuous, with a group-mean shift only where VVIQ has zero variance (“complete_aphant”, VVIQ = 16) |
Table 1 – The six candidate models compared in this study. In the segmented model, I(...) denotes an indicator function (1 if the condition holds, 0 otherwise). The segmented model’s break-point k and the floor-group model’s mean shift are both estimated from the data, with full posterior uncertainty, rather than fixed by the researchers.
Bayesian modelling was used for all analyses using the brms R package (Bürkner, 2017). To avoid overloading this article, priors and model fitting are reported on EOR: The model-comparison arc, sampling settings on EOR: Implementation notes, and prior and posterior predictive checks on EOR: Model diagnostics. We planned to analyse estimated marginal contrasts (i.e. differences in model-estimated marginal means, hereinafter denoted ∆) between groups for categorical models, and estimated slopes for continuous models (i.e., TAS-20 trends at each point of the VVIQ continuum, based on the first derivatives of the models). Following the guidelines of Makowski et al. (2019), we chose to summarise the results of our Bayesian models, i.e., the posterior distributions of the contrasts and slopes, using the medians of the distributions, their 95% equal-tailed credible intervals (CI), probabilities of direction (pd) and “Regions of Practical Equivalence” (ROPE). We preferred pd and ROPE-based analyses to Bayes Factors (BFs) because they are much less sensitive to the choice of priors than BFs, since these two indices are based solely on the posterior distribution, whereas BFs are based on comparison with a prior model.
The pd is an index of effect existence which can be defined as the proportion of the posterior distribution that is of the median’s sign (ranging from 50% to 100%), and can be interpreted as the probability that an effect is strictly positive or negative. It is simple to interpret, robust, and has a 1:1 correspondence with the frequentist p-value. Makowski et al. (2019) suggest 95, 97 and 99% as reference pd values to help interpretation of the likelihood of an effect existing, as they correspond approximately to two-sided p-values of 0.1, 0.05 and 0.01. As with the p-value, however, the pd cannot confirm the absence of an effect.
The ROPE is an index of effect relevance (in the sense of important enough to be cared about) that defines a range of effect sizes considered too small to be of substantive importance for the research question. As suggested by Kruschke (2018), without domain knowledge, a default ROPE can be defined as ±0.1 SD of the dependent variable; we use this default throughout for group contrasts, since we are not aware of an established, TAS-20-specific convention for what constitutes a practically meaningful score difference on this scale, and the raw response scale itself offers no natural anchor for this purpose. We report the ROPE ranges chosen for each analysis. Next, the proportion of the posterior distribution falling within the ROPE allows conclusions to be drawn, with the interesting property of providing a continuous index of relevance that is easy to interpret instead of an arbitrary dichotomous one. Nonetheless, if categorisation (which is more common practice in psychology) is needed to facilitate interpretation, Makowski et al. (2019) suggest as simple reference values that a posterior distribution with more than 95% overlap with the ROPE represent a very likely irrelevant (i.e., practically negligible) effect, whereas a posterior distribution with less than 5% overlap with the ROPE represents a very likely relevant (i.e., practically meaningful) effect.
For continuous slopes rather than group contrasts, the ±0.1 SD default is not directly applicable, since a raw slope (change in TAS-20 per one-point change in VVIQ) and the dependent variable’s own SD are not on the same scale. For these, we instead used a Cohen’s-d-motivated, rescaled ROPE of ±0.2×SD(TAS)/SD(VVIQ), following the same underlying logic (a small-effect-sized threshold) applied to the appropriate scale for a slope rather than a mean difference.
Results
Sample description
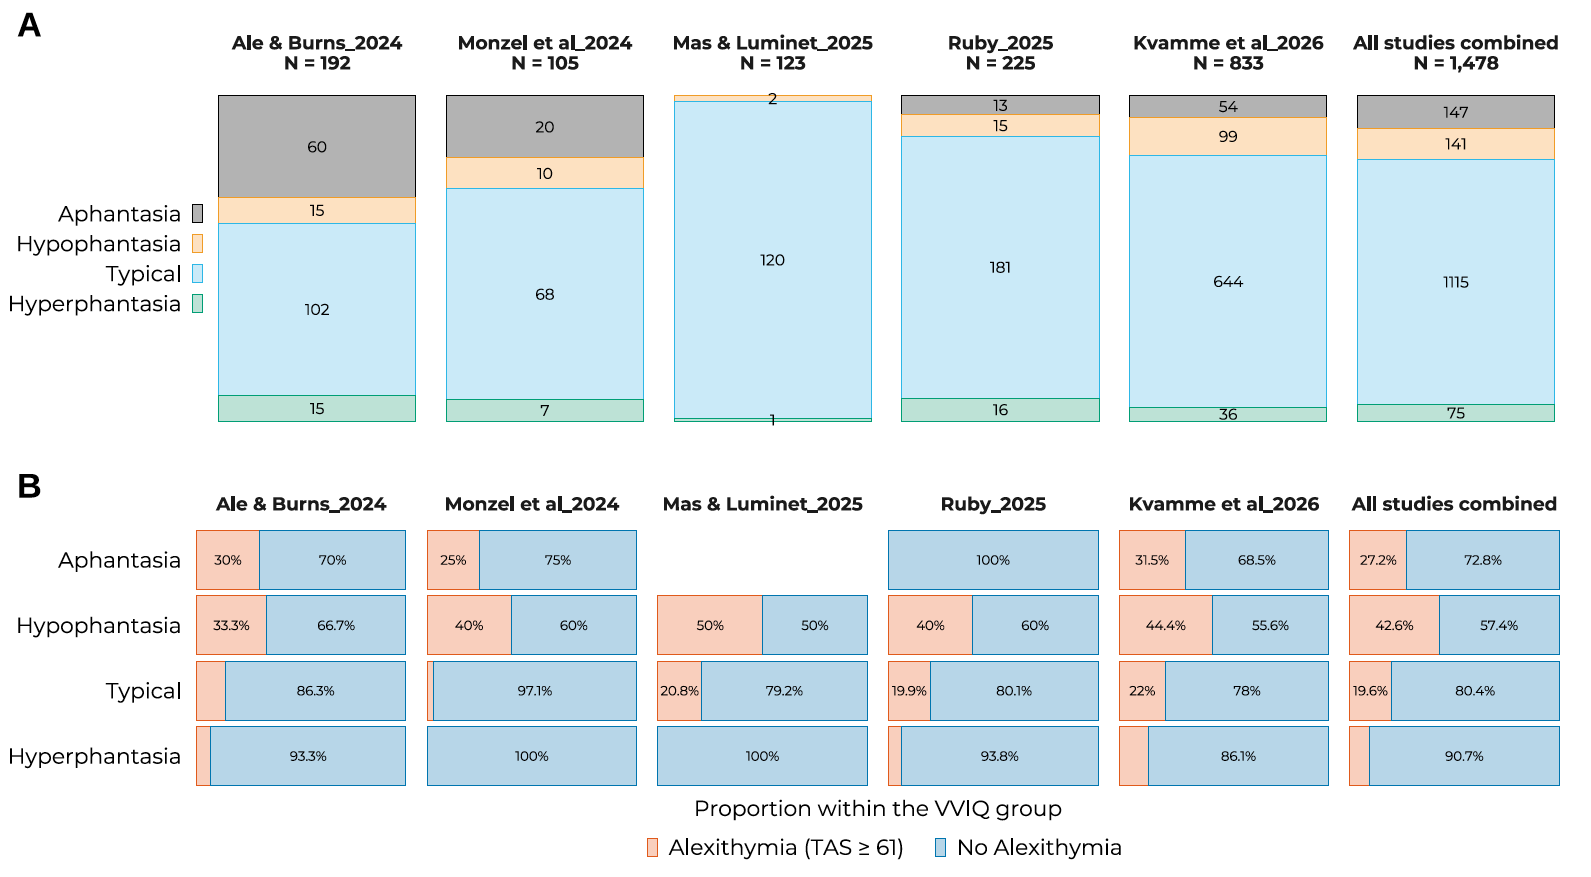
Figure 1 – Description of the VVIQ groups and alexithymia proportions for each dataset.
A) Stacked bar charts representing the relative size of each VVIQ group in each dataset, with the number of participants in each group indicated in the bars. B) Proportion of participants meeting the clinical alexithymia cut-off (TAS ≥ 61) within each VVIQ group, for each dataset. Note the unusually low alexithymia rate among Monzel et al.’s typical imagers (2.3%) relative to the other four studies (13.7-22%), referenced in Multilevel robustness below.
Figure 1 presents sample sizes, VVIQ group distributions and alexithymia proportions based on the TAS-20 “clinical threshold” (TAS-20 ≥ 61) in each of the five combined datasets and in the complete sample. The final sample (N = 1478) comprised 147 aphantasics (102 females, 5 other genders, Mean age = 40.27, SD = 12.9, range: 19-86, Mean VVIQ = 16, SD = 0), 141 hypophantasics (87 females, 1 other gender, Mean age = 36.4, SD = 12.21, range: 17-64, Mean VVIQ = 24.33, SD = 4.61), 1115 typical imagers (675 females, 4 other genders, Mean age = 36.34, SD = 14.47, range: 10-82, Mean VVIQ = 55.33, SD = 10.05) and 75 hyperphantasics (48 females, 1 other gender, Mean age = 40.48, SD = 14.95, range: 16-83, Mean VVIQ = 77.31, SD = 1.9).
The categorical picture: from two groups to four
Unless otherwise stated, the analyses reported below concern total TAS-20 scores, summed across all three subscales; we return to the subscales separately in a dedicated subsection at the end of the Results section.
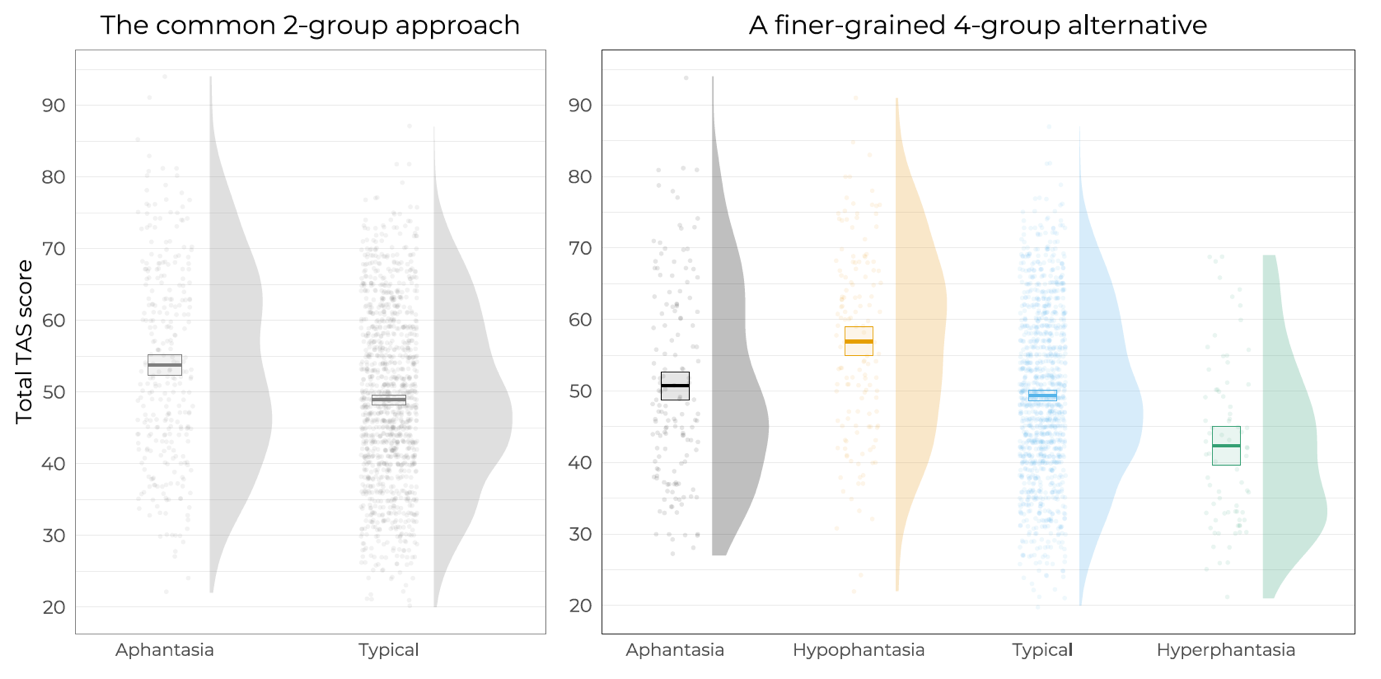
Figure 2 – Total TAS-20 scores under the field’s common 2-group split (left panel; aphantasia, VVIQ ≤ 32, vs. typical) and under the finer-grained 4-group classification used throughout this study (right panel; aphantasia, hypophantasia, typical, hyperphantasia). Each point is one participant; boxes mark the group mean and its 95% confidence interval. The 2-group split shows two largely overlapping distributions, while the 4-group split reveals that this apparent similarity masks opposite-direction differences in the two sub-groups it merges: hypophantasics scoring above, and hyperphantasics below, the remaining groups.
Much of the aphantasia literature relies on a single VVIQ threshold (typically VVIQ ≤ 32) to define a binary aphantasia-versus-typical split. We first checked whether this common approach was adequate for our data before considering any more elaborate model. Figure 2 contrasts this 2-group split against the finer-grained, four-group classification proposed by Reeder et al. (2024), distinguishing complete aphantasia (VVIQ = 16) from hypophantasia (VVIQ 17-32) and typical imagery (VVIQ 33-74) from hyperphantasia (VVIQ 75-80).
The 2-group split does find a real difference between the aphantasia and typical groups (∆ = -4.84, 95% CI = [-6.36, -3.32], d = 0.39, pd = 100%, 0% in ROPE; see EOR: Superseded models, §The 2-group categorical model), but a comparatively small one. The 4-group split tells a more differentiated story: hypophantasics and hyperphantasics move in opposite directions relative to the other groups. Hypophantasics scored higher than every other group (∆ hypo-aph = 6.22, 95% CI = [3.40, 8.99], d = 0.50; ∆ hypo-typical = 7.59, 95% CI = [5.45, 9.63], d = 0.61; both pd = 100%, 0% in ROPE), while hyperphantasics scored lower than every other group (∆ hyper-aph = -8.32, 95% CI = [-11.64, -4.97], d = 0.67; ∆ hyper-typical = -6.97, 95% CI = [-9.80, -4.22], d = 0.56; both pd = 100%, 0% in ROPE), with a gap of nearly 15 points between the two (∆ hyper-hypo = -14.56, 95% CI = [-17.98, -11.22], d = 1.17). By contrast, there was no relevant difference between the scores of the complete aphantasia group and the typical imagery group (∆ typ-aph = -1.33, 95% CI = [-3.47, 0.77], d = 0.11, pd = 61%, 46% in ROPE).
Collapsing complete aphantasics and hypophantasics into a single “aphantasia” group, as the 2-group approach does, therefore obscures a real, sizeable and clearly relevant difference between them. This difference is larger in magnitude than the 2-group split’s own aphantasia-typical contrast reported above (6.22 vs. 4.84). The full contrast table and posterior distributions figure for this 4-group model are reported on EOR: Superseded models, §The original 4-group model; this categorical model is not the analytical approach this paper ultimately builds on (see Model comparison below), but the structure it reveals here is the reason we did not stop at the field’s common 2-group threshold.
Model comparison
The categorical picture above establishes that a finer split reveals real structure a coarser one hides, but it does not on its own tell us whether a categorical approach is the right tool at all. VVIQ is treated as a continuous measure1, and there is no a priori reason to expect its relationship with TAS-20 to respect the boundaries of any particular grouping scheme, four-group or otherwise. We therefore compared six models spanning the full space described in the Data analysis section above: the 2-group and 4-group categorical models already reported, a naive linear model, a GAM, a segmented model with a freely estimated knot, and a “floor-group” model, which allows a group-specific mean shift for par-ticipants at the very floor of the VVIQ scale (complete aphantasics), on top of an otherwise linear relationship with VVIQ (see Data analysis above for the full specification). Table 2 reports the full leave-one-out comparison across all six.
Table 2 – Leave-one-out comparison of all six models, ranked by predictive performance. elpd _diff is relative to the best-fitting model (segmented); differences much larger than SE indicate reliably dis-tinguishable models. No high Pareto-k diagnostics were found for any model.
Model | elpd_diff | SE | Pareto-k |
|---|---|---|---|
Segmented | 0.00 | 0.00 | 0 |
Floor-group | -1.85 | 1.84 | 0 |
GAM | -4.53 | 3.41 | 0 |
Linear | -22.28 | 7.67 | 0 |
4-group cat. | -29.66 | 7.64 | 0 |
2-group cat. | -48.37 | 10.07 | 0 |
The categorical models were decisively outperformed by every continuous alternative, confirming that treating VVIQ as continuous captures more of the relationship than any grouping scheme we tested, including the 4-group split. The naive linear model was itself decisively worse than every non-linear alternative, closer in magnitude to the categorical models’ gap than to the top-performing cluster, consistent with the floor described below being a genuine structural discontinuity rather than something a constant slope can approximate. The segmented and floor-group models cluster tightly together at the top, well within one standard error of one another and therefore statistically indistinguishable on predictive grounds alone; the GAM’s own uncertainty is wide enough that it, too, cannot be clearly separated from this top cluster, though Figure 3 shows it diverging visibly from the other two near the floor of the VVIQ scale.
We select two of these top-performing models for detailed reporting below, on grounds beyond raw predictive accuracy alone: the floor-group model, for its parsimony and mechanistic interpretability, since it expresses a specific, falsifiable claim about a mean shift confined to zero-variance participants rather than a freely-estimated break-point anywhere on the continuum; and the segmented model (see Corroboration from the seg-mented model), for its independent confirmation of the same pattern using a different mechanism, and for its direct bearing on a fixed threshold proposed elsewhere in the literature.
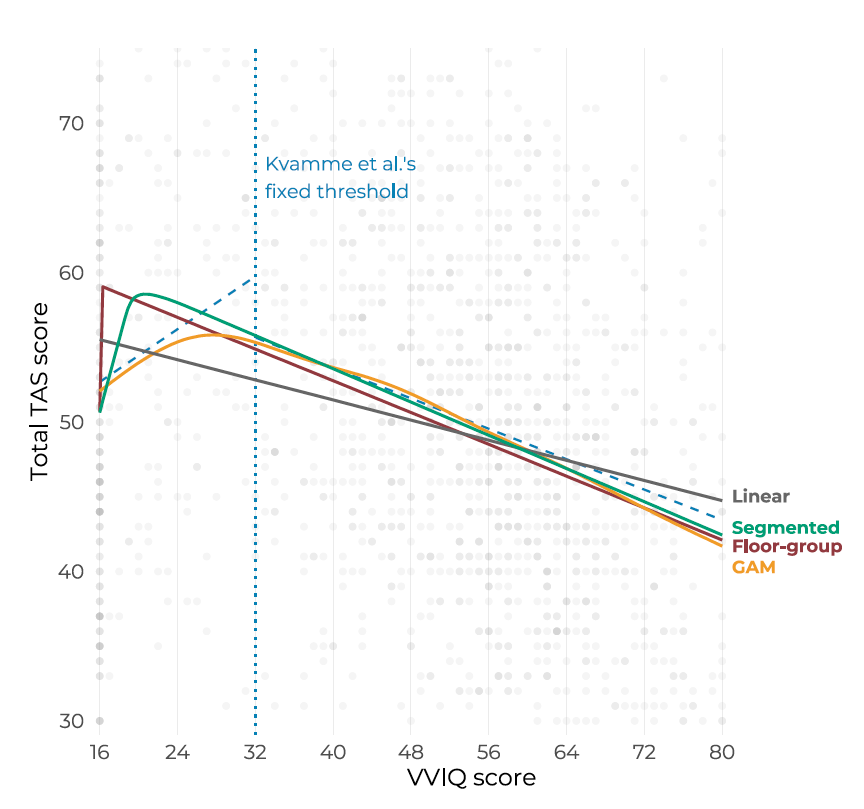
Figure 3 – Fitted curves for the linear, GAM, segmented, and floor-group models overlaid on the raw data (total TAS-20 score by VVIQ), with Kvamme et al.’s (2026) fixed VVIQ = 32 thresh-old and two separate regressions shown as blue dashed lines for reference. The segmented and floor-group models track each other closely across almost the entire range; the GAM follows a similar shape but diverges near the floor; the linear model, lacking any mechanism for a discontinuity, misses the initial rise entirely.
The floor-group model
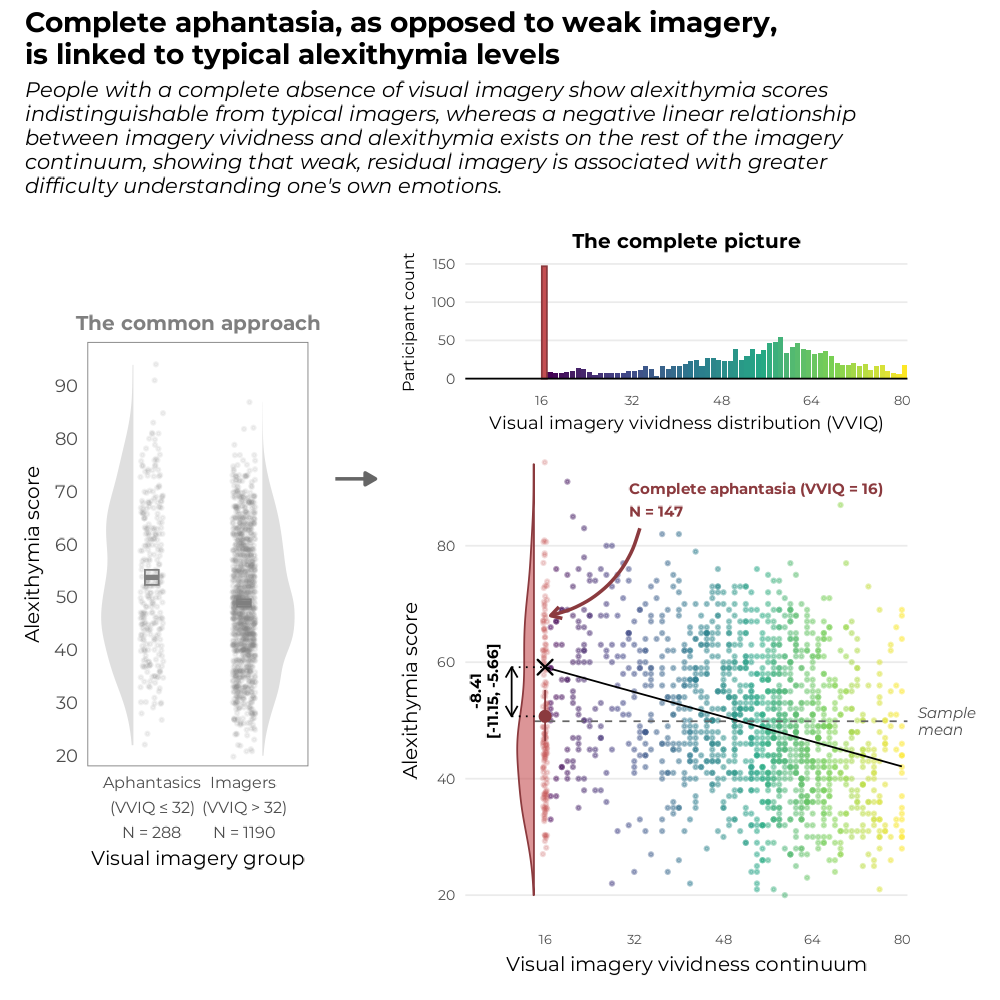
Among the top-performing models identified above, we selected the floor-group model for detailed reporting on the grounds described in Model comparison. Its formula is deliberately asymmetric: complete aphantasics (VVIQ = 16) have no variance in VVIQ among themselves, so there is no data from which to estimate a VVIQ-TAS slope specific to that group. What the data can support instead is a single, well-identified quantity: how far this group’s mean TAS score sits from where the linear relationship fitted on everyone else would have predicted it. Figure 4 visualises both pieces directly: the top panel shows that the VVIQ distribution itself is not smoothly continuous, with a sharp, isolated spike at the scale’s floor distinct from the more continuous distribution above it, which is what motivates a group-specific mean shift rather than a smooth curve in the first place; the bottom panel shows the model’s fitted relationship and the resulting gap between the floor group’s actual and predicted mean.
The floor group’s mean sits 8.41 points below where the above-floor relationship would predict it (95% CI = [-11.15, -5.66], pd = 100%, 0% in ROPE), showing a large and clearly relevant effect. The above-floor relationship itself is a genuinely relevant decline: for participants capable of some degree of visual imagery, higher VVIQ scores predict lower TAS-20 scores (slope = -0.27, 95% CI = [-0.35, -0.19], pd = 99.9%, 0% in ROPE2).
In other words, complete aphantasics do not sit at one end of a continuum that gets steadily worse as visual imagery diminishes. They break that continuum entirely: despite having no visual imagery at all, their alex-ithymia scores are no different from what the above-floor relationship would predict for someone with typical imagery, nowhere near where the linear trend would place them. Complete aphantasics’ TAS-20 mean score is at the same level as that of participants scoring around 50-52 at the VVIQ.
This pattern could, in principle, reflect something other than typical emotional functioning: if complete aphantasics found the TAS-20’s items harder to introspect on or understand, their low scores might reflect noisy or degraded responding rather than a genuine absence of alexithymia. We checked this directly, comparing internal item and sub-scale coherence within complete aphantasics against the rest of the sample; both were, if anything, marginally stronger in the floor group, showing no sign of degraded responding (see EOR: The floor-group model, in depth,§Is the floor group responding coherently?).
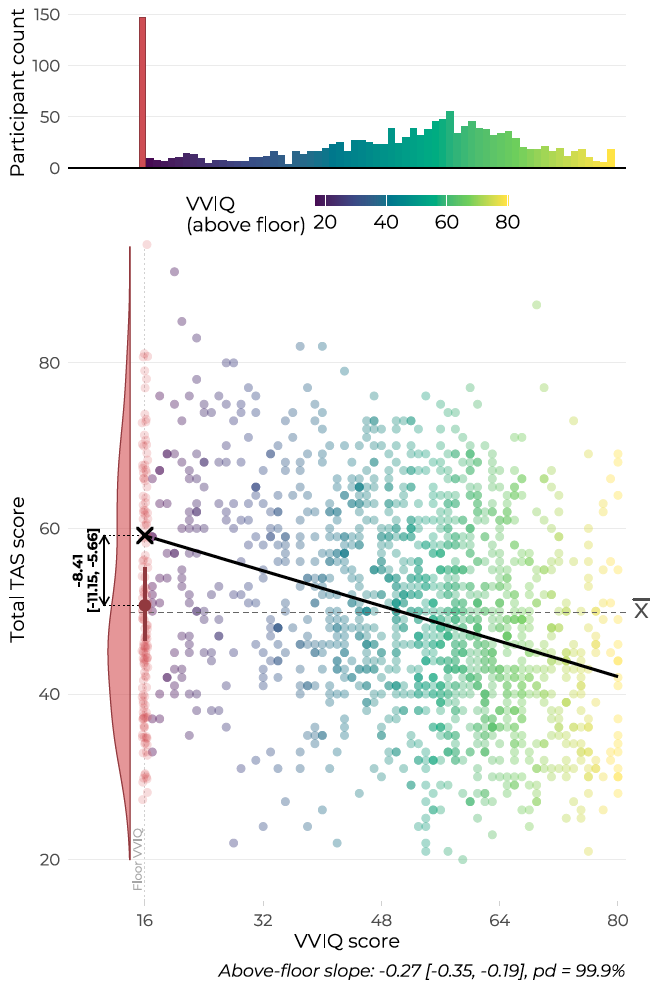
Figure 4 – The floor-group model. Top panel: distribution of VVIQ scores across the pooled sample, show-ing a sharp, isolated spike at the scale’s floor (VVIQ = 16, in red) distinct from a more continuous distribution above it. Bottom panel: total TAS-20 score against VVIQ score, with the fitted above-floor relationship (coloured by VVIQ, matching the histogram), a violin plot showing the floor group’s own TAS distribution, a cross marking where the above-floor relationship would predict the floor group’s mean to fall, and an arrow showing the gap between that prediction and the floor group’s actual mean.
Multilevel robustness
The floor-group model reported above is already multilevel: its formula includes a (vviq | study) term, letting both the slope and the intercept vary by study, rather than assuming the pooled relationship applies identically everywhere. Should this relationship hold in all studies, the result observed in the full sample would be further reinforced.
Figure 5 shows each study’s own fitted relationship separately. All five studies’ lines share essentially the same slope, and three (Ale & Burns, Ruby, and Kvamme et al.) sit almost exactly on the pooled relationship. The remaining two diverge from the pooled line in intercept only, and in opposite directions: Mas & Luminet’s line sits above it, Monzel et al.’s sits below it, by a broadly comparable margin each way.
Mas & Luminet’s offset is consistent with that study’s own composition: a young, homogeneous, course-credit sample that happened to include no complete-aphantasia participants of its own (floor-group n = 0, against 60, 20, 13, and 54 for the other four studies, see Figure 1A), meaning its own contribution to the floor-group effect is necessarily extrapolated from the pooled model rather than anchored in its own data. Monzel et al.’s offset has a more specific, checkable explanation: that study’s typical-imager sub-group shows a clinical alexithymia rate of only 2.3% (Figure 1B), roughly an order of magnitude lower than the other four studies (13.7-22%), which would depress the whole above-floor line for that study specifically without needing to invoke any genuine difference in the VVIQ-TAS relationship itself.
Despite these two intercept-level offsets, the slope of the VVIQ-TAS relationship itself is remarkably consistent across all five studies, spanning dif-ferent languages, recruitment channels, and sam-ple sizes: the floor effect and negative linear trend reported above are not artefacts of pooling data from a single dominant study, nor patterns that only emerge on average while individual studies disagree on the underlying relationship.
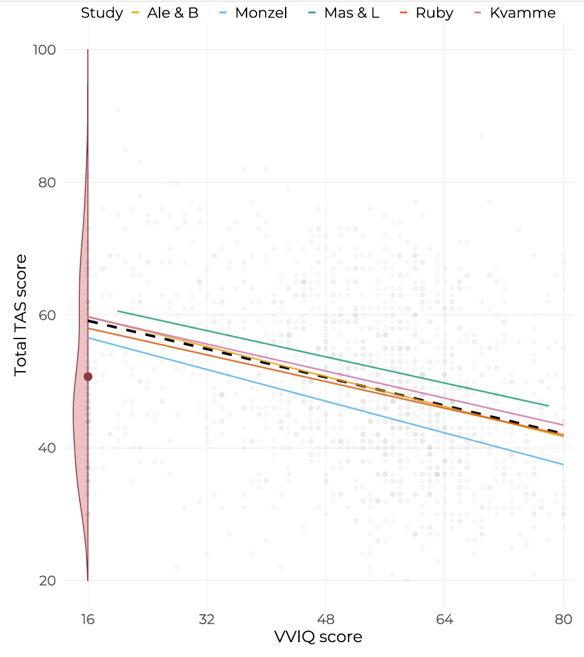
Figure 5 – Each of the five studies’ own fitted VVIQ-TAS relationship (in colour, restricted to that study’s observed VVIQ range), overlaid with the pooled, population-level relationship as a black dashed line. A muted violin at VVIQ = 16 shows the floor group’s pooled TAS distribution. All five studies share essentially the same slope; three (Ale & Burns, Ruby, Kvamme et al.) sit almost exactly on the pooled line, while Mas & Luminet and Monzel et al. diverge from it in intercept only, in opposite directions.
Corroboration from the segmented model
The segmented model reported in Model comparison above offers independent corroboration of the floor-group finding, using a different mechanism: rather than a fixed group boundary at VVIQ = 16, it estimates a single breakpoint freely from the data, seeded (but not fixed) by a fast, frequentist spline search (via the earth package, Milborrow S. Derived from mda:mars by T. Hastie and R. Tibshirani., 2018). Its own coefficients, extracted directly from the fitted model, are reported in Table 3.
Below the knot, TAS-20 rises with VVIQ (b1 = 2.55, 95% CI = [0.90, 4.76]); above it, the relationship reverses and the TAS-20 decreases with the VVIQ (b1 + b2 = -0.28, 95% CI = [-0.33, -0.23]), matching the results of the floor-group model for VVIQ > 16.
The knot itself is estimated at VVIQ = 19.91 (95% CI = [17.74, 24.09]). This estimate lets us test a specific claim from the existing literature directly, rather than assume it. Kvamme et al. (2026) analysed a large, independent sample (which forms part of the pooled data used here) by splitting it at a fixed VVIQ = 32 threshold and fitting two separate linear regressions, one on each side. Refitting their own split-sample method on their own data reproduced their published correlations closely (r = 0.186 for their aphantasia group; r = -0.236 for their non-aphantasia group), confirming this project’s version of their data matches their published results. Against this, the segmented model’s own, independently-estimated knot sits at 19.91, meaningfully below their fixed threshold, with 100% of its posterior distribution falling below VVIQ = 32 (see where the green curve bends in Figure 3 compared to the two blue dashed lines). Whereas their finding replicates the same underlying pattern reported here, the estimated knot does suggest that, empirically, the point where the VVIQ-TAS relationship changes shape may sit closer to the floor of the scale than the field’s current convention assumes.
Parameter | Estimate | 95% CrI |
|---|---|---|
Intercept (a) | 9.82 | [-25.67, 36.86] |
Pre-knot slope (b1) | 2.55 | [0.90, 4.76] |
Slope change (b2) | -2.83 | [-5.03, -1.19] |
Post-knot slope (b1+b2) | -0.28 | [-0.33, -0.23] |
Knot (k) | 19.91 | [17.74, 24.09] |
Table 3 – Coefficients of the segmented model. Pre- and post-knot slopes have opposite signs, consistent with the rise-then-decline shape in Figure 3. The post-knot slope’s estimate and interval come from the joint posterior of b1 and b2, not from summing their individual intervals.
TAS-20 subscale results
As noted at the start of the Results section, we return here to the three TAS-20 subscales set aside earlier: Difficulty identifying feelings (DIF), Difficulty describing feelings (DDF), and Externally-oriented thinking (EOT). We report the floor-group model’s results for each subscale directly below, since this is the model this article builds its conclusions on; full posterior tables are available on EOR: The floor-group model, in depth, §TAS-20 sub-scales.
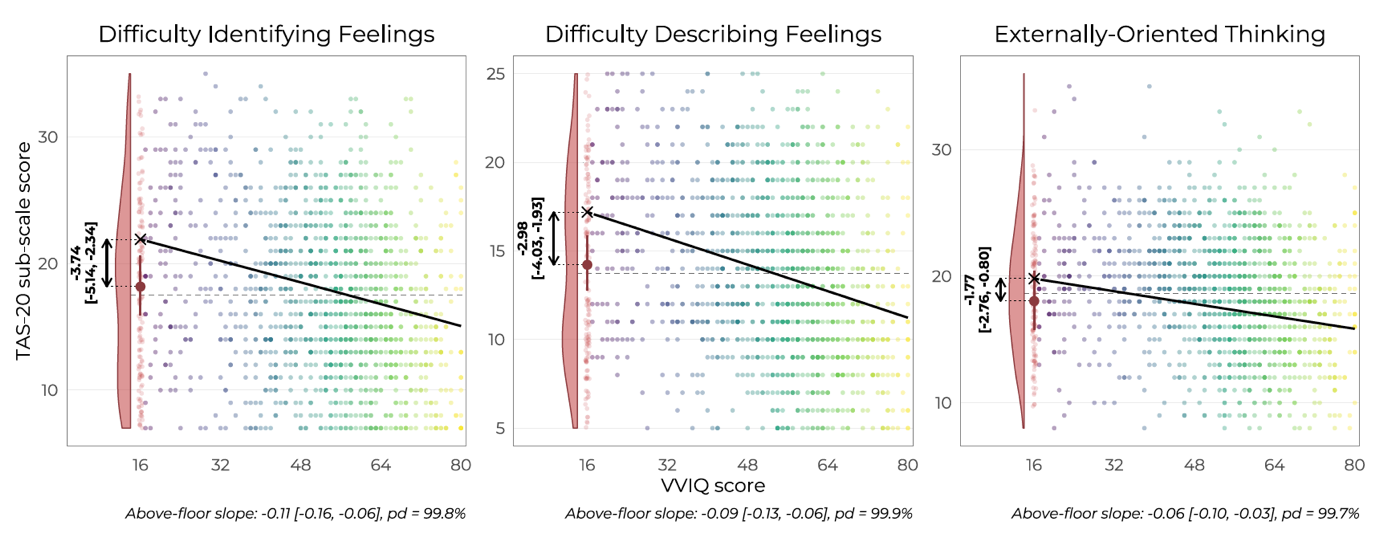
Figure 6 – The floor-group model’s results for each TAS-20 subscale: Difficulty Identifying Feelings (DIF, left), Difficulty Describing Feelings (DDF, middle), and Externally-Oriented Thinking (EOT, right). Each panel follows the same visual grammar as Figure 4: a cross marks where the above-floor relationship would predict the floor group’s mean to fall, the red point and error bar show the floor group’s actual mean and 95% CI, and the arrow shows the gap between them. The floor effect holds clearly across all three subscales, largest for DIF and smallest for EOT. The above-floor slope (reported below each panel) shows the same ordeing: relevant for DIF and DDF, and directionally consistent but comparatively weaker for EOT.
The floor effect reported above for total TAS-20 scores holds, clearly and relevantly, across all three subscales (see Figure 6): DIF (floor effect = -3.74, 95% CI = [-5.14, -2.34], pd = 100%, 0% in ROPE), DDF (-2.98, 95% CI = [-4.03, -1.93], pd = 100%, 0% in ROPE), and EOT (-1.77, 95% CI = [-2.76, -0.80], pd = 100%, 0% in ROPE). Complete aphantasics do not score above typical-imager territory on all facets of alexithymia; the pattern reported above is uniform across the whole instrument, not concentrated in one specific facet. The magnitude of the effect does follow the same ordering as the reliability differences reported in the Questionnaires section above and the slope pattern reported below, largest for DIF and smallest for EOT, though all three remain unambiguously relevant by our evidence standards.
The above-floor slopes tell a more nuanced story. DIF’s and DDF’s slopes are both clearly outside their irrelevant-effect ranges (3.7% and 0.0% of their respective posteriors in ROPE).
EOT’s slope is the one partial exception: still directionally likely (pd = 99.7%) and still mostly outside its ROPE, but with a meaningfully larger share of its posterior (25.2%) falling inside the irrelevant range than either other subscale. In other words, the continuous, above-floor relationship between imagery vividness and alexithymia is more consistently present for the difficulty-identifying and difficulty-describing facets specifically than for externally-oriented thinking, while the floor effect itself, this paper’s central finding, holds with equal force across all three.
Discussion
Thanks to its large sample size, this study gathered a particularly high number of aphantasic, hypophantasic, and hyperphantasic participants, letting us move beyond the field’s usual binary aphantasia-versus-typical split. A finer, four-group categorical picture already showed that this common approach hides real structure: hypophantasics and hyperphantasics diverge from the rest of the sample in opposite directions, a pattern a coarser split cannot see. This motivated a more thorough test of what shape the VVIQ-alexithymia relationship actually takes, rather than assuming either a simple linear trend or an arbitrary set of categories. Comparing six candidate models, from naive linear and categorical baselines to several genuinely non-linear alternatives, we found that the relationship is described most parsimoniously not by a smooth curve, but by a discontinuity: a sharp, localised break specifically where visual imagery is entirely absent, rather than a gradual change across the full range of imagery vividness. Complete aphantasics’ alexithymia scores sit apart from what the rest of the sample’s own relationship would predict for them, a pattern an independent model (estimating its own breakpoint from the data, with no group boundary assumed in advance) corroborates, and which holds up study by study rather than depending on any single dataset in the pooled sample. This discontinuity, present with equal force across all three TAS-20 subscales, is this paper’s central finding.
This study makes several contributions to the fields of research on aphantasia, visual imagery, and emotion. The discontinuity reported above has implications for the hypothesis that components of alexithymia, as measured by the TAS-20, are functionally linked to visual imagery. Above the floor of the VVIQ scale, the negative linear relationship between imagery vividness and TAS-20 scores on the whole continum (VVIQ 17-80) is consistent with the idea that alexithymia is, at least in part, associated with the capacity for visual imagery (when visual imagery is possible). This is consistent with results suggesting that the ability for visual imagery promotes the emergence of physiological emotional reactions when reading emotional scenarios (i.e., skin conductance level shift from baseline, Wicken et al., 2021). Importantly, according to our findings, complete absence of visual imagery is not associated with self-reported emotional difficulties and breaks the linear association that exists between TAS-20 and VVIQ in people capable of visual imagery. Complete aphantasics’ TAS-20 scores resemble those of typical imagers (around VVIQ = 50-52), not those the above-floor relationship would predict for someone at the lowest end of the imagery scale. Our results showing typical alexithymia scores in complete aphantasics align with a clinical study reporting that a similar proportion of aphantasics and imagers seek mental healthcare, that aphantasics show a similar prevalence of most disorders including anxiety disorders, and that they are equally likely to experience emotional intrusions as part of a mental health condition (Mawtus et al., 2024). If visual imagery fosters emotions by facilitating a connection between symbolic and experiential representations, one possible interpretation of our results is that, when visual imagery is entirely unavailable, some other processes develop to take over and enable avoiding emotional difficulties. Further studies are warranted to better understand the functional organisation explaining the TAS-20 scores of complete aphantasics. A compensatory-process account makes a testable prediction: if complete aphantasics genuinely reach typical TAS-20 scores via a qualitatively different cognitive route, this may be associated with different processing time and quality, which could be objectified in response times, and/or self-reported confidence (following the logic of, e.g., Liu & Bartolomeo, 2023) or phenomeno-logical reports. It would also be especially informative to investigate the brain activity and dynamics during emotion-inducing tasks, through visual imagery or through spoken language, as proposed by Wicken et al. (2021). So far, the few neuroimaging studies on aphantasia have focused on visual imagery, autobiographical memory, and resting state, but not on emotion (e.g., Liu et al., 2025; Milton et al., 2021; Monzel et al., 2024b).
Previous work on the relationship between mental imagery and alexithymia hypothesized that aphantasia may be characterized by a lower focus on internal life (Kvamme et al., 2024). Interestingly, previous research on aphantasia and alexithymia proposed that both constructs share an externally-oriented cognitive style, a claim based on the observation of higher EOT scores in aphantasics than in typical imagers (Monzel et al., 2024a). The floor-group model’s own subscale results (see TAS-20 subscale results above) do not support this claim, and show instead that a finer distinction within the aphantasia range is what matters: it is hypophantasics, not complete aphantasics, who score higher on EOT relative to typical imagers, and this is not specific to EOT either. Indeed, hypophantasics did show higher EOT scores than typical imagers but complete aphantasics did not, and the same pattern (elevated in hypophantasics, typical in complete aphantasics) held for DIF and DDF as well. At the other end of the scale, the hyperphantasia-typical distinction we retained throughout this study (see The categorical picture above) is itself grounded in a comparable, decisive effect (−6.97, 0% in ROPE), of similar magnitude and relevance to the hypophantasia-typical contrasts just discussed. The similarities between the levels of alexithymia in people with complete aphantasia and typical imagers suggest that the previously hypothesized reduction of internal focus in aphantasia may instead apply to hypophantasia only, and may not be specific to EOT but extend to alexithymia in general. In other words, based on current data, the cognitive style associated with weak mental imagery cannot be considered solely as a lack of focus on internal life, and should rather be considered as an increase in alexithymia in all its facets. It would be interesting for future studies to measure the extent to which the link between VVIQ and TAS-20 scores can predict indicators of emotion processing (i.e., emotional regulation difficulties or psychological symptoms). Such an approach would allow a better understanding of the nature of the association between visual imagery, alexithymia, emotional processing and regulation and the development of hypotheses on the cognitive styles associated with complete aphantasia and hypophantasia for clinical applications.
Several limitations of the present study have to be considered. The results were derived from two self-report questionnaires, which rely on subjective self-evaluation and can be influenced by various biases and varying levels of metacognitive skills among individuals (see Hurlburt & Schwitzgebel, 2011, for a discussion). Future studies should complement such questionnaires with objective measures (or attempts at objective measures) of mental imagery (e.g., Purkart et al., 2024) and emotional processing (e.g., Wicken et al., 2021). At first glance, the merging of datasets from two languages (i.e. English and French) could be seen as a possible bias, with a possibility that results could depend on the language and culture of the participants. We tested this possibility: the floor-group model’s multilevel structure lets each study’s own relationship be examined separately (see Multilevel robustness above), and the slope of the VVIQ-TAS relationship held consistently across all five studies, English- and French-speaking alike. Two specific, unresolved points from that check are worth naming. First, one of the two French-speaking studies (Mas & Luminet) included no complete-aphantasia participants of its own, so its contribution to the floor effect specifically is necessarily extrapolated from the pooled model rather than anchored in that study’s own data; this is not a limitation the multilevel check can fully close. Second, one of the three English-speaking studies (Monzel et al.) shows an unusually low rate of clinical alexithymia among its typical imagers relative to the other four studies, a discrepancy we can describe but not fully explain, and which affects that study’s own intercept without, as far as we can tell, affecting the slope the present study’s conclusions rest on. Ultimately, we considered that it was sensible to merge all the datasets, regardless of their language, based on previous work demonstrating that the psychometric properties of the two questionnaires remained stable across languages (Schroeders et al., 2022; Watters et al., 2019; Wright et al., 2024). More broadly, the five studies we gathered were conducted in Western populations (French-and English-speaking), which leaves open the question of whether their findings can be generalised to other, more diverse populations (see Henrich et al., 2010). Beyond language, both visual imagery vividness (e.g., Bruder & Zehra, 2025, who report lower VVIQ scores among Middle Eastern and North African participants relative to Western and Southeast Asian participants) and the expression of alexithymia (e.g., Dere et al., 2013) have been shown to vary across cultural contexts, so the shape of the relationship we report here should not be assumed to generalize beyond the populations sampled.
The results of the present study also carry a methodological lesson for research on aphantasia more broadly: no single analytical strategy, chosen in advance, would have found this pattern. A model built only around categorical groups would have revealed real structure the field’s common 2-group approach misses, but not the specific shape of the discontinuity itself. A smooth non-linear model alone, such as a GAM, captures the general rise-then-decline shape but is not the best-supported description of what is happening at the floor of the scale specifically, and performed measurably worse than models built with a discontinuity in mind. What let us find and corroborate this pattern was comparing a genuine range of candidate models against each other, including linear, categorical, and several different non-linear shapes, rather than committing to one family from the outset. We encourage other researchers working with the VVIQ, or with other continuous psychological measures with a plausible extreme-value phenomenon, to build a comparable model space before committing to any one shape, linear, categorical, or otherwise. In the case of visual imagery, two extreme groups with no VVIQ variance may stand out from the distribution – complete aphantasics (VVIQ = 16) and complete hyperphantasics (VVIQ = 80), as confirmed by recent prevalence studies (Wright et al., 2024) – and create possible discontinuities. In this study, we could demonstrate that one end of the continuum (VVIQ=16) diverged from the rest. Other studies with large complete hyperphantasic groups could investigate the other end of the continuum (the pooled sample only had 17 people with VVIQ = 80). In the end, apart from the complete aphantasia group, the relationship between the TAS-20 and the VVIQ is a simple linear relationship in the range 17-80 and no other cut-off score appear relevant.
Acknowledgements
We would like to thank the researchers that shared their data and made this work possible. Preprint version 4 of this article has been peer-reviewed and recommended by Peer Community In Psychology (https://doi.org/10.24072/pci.psych.100336; Stussi, 2026). We are grateful to Yoann Stussi, Reshanne Reeder and two anonymous reviewers at PCI Psychology, whose comments prompted a substantially expanded model-comparison approach and led us to the floor-group model that is now this paper’s central finding. This is a genuine instance of peer review shaping the science, not just its presentation. The reasoning behind this development is documented in full in our Extended Online Report (see EOR: The model comparison arc).
Data, scripts, code, and supplementary information availability
All the data and code required to reproduce the analyses presented in this article are openly available on the Open Science Framework (OSF; https://doi.org/10.17605/OSF.IO/B837S, Delem, 2026b), including the pooled dataset and each individual dataset separately (see Datasets used above for details). The code is additionally available as an R package on GitHub, and archived with a permanent, versioned snapshot and DOI as a registry on OSF (https://doi.org/10. 17605/OSF.IO/WCAVX, Delem, 2026a). Beyond bare reproducibility, the package’s own documentation website constitutes this study’s Extended Online Report (EOR): an interlinked, executable companion to this manuscript covering the full model-comparison process, per-model diagnostics, and material from earlier stages of this study retained for transparency even where later analyses have superseded it. See the EOR home page, or the citations of the form “EOR: Page name, §Section” throughout this manuscript for pointers to the specific material referenced at each point.
CRediT authorship contribution statement
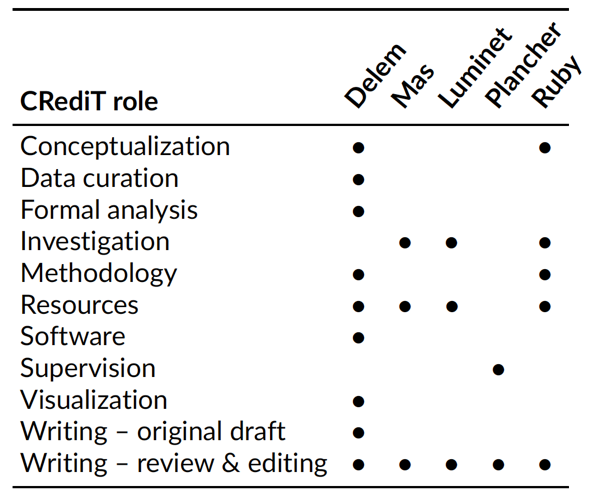
CRediT (Contributor Roles Taxonomy): credit.niso.org.
Funding
The authors declare that they have received no specific funding for this study.
Conflict of interest disclosure
The authors declare that they comply with the PCI rule of having no financial conflicts of interest in relation to the content of the article, and have no non-financial conflicts of interest.
- ↩︎
Strictly speaking, the VVIQ and TAS-20 are bounded sum scores rather than continuous measures in the mathematical sense. We treat them as continuous because both scales span enough discrete steps (65 and 81 possible values, respectively) that an ordinal treatment offers little practical advantage over a continuous approximation; see EOR: Model diagnostics, §Why gaussian()
- ↩︎
The slope uses a different ROPE convention than the floor-group contrast, as described in Data analysis above.