

 CC-BY 4.0
Introduction
A wealth of pangenome models
The aim of the pangenomics is to model the genomic diversity of a population of interest. Whereas genomics studies use a unique genome as a reference, pangenomics take sets of genomes, usually from the same species, and model this diversity. The sampling intends to represent the genetic diversity under study. The notion of “pangenome” covers many models, and that it is often impossible to guess what a paper with this word in its title actually entails (Edwards, 2026). Luckily, these different models have been presented in different reviews (Eizenga et al., 2020; Golicz et al., 2020; Guerra, 2026; Hu et al., 2024; Matthews et al., 2024; Ruperao et al., 2025; Schreiber et al., 2024; Secomandi et al., 2025; Taylor et al., 2024). The term “pangenome” was first coined for prokaryotes (Tettelin et al., 2005), and they included the variations of genes, but they have been extended to eukaryotes since. Several pangenomes were also model using a genome of reference, together with an exhaustive catalog of variations: single nucleotide polymorphisms (SNPs), insertions/deletions (indels), or structural variants (SVs). SVs are usually, and arbitrarily, defined as indels of size longer than 50bp (The 1000 Genomes Project Consortium, 2010), or balanced rearrangements, which include inversions and translocations. Otherwise, the pangenome can be a collection of sequence variations, together with a reference genome.
With the advent of affordable, long, high quality sequencing technologies, such as ONT (Jain et al., 2018) and PacBio HiFi (Wenger et al., 2019) reads, it is now possible to produce accurate and telomere-to-telomere genome assemblies for a reasonable cost, and to collect several complete genomes for a given taxonomic group. These different genomes can be encoded into a graph, and at least two different types of graph are available: de Bruijn graphs and variations graphs. Both store sequences as nodes in the graph, and each genome is present in this graph, removing the principle of a reference genome. In the former, nodes are k-mers, edges are k − 1 overlaps, and colors indicate whether a given node belongs to a given haplotype. The latter use nodes of variable sizes, and model genomes as paths in the graph. These graphs have been discussed and compared in several reviews (Eizenga et al., 2020; Hu et al., 2024; Matthews et al., 2024; Ruperao et al., 2025). As observed by Andreace et al. (2023), de Bruijn graph scale much better, both in time and memory. However, usual operations, such as retrieving a genome from a de Bruijn-based pangenome graph, is in principle not possible. So far, variation graphs have been more widely adopted, as seen in recent literature.
Breakthroughs using variation graphs
Advantages of variation graphs have been underlined in several publications. For instance, when reads are mapped only to a reference, Sirén et al. (2021) observed that the fraction of reads supporting the reference allele was consistently greater than the fraction of reads supporting the alternative allele in human heterozygous loci (less than 30% for indels of size greater than 40bp). This bias is corrected (albeit not entirely for very large indels) using a pangenome graph. The rationale is that, most of the time, the alternative allele is present in the graph: the reads can thus be mapped without error, which simplifies the process. This finding has direct implications, for example in SNP calling, genotyping, and genome-wide association studies (GWAS). For instance, the F1 value of the genotype call increases from 0.9940 to 0.9953 when using graph (Sirén et al., 2021).
Other publications showed the advantage of including long SVs, an information that is only accessible using genome assemblies. Milia et al. (2024) used a bovine pangenome graph in order to understand the cause of a white head depigmentation, known to follow a genetic dominant pattern. They found a segmental duplication upstream of a gene of interest, affecting its expression. Of note, since the duplication was composed of transposable elements and other repeats, it was not detected using short reads. Interestingly, this duplication harbored several variants, and insertions inside this duplication were also observed. In cotton, Yang et al. (2026) exhibited five large inversions, and one translocation, that appeared during, or before, domestication. In tomato, Zhou et al. (2022) looked for the quantitative trait locus (QTL) responsible for the expression of a gene of interest (eQTL). A SNP-only analysis points to a locus several genes away, whereas the likely causal variant is a SV which is located inside the gene, with a much stronger signal. The same analysis showed that adding indels and SVs, compared to a SNP-only model, increased the heritability from 0.28 to 0.33. Even more interestingly, when these variants were modeled in the graph and not on the reference genome, the heritability increased from 0.33 to 0.41.
SVs also sometimes complements results found for SNPs. In cucumber, Zhao et al. (2026) found that the mutation load of mildly deleterious SNPs increased during domestication. This result is expected, and confirms the cost of domestication hypothesis. However, SVs significantly decreased in the process. This would suggest that, contrary to the previous observation, SV were purged by purifying selection.
Aim of this work
The interest on pangenomics is thus growing, particularly in the biodiversity-driven fields such as agroecology (Adam et al., 2025). Several papers now use and publish pangenome graphs, and many reviews already listed several aspects of the field. Some provide an introduction of the concepts (Matthews et al., 2024). Others address the process of constructing a pangenome graph (Andreace et al., 2023; Eizenga et al., 2020), whereas other focus on technical aspects, such as mapping reads to a graph (Cui et al., 2025). Other works list the results obtained on several organisms, such as plants (Danilevicz et al., 2020; Hu et al., 2024; Wang et al., 2023; Zanini et al., 2021), animals (Gong et al., 2023), but also biodiversity genomic studies (Secomandi et al., 2025). A common conclusion is that, while pangenome graphs can be created, even in complex cases (many genomes, containing many repetitions, or being polyploid), tools exploiting them are still lacking. This is the paradox of a radical change in the pangenome model: switching from a reference genome to a graph requires all the downstream analysis tools to be re-engineered from scratch. For instance, GWAS analyses are done on a reference genome, and do not take the advantage of known variability. Bluntly speaking, whereas it is now fashionable to create pangenome graphs, it is still not clear how or why they could be useful for agronomy. Before the interest in the topic is lost, it is thus urgent to transfer tools developed for reference genomes to graphs, and to invent new methods in order to exploit the full potential of pangenome graphs. Although we are aware that transitioning from genomes to graphs poses serious computational challenges (Limasset et al., 2016), we are confident that they will be resolved soon.
The aim of this opinion paper is to list the bottlenecks that pangenome users experience once they have built their graphs. We will thus not mention the principles and difficulties of genome assembly, or graph construction. We will suppose that near telomere-to-telomere assemblies are available and used, which can be haplotype-resolved or collapsed pseudo-chromosomes. Moreover, we will focus here on multi-cellular eukaryotic species of agronomic and ecological interest, which are larger than most prokaryotes, but may also be quite different to human genomes: they can be much larger (wheat is about 15Gbp long), contain many repeated DNA, be polyploid (some sturgeons are tetraploid), and/or harbor a much higher diversity (heterozygosity is k-mer estimated to 1.9% in some oak species, genome size can vary up to 20% in maize). More precisely, we would like to mention here all the tools that should be developed in order to exploit these graphs. They include methods that should be adapted from so-called “linear genomes,” but also new tools, that are specifically conceived for graphs. Indeed, some questions can only be addressed using graphs: for instance, complex, nested SVs are poorly represented by a reference genome and a set of variations.
A similar review has not been addressed since 2018 in The Computational Pan-Genomics Consortium, 2018, but the landscape of pangenomics has radically changed since then. We hope here to rouse the interest of computer scientists, statisticians, data scientists, etc. so that these open questions will be solved soon. We think that these developments will be necessary to transition from genomics to pangenomics, and collect results that were previously out of reach. Whereas this study focuses on pangenome graph, we do not want to mean that every genomic study should be performed on this data structure. Diversity analysis, association studies using SNPs and a reference genome have several advantages: they are faster, cheaper, and can be directly compared to the results accumulated so far, since they use the same methodologies.
The aim of our work is to mention all the analyses that cannot be performed, when one wants to use pangenome graphs.
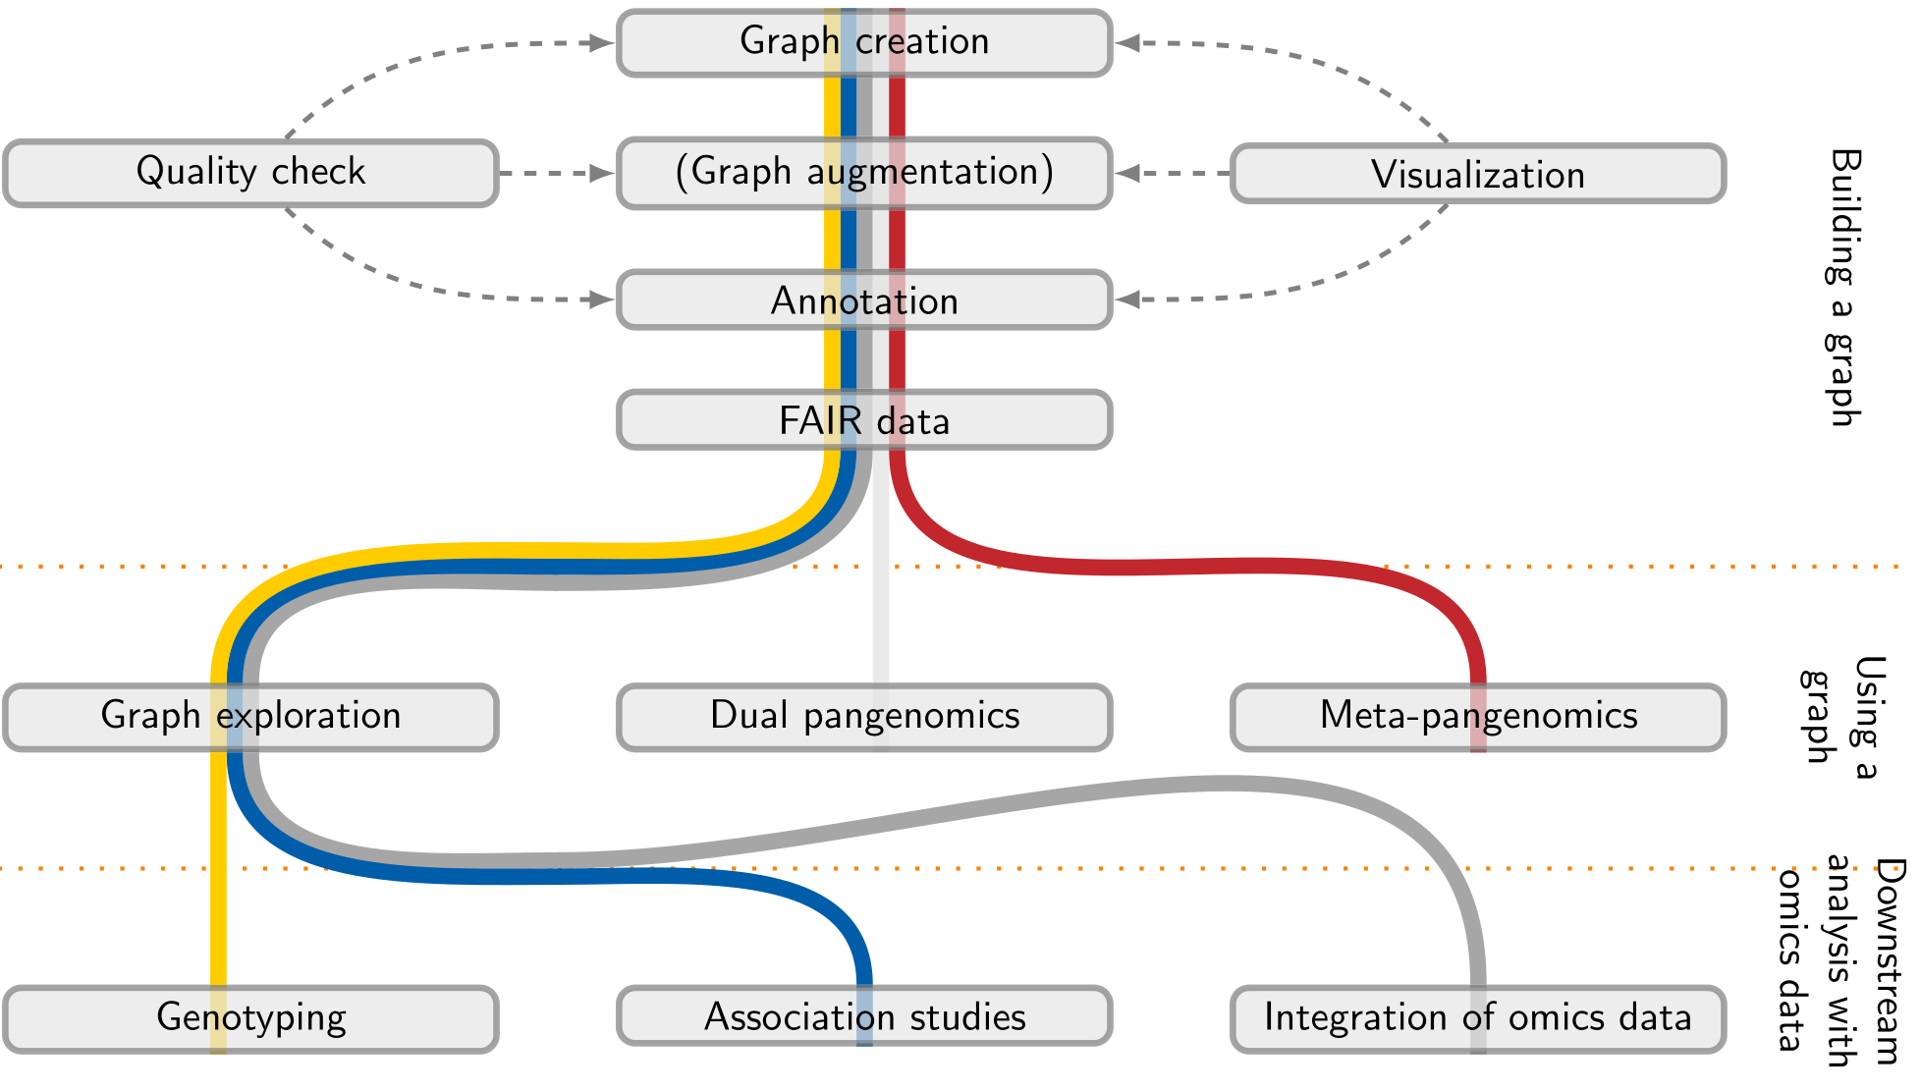
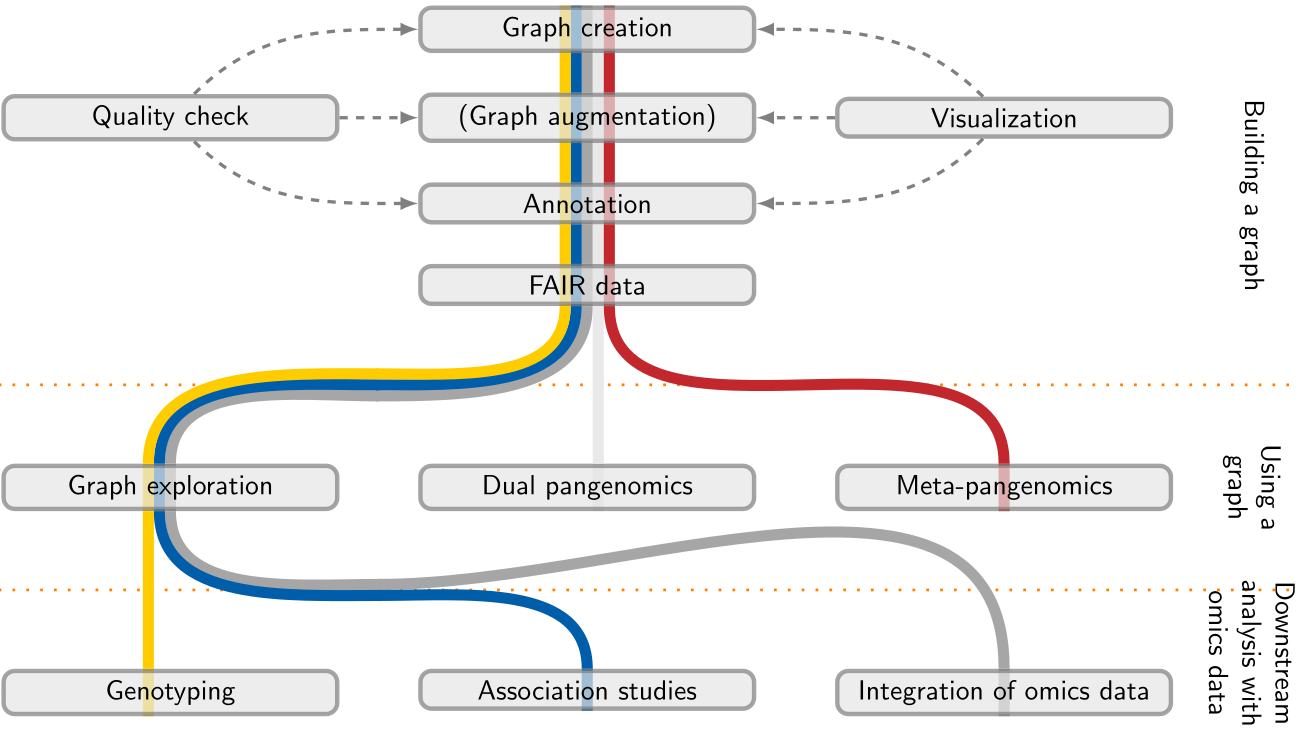
Figure 1 – A possible pipeline for the uses of a pangenome graph. This pipeline can be roughly divided into three main sections (on the right): build a graph, using it, and adding reads. A first pangenome graph is created, usually with almost complete haplotype assemblies. Since graph creating methods vary, and may be fraught with errors (unaligned regions, broken paths), assessing the quality of a graph is useful (this can be applied after each subsequent step). Similarly, it is also crucial to be able to visualize the graph, especially on particular loci of interest (can also be done throughout the pipeline). The graph can be augmented with additional data increasing allele counts, including known contig alignment or read mapping. Several augmentation iterations, with different types of data, can be considered. Since most analyses focus on genes and transposable elements, it is usually useful to add an annotation (available on one or several reference genomes), which projected to the graph. This graph, possibly extended with new variants and annotation, should be then shared with the community, following FAIR practices. Most analyses then focus on graphs with only one species, and the graph can be analyzed in order to find regions of interest. However, dual pangenomics, which studies the joint diversities of two species, can be envisioned. More generally, many species can also be modeled, for instance in the case of meta-genomics. Low coverage sequencing data of individuals can be compared or aligned to the graph in order to produce large genotyping sets enabling population genetics studies (i.e. coalescence, association). Other omics (e.g. RNA-Seq, ChIP-Seq, Hi-C, LC-MS, BS-Seq etc.) data can be added to the graph, and potentially aggregated to multi-omic layers.
Outline
In this work, we will address several practical questions that are commonly considered by pangenome graph users (Figure 1). Current analyses suggest using genome assemblies close to telomere-to-telomere completeness, preferably using haplotypes (representing each chromosome separately) for building pangenome graphs (Cheng et al., 2025; Leonard et al., 2022; Li et al., 2024). Tools like Minigraph (Li et al., 2020), Minigraph-Cactus (Hickey et al., 2023), or PGGB (Garrison et al., 2024) create variation graphs, and de Bruijn graphs can be created by Bifrost (Holley & Melsted, 2020), for instance. Both types are pangenomes graphs. Pros and cons of each method have been described by Andreace et al. (2023). Among others, de Bruijn are much more compact, whereas it is easier to retrieve haplotypes using variation graphs.
In a pangenome graph, a node represents a sequence, and paths (in a variation graphs) or colors (in de Bruijn) represent haplotypes. In a variation graph, there is an edge between two nodes if the corresponding sequences are contiguous for at least one haplotype.
The rest of the manuscript presents several graph use cases. First, the quality of the graph should be assessed, yet no metrics have been defined to do so (Sections “Pangenome representativeness” and “Graph quality assessment”). Visualization should also be possible, although the sheer number of nodes in the graph requires innovative solutions, which are not found yet (Section “Graph visualization”). Optionally, the graph can be augmented with new variations, which are found in individuals unsampled for the graph construction step (Section “Graph augmentation”). Since many analyses will study the impact of variations on genes, it is essential to add annotations (coding, non-coding genes, or transposable elements) to the graph (Section “Graph annotation”). At this point, the graph, together with possible augmentation and annotation, can be shared by communities using the “findability, accessibility, interoperability, and reusability” (FAIR) principles (Section “Producing FAIR pangenomes”). The graph can then be analyzed and explored, in order to explore a locus of interest (Section “Manipulating and exploring data from graphs”). Alternatively, it is also possible to look for patterns inside the graph, which could be linked with population genetics, or coalescence (Section “Population genetics and coalescent theory”). The type of analysis will differ, depending on whether one or several species are included. Indeed, when two species are present, such as a host and a pathogen, one may want to analyze their relative evolutions (Section “Dual pangenomes”). This idea can be extended to several species, in the case of meta-pangenomics (Section “Pangenome graphs for metagenomics and organelle-based studies”). New genomic data, such as short or long reads can then be aligned to a graph. They can be used for genotyping individuals, or a population (Section “Variant anal-ysis and genotyping”). If contrasted populations are studied, a Genome Wide Association Study (GWAS) can be conducted (Section “Association studies”). Finally, other omics data —informing on transcription, translation, or epigenetics— can be added to the graph, in order to find links between genotype and regulation (Section “Towards multi-omics pangenomics”).
Questions
Building a graph
Pangenome representativeness. Conceptually, a pangenome is a theoretical object aiming to capture the full extent of genetic diversity within a given population, species, or species complex (hereafter referred to as the “metapopulation”). In practice, however, this goal is unattainable as any inferred pangenome graph represents only a partial and imperfect view of the metapopulation variation. Actually, no sampling design can ever be exhaustive as alleles are detected with a probability equal to their frequency in the metapopulation (i.e. given a sample size N of diploid individuals, we expect to find alleles with a frequency of 1/2N on average). Thus, any sampling scheme must be tailored to the question at stake. For instance, detecting low frequency variants responsible for diseases in livestock species requires a much greater effort than detecting locally high-frequency adaptive variants in tree species. More importantly, the sampling design must account for the genetic structure of the metapopulation in order to capture alleles that are private to certain populations—as observed by the sudden rise of diversity in “pangenome growth” plots when a new population is first represented (Figure 3 in Liao et al. (2023)).
As mentioned in Secomandi et al. (2025), a good practice is thus to sample the population based on results obtained with chip or low-pass sequencing and tools like CoreHunter (De Beukelaer & Davenport, 2016) or SVCollector (Ranallo-Benavidez et al., 2021) in order to constitute a good diversity panel. Yet, these methods usually rely on known variations, or SNPs, which fail to account for structural variants which add crucial information on the population diversity. Since SVs are mostly found using pangenomic data, this looks like a chicken-and-egg problem. However, a sufficient number of SNPs should be enough to get a reliable genetic structure of the population, and k-mer based approaches, akin to Mash distance (Ondov et al., 2016), which consider all types of variations, can be used to this end.
To summarize, it would be ideal to have a standard way to sample a population, in order to guide the user when choosing his/her panel. This procedure could include the introduction of trios, which are interesting quality controls: SV in the offspring should, in principle, also be found in the parents.
Graph quality assessment. Building a pangenome is a very complex task, especially when genomes are large, and many individuals are included. The aim of a pangenome builder is to group, in the same node, orthologous sequences. This task is particularly challenging in low-complexity or highly repetitive regions, especially where recurrent mutations can blur the true evolutionary signal. As a results, current methods rely on heuristics, and arbitrary choices, which can fail to detect sequence orthology.
Since some of the variants present in pangenome graphs may not reflect genuine genomic differences, but rather artefacts introduced by the tools and methods used, strategies to evaluate graph quality are highly needed.
The genome assembly community developed several widely used metrics. Indeed, technical limitations make it difficult to assemble telomere-to-telomere genomes, especially in low-complexity or highly repetitive regions of the genome (e.g. transposable element- or microsatellite-rich intervals, telomeres, centromeres), even with state-of-the-art assemblers like hifiasm (Cheng et al., 2021). BUSCO scores (Manni et al., 2021), N50 (Earl et al., 2011) or LAI (Ou et al., 2018), have been used to assess completeness of assembled genomes, whereas tools like KAT (Mapleson et al., 2016) or Merqury (Rhie et al., 2020) check whether the k-mers found in the reads are also present in the assembly. Recent guidelines have been published for gene-centric graphs (Heuermann et al., 2025), and it would be convenient to have metrics for graphs. So far, tools such as vg stats (Garrison et al., 2018) or odgi stats (Guarracino et al., 2022) produce a series of metrics describing the graph: number of nodes, size of the paths, number of edges per node, etc. However, it is still unclear what range of values would qualify a graph as “good.” Pangenome growth analyses performed by tools such as panacus (Parmigiani et al., 2024) are useful for assessing whether a given sample size is sufficient to adequately represent a population: a plateau indicates a saturation of the sampling strategy. Kopalli et al. (2025) set up a benchmark, comparing major pangenome builders. Produced graphs are compared in terms of size, or variants called. They also simulated reads from these graphs, and compared the number of reads that mapped the graph. This metrics is practical and effective, yet it is not easy to determine whether the graph produced is better, or whether the mapping algorithm is particularly suited to a type graph topology. We are thus in need to get reliable indicators, which would include an assessment whether the graph faithfully represents the individual genomes (the recent PG-SCUnK (Cumer et al., 2026) may fill this need), and an assessment of its usability, which could include the compactness, or, on the contrary, the lack of loop.
In the absence of standard metrics, pangenome graphs can still be compared among themselves. Graph comparison is an old topic, and many methods can be devised, with the caveat that, in principle, the comparison involves graphs built with identical sequences. Methods based on ED-strings (Gabory et al., 2024) and pancat (Dubois et al., 2025), the latter being developed by authors of this work, can localize and quantify where and how the differences arise in graphs. These methods can be used to evaluate the impact of graph builder parameters. Interestingly, they can also be used to compare graphs produced with a “ground truth,” which could be con-structed manually —for small datasets only— or simulated. This requires realistic whole genome population simulators, using controlled phylogenies, such as MSpangenome (Piat et al., 2026), also developed by authors of this work.
Representing variations also is a complex task. Genomic variants differentiating haplotypes are classically detected by looking for topological motifs in the graph, referred as bubbles, or snarls. They are formed when at least two genome paths diverge in the graph due to sequence differences, and meet again further on. Several tools detect such motifs, such as vg snarls and vg deconstruct (Garrison et al., 2018; Paten et al., 2018) for Minigraph-Cactus and PGGB graphs, gfatools bubbles (Li et al., 2020) for Minigraph graphs, and BubbleGun (Dabbaghie et al., 2022). Complex variations can be nested, or simply co-localized, and sometimes do not fit in the bubble or snarl definitions. Once a variation has been found, it is then common to express it as a variation with respect to a reference genome (as a VCF file). Here again, there is no standard way to do so. As a result, some variations can be ignored, or mis-represented.
Moreover, there can be several ways to represent a genomic variation, and this problem has also been documented in multiple sequence alignment methods. Consider for instance a reference genome AAA, and an alternative genome AA. As is, it is impossible to guess which A has been deleted. Arbitrary decisions need to be made (e.g. left-normalisation), although they are not guaranteed to be evolutionary accurate, thus creating a bias for future applications (Figure 2A–C). Thus, different graph topologies do not necessarily imply different variants. Repetitions (which include sequences that occur in multiple copies throughout the genome in cis or in trans, but also copy-number variations) can either be modeled through independent sequences, or loops (Extended Figure 3 in Liao et al. (2023)). Similarly, inversions can be represented as two parallel sequences of reverse-complemented nodes rather than a bidirected node traversal (Figure 2D–E and Figure 1 in Romain et al. (2025)). As a result, graph builders may adopt different conventions, and graphs may be incomparable —although essentially equivalent— and downstream analyses will differ.
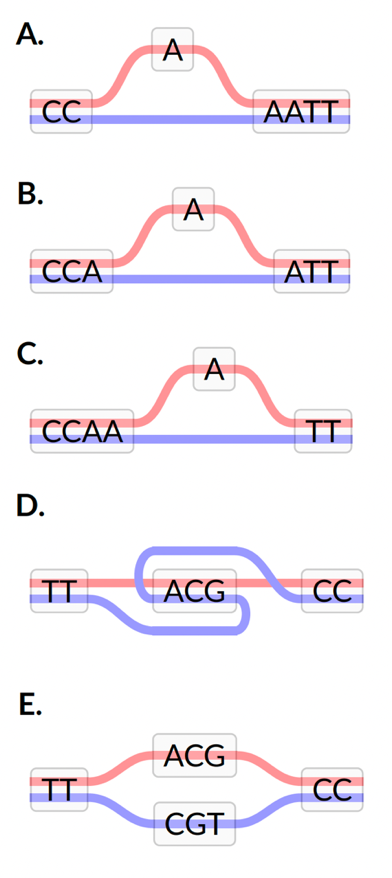
Figure 2 – A.–C.: Three equivalent ways to represent the removal of a A. D.–E.: Two ways of representing an inversion. We suppose here that the ancestral sequence is in red. In A., B., and C., the first, second, and third A are removed (respectively). Deciding which nucleotide is deleted is arbitrary, yet the resulting variant call will not be identical, differing by 1 or 2 base pairs. In D., the inversion is explicitly represented by introducing a reverse path that traverses the node in the opposite direction (which supposes that the reverse-complement sequence is used). In E., the inversion is modeled by adding a new node containing the reverse sequence. Although the two paths yield the same sequence, their graph representations differ significantly.
Additionaly, When repetitions and inversions are modeled by loops or bidirectional node traversal, they clearly inform the reader of that particular event. Conversely, it greatly complicates the graphs, and some downstream tools cannot be used on cyclic graphs. The implementation choices made by different graph builders affect the ease with which it can be manipulated (Liao et al., 2023).
Polyploidy is commonly found in species of agricultural interest, in plants or in animals like sturgeons. They can be divided into autopolyploids, which contain multiple sets of homologous chromosomes originating from the same species, and allopolyploids, which contain sets of chromosomes derived from different species, which are related but homoeologous rather than strictly homologous. If haplotypes are completely resolved, autopolyploids are not a problem to pangenome graph builders, since multiple homologous chromosomes can be analysed in a single graph. It is however considerably more complicated to get these phased haplotypes if they are nearly identical. When a phased pangenome is available, the graph can be used to phase new genomes, as it has been done on potato (Sun et al., 2025), and the graph may improve homeolog resolution. Downstream tools, especially genotyping tools, are not adapted to this configuration either, with the notable exception of varigraph (Du et al., 2025). Most of the time, homeologous chromosomes of allopolyploid species are handled separately. However, homeologous genes are also represented separately, and this limits the comparison. On the opposite, collapsing homeologous chromosomes into the same graph is expected to produce highly entangled topologies. Again, this is a trade-off between the quantity of information and ease of use.
As a conclusion, we advocate for the use of an explicit criterion, such as maximum likelihood, that would be optimized by graph builders. It would require an explicit molecular model of evolution, which would integrate the evolution of nucleotides, short repeats, and structural variants altogether. This would also require an improvement of the structural variants detection methods, since current ones fail to detect complex, entangled variations. Substantial work remains until such integrative models can be established, and it also requires more advanced algorithms, which would be able to exploit complex, cyclic, graphs. These graphs model more information, and should, in principle, be favored.
Graph visualization. Pangenome users need to visualize their graph, or at least a part thereof, in order to check the choices made by the pangenome builder (see previous section), or to gather information about structural variants. Admittedly, visualizing a graph with hundreds of millions of nodes is complex.
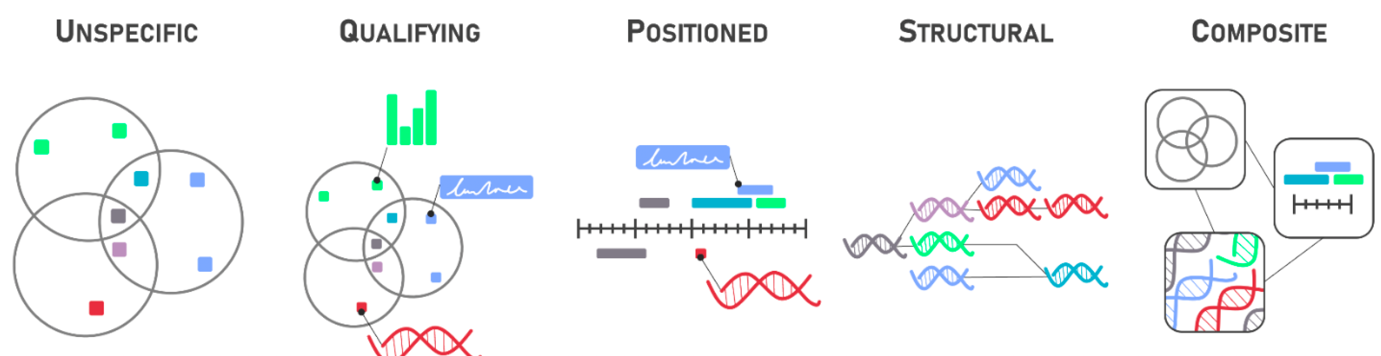
Figure 3 – Five categories of pangenome visualization tools, as presented by Durant, 2022.
In his PhD, Durant, 2022 proposed a classification of visualization systems into five categories (Figure 3). Unspecific tools use generic methods and are not dedicated to pangenome datasets, and include CytoScape (Shannon et al., 2003). Qualifying tools contain pangenome information, but no position, such as Anvi’o (Eren et al., 2020), Panache (Durant et al., 2021), PanVA (van den Brandt et al., 2024) using Pantools (Jonkheer et al., 2022), PPanGGolin (Gautreau et al., 2020), VRPG (Miao & Yue, 2025). Positioned tools anchor information on (pan)genomic coordinates. Structural tools focus on sequences and their continuity, like SyRi (Goel et al., 2019), CoGe SynMap (Haug-Baltzell et al., 2017), SequenceTubeMap (Beyer et al., 2019), odgi viz (Guarracino et al., 2022), Bandage (Wick et al., 2015) and Bandage-NG (https://github.com/asl/BandageNG), Vizitig (Degardins et al., 2024). Composite tools gather multiple categories within one tool, like Pantograph (https://www.computomics.com/home.html).
The ideal visualization tool would be able to represent the graph globally (at the chromosome scale) and locally (at base level resolution), giving the possibility to zoom in and out in an interactive, “Google Earth” way. The bird’s eye view would be able to mask small variations, and merge similar haplotypes, while retaining a global linear shape. Rules for conserving clarity and addressing the good information in the good visual channel must be the directive idea of any development. This idea has been suggested multiple times, and it is possible that some prototypes will implement this much needed feature soon. Another desirable feature is to be able to display the variations with respect to a known reference, or, on the contrary, being as agnostic as possible, and not favor any genome. The ideal tool should also be able to adapt a color pattern, in order to display a sub-population (e.g. cultivated vs wild individuals), or, on the contrary, display particular loci (e.g. genes, or exons). Hints should also mention which haplotypes belong the same individuals, in case of di- or polyploids organisms. Additional metadata should also be incorporated, and they could be reads counts, when sequences can be mapped to the genome. Moreover, it is likely that dedicated indexing data structures, or even adapted pangenome data formats, encompassing different zoom levels, should be needed to implement the ideal tool. Clearly, desirable properties for pangenome visualization are numerous, not to add that these graphs are huge. It is thus unlikely that a unique tool will fit all the needs.
Graph augmentation. Graph-based pangenomes are currently constructed using complete chromosome-level assemblies, obtained by long-read sequencing, but are often based on a limited number of genomes (Chen et al., 2023; Jayakodi et al., 2024; Liu et al., 2024). One of today’s challenges is to enrich these existing graphs to develop a more complete and accurate pangenome by integrating the diversity of a large number of additional individuals (The 3000 rice genomes project, 2014) or a small number of individuals of an exceptional ecotype (Bin Rahman & Zhang, 2013). These individuals may have been sequenced and partially assembled using long-read sequencing or resequenced using short-read sequencing technologies, thus providing access to greater inter- or intra-species variability. Currently, fragmented genome assemblies are typically discarded from the graph construction process, although they could provide valuable information on specific regions. Short-read sequencing, with its low cost and scalability, remains a practical choice for exploring diversity at the population scale or even broader levels (e.g., species, genus). Since the beginning of Next Generation Sequencing twenty years ago (Patrick, 2008; Reinartz et al., 2002), thousands of genomes and populations have been sequenced. This data is an incomparable resource of genomic diversity that will not be easily obtained in a few years with long reads. Despite the partial view obtained from this data, its use must be considered to add information in specific regions of graphs, and to resolve local short rearrangements.
Technically speaking, graph augmentation refers to the process of adding new genomic material to the graph, using individuals not present in the graph. The process adds paths by generating new nodes or subdivides existing ones, and inserting extra edges. This process can also enrich an existing graph with information such as the frequency of variations between individuals in a population. This can help identify rare alleles, study allele or genotype frequencies, or refine ratios of core genome (sequences present in all individuals) and dispensable genomes (sequences present in sub-populations only) in subsequent pangenomic analyses . The first step in extending a graph is typically sequencing reads mapping, but this can be a time-consuming process, especially for pangenome graphs. Short reads can be used to detect SNPs, whereas long reads can detect large variants. Of note, regions that are poorly represented in the graph (because of fragmented genomes, for instance in repetitive regions) are not expected to produce new structural variants. Nevertheless, adding information in genes or regions surrounding genes could be helpful for several biological questions, such as detecting variations in promoter regions and their impact on gene expression or mutations leading to novel coding sequences or gene alleles (Omrane et al., 2018).
SNP calling in a pangenome graph can seen counter-intuitive at a first glance: SNP calling is known to be fraught with errors, whereas variations found in pangenome graph are allegedly more accurate. This is why mapping and aligning reads to a graph is a critical step. Currently, few tools can map long reads. Minigraph (Li et al., 2020) clips reads into several non-connected match parts, while GraphAligner (Rautiainen & Marschall, 2020) tends to generate a high number of mismatches in indels due to the use of an edit distance instead of an affine-gap cost function. SVarp (Söylev et al., 2024) suggests the use of a wavefront alignment algorithm (WFA) to realign the svtigs (clusters of reads) after alignment with GraphAligner. This realignment process was implemented in gaftools realign (Pani et al., 2024), requiring a two-step process to obtain a reliable alignment. Nevertheless, large insertion or deletion events lead to fragmented alignments that will need a post process treatment to chain them. A recent version of vg giraffe (Chang et al., 2025; Sirén et al., 2021) implements a long-read mode to map PacBio Hifi reads and ONT Nanopore sequences, and can, in principle, map read with large indels. Another tool, Palss (Denti et al., 2025), performs graph augmentation with an alignment-free approach. Full sequence alignment is replaced by the use of specific anchors on nodes, combined with clustering steps of positioned reads, followed by their local alignment. In the end, alignments in GAM or GAF format are used to augment the graph with vg augment, adding each aligned read as a new path. It is crucial to choose stringent parameters in the mapping and in the augmenting steps, in order to discard low quality SNPs. Yet, there is currently no consensus on which parameters should be chosen.
This approach does not associate reads with sequenced individuals, allowing genotype paths to be added to the graph instead of sequenced reads. Graph augmentation seems to be proposed as a way to embed read alignments into graphs to facilitate variant calling. However, it appears to us that it could also be a useful approach to add new variability to the graph with population information. With the increasing quality of long-read sequencing, low-coverage sequencing of populations with long reads will be an interesting approach to augment the graph instead of rerunning the full process of graph construction. To achieve this, it would be useful for existing tools to evolve to utilize information tags such as Read Group (RG) available in GAM/GAF formats. Similarly, incorporating all variations detected in read mapping, especially small variants (SNPs, indels < 3 bp), does not appear relevant, as these can be effectively addressed by standard variant calling methods. Allowing the choice of the type of variant to use to augment the graph is also missing in available tool implementations.
To summarize, it is necessary to improve current methods for long-read mapping, which sometimes fail at aligning long SVs. Moreover, graph augmentation methods should also be improved, especially in the filtering steps, and the node and path modification steps.
Graph annotation. A pangenome graph reveals, by construction, the structural variants between the assemblies it contains. A structural and functional annotation is therefore necessary to identify, biologically interpret, and exploit genomic variations impacting genes and possibly phenotypes. A pangenome graph annotation can be defined as a complete representation of the genomic features, which includes genes and transposable elements, specifying their positions on the different identified paths. As a by-product, this annotation also provides the determination of the genes belonging to the core, dispensable and unique genomes, allowing downstream analyses like CNV detection or identifying gene family gain and loss. One of the challenges of annotating a pangenome is to move from linear to graph-type structure annotation, and to conceive a file format of this annotation.
The annotation method can be investigated in three different strategies: i) directly de novo annotate the graph with an algorithm that could explore all paths, ii) linearize the graph and apply annotation tools developed for linear references, iii) project coordinates or map genomic features from linear annotated genomes to the graph. Currently, there is no direct annotation tool for pangenome graphs, although multi-genome annotation tools (Fiddes et al., 2018) exist, and could be adapted. The first annotation strategy thus requires new developments (Wang et al., 2022). Recent genome-wide studies circumvent this lack of tools by linearizing the pangenome so that conventional annotation methods can be used (Jayakodi et al., 2024; MacNish et al., 2024), which corresponds to the second strategy. By iterative alignment of genome assemblies from a diversity panel on a reference, sequences unseen so far are identified and added to the reference to form the linear pangenome. Once new genomic regions are annotated, this linear pangenome can be used for downstream analyses with conventional tools in place of linear reference genome (Wang et al., 2022). A study using the same approach goes a step further by inserting the genomic regions presenting variations compared to the reference genome directly in the reference sequence, providing the genomic context of the structural variants on which functional analyses can be based (Wang et al., 2023). The third strategy has been more investigated by several tools such as vg, odgi and GrAnnoT. Odgi position (Guarracino et al., 2022) and vg inject/surject (Garrison et al., 2018) are sub-commands that can be adapted to transfer annotation by projecting coordinates between genomes of a same graph or from a genome to the graph. Vg annotate is another sub-command for annotation transfer on a graph. GrAnnoT (Marthe et al., 2025), developed by authors of this paper, also transfers a linear genome annotation to the pangenome graph and the graph annotation to other genomes embedded in the graph by projecting coordinates. A limitation of this approach is that the transferred annotation only comes from a genome taken as reference. Therefore, sequences absent from the reference genome (due to a deletion in the reference or insertion in other genomes) are not annotated on the pangenome graph. In principle, it could be possible to extract and annotate these sequences. Even though it is, in principle, as difficult as annotating a linear genome, tools are still lacking. Another issue arises when one wants to combine multiple annotations from different genomes into the same graph: currently, there is no tool available to merge and resolve conflicting annotations that may occur.
Transposable elements (TEs) have been known for decades to cause a wide range of changes in gene expression and function in plants (Lisch, 2012). Having an exhaustive representation of TE insertions at species level using pangenome graphs could enable us to better infer the evolutionary history of TE families and predict their co-option by the host genome. However, TEs are not straightforward to model in a pangenome graph: they tend to accumulate mutations, there are numerous cases of nested insertions, some elements move with a “copy-paste” strategy, and these translocations are difficult to grasp in a graph. There is, to our knowledge, no dedicated tools for TE annotation and analyses in pangenome graphs. It is however possible that graphs are not the best model to analyze TEs, due to their high evolution rates. Users can then resort to population-based tools, including TrEMOLO (Mohamed et al., 2023), developed by authors of this work, which compares a reference assembly with another fully assembled genome and long reads, and estimate the frequency of insertion in a population. GraffiTE (Groza et al., 2024) also uses long reads, but supports multiple fully assembled genomes for the same species. It produces a reference-based pangenome which includes the reference genome and the TE variations. While both tools operate with a reference, panREPET (Saidi et al., 2026), also developed by authors of this work, compares all the TEs of each input genome, and outputs the genomic coordinates of shared and singleton TE copies for each genome. It does not use a graph, however. Pantera (Sierra & Durbin, 2024) uses a PGGB graph to create a library of recently active TE families in a species, but it does not annotate the TE copies in the graph.
Likewise, it would be valuable to annotate pangenome graphs for other genomic distinctive features like DNA methylation, TFBS, TSS, TAD or any else informative loci. For an exhaustive annotation of a pangenome, it will still be necessary to form consortia that would invest time in manual curation of the annotation of the graphs, akin to the GENCODE project (Harrow et al., 2012), with possibly dedicated groups with expert knowledge in gene, TE families, and other types of features (methylation, TFBS, etc). Compared to the linear structure of individual genome, annotating a graph would require additional expertize on how to handle its branched nature.
Once annotation is transferred on pangenome graphs, we may want retrieve gene families to study their content and be able to find discrepancies between genomes. As seen before, finding trans genomic similarities (i.e. genomic repetitions that are not close together) raises considerable algorithmic issues, given that the graphs are sometimes built chromosome by chromosome, and that sequences may have significantly diverged (at least at the DNA level). In principle, one could imagine a refinement algorithm that would transform a given graph, so as to create bubbles and explicitly represent gene families through added edges. Polyploid genomes add a new layer of complexity, since gene families experience complex histories. Sun et al. (2025) used OrthoFinder (Emms & Kelly, 2019) on the haplotypes of the potato genome, while Huang et al. (2026) built a multiple sequence alignment of the genes of the sugarcane. Both analyses of polyploid genomes (with a mix-ploidy for sugarcan) switched from the genome-based graph to a gene-based graph. PanTools (Jonkheer et al., 2022) adds extra information layer on the graph (like knowledge graphs), in order to model these families in metadata. This reconciles pan-gene set (Jiao et al., 2024; White et al., 2025) and pangenome graph approaches, adopting the best of both worlds. The first one excels at representing gene family expansions and contractions, whereas the second can model variations inside each gene. Either way, representing genome plasticity in the graph helps researchers to understand how species evolve, by shedding light on lesser known mechanisms, such as gene duplication and neo/sub-functionalization, TE domestication, and TE elimination.
Last, there is no convenient file format for the annotation in pangenome graphs. The Graph Alignment Format (GAF) is a text format, tab-delimited like BED files, which was proposed to represent alignments. Since they basically model paths, they have also been used to store annotations in a pangenome graph. However, its specifications does not include a field for feature types such as CDS, exon or UTR, and tools that index and query them efficiently are only appearing (Novak et al., 2024). A new standard file format, gGFF for graph Generic Feature Format, has been proposed by Llamas et al. (2021). It is a text-based, tab-separated file which generalizes the GFF3 format, and replaces genomic intervals with a subgraph (Llamas et al., 2021). An option (--ggff) from vg annotate can convert a GFF3 file from one genome into gGFF through a pangenome graph. It could be useful that existing tools that manipulate graphs integrate the gGFF format. However, this format is still not adopted, and it is still not clear how to include annotations of several individuals in a gGFF format.
To summarize, pangenomics still need methods to annotate graphs, represent these annotations in a uniform way, and to merge them from different individuals. Functional annotations, including gene or TE families, should also be adapted, with the caveat that a single graph may not be the best model for representing genome plasticity, and additional information layers may be required.
Producing FAIR pangenomes. As seen in the previous sections, many graphs (or similar data structures) have been produced and already published. However, their sharing respecting the FAIR principles is still problematic. In practice, producing and sharing FAIR pangenomes requires the adoption of standards, across communities of practices, addressing nomenclature, quality control (Section “Graph quality assessment”), data formats, and visualization (Section “Graph visualization”).
First, the names of the assemblies (genomes or haplotypes) should adopt unified nomenclatures, following Cannon et al. (2025) for genome assemblies and PanSN for path names. In case of allopolyploid genomes, a special tag should inform of the ancestry of the homeolog chromosomes. The sequences should also have an external unique identifier directing to the database where it is stored. Once the graph is finalized in its initial version, as discussed before, it could be augmented in various ways, or generated again using a new version of the building tool, or another one. In this regard, using a common and universal versioning and naming system would greatly simplify the identification and re-use of pangenome graphs. The versioning a minima is mandatory, as each version, related to a specific URI, will ensure a good reproducibility and finding of the same graph. A minor versioning could be performed when the dataset is not really modified but only meta-information added (such as annotation), and a major one for any change in its global structure (such as adding new paths or new nodes). In addition, even using an identical set of embedded genomes (and the order thereof), a pangenome building tool (together with the versions and the parameters) may produce different graphs, because of the stochasticity of the methods, or because multithreaded implementations order the tasks differently. It thus should be advised to provide all the metadata in the header lines in the GFA file itself, the rationale being that the user should have all the means to build the same graph, when possible. This will inform on the level of “quality” of the graph, its representativeness, its advantages and limits.
The GFA format is the current standard for variation graphs. It exists under different versions (e.g. rGFA/1.0, 1.1, 2.0) and if the GFAv1.1 is the most widely used, its implementation in itself varies. Some tools provide paths and other walks; some give additional tags to nodes or links, some none. vg defined GAM and GAF formats for aligned reads, with a clear inspiration from the BAM and PAF formats. For annotations, gGFF format has been suggested, but it is hardly ever used. Current methods use a GAF format to describe an annotation, but it lacks the expressiveness of the GFF format (intron/exon, UTR/CDS). The VCF format can also be used to describe variants in a pangenome graph. It is not easy, however, to describe complex variants, such as nested variants, in this format. Pantree (Salehi Nowbandegani et al., 2026) drafted a VCF specification, with customized VCF fields that extends the standard format (while maintaining compatibility) in order to add pangenome-specific information.
Then comes the problem of sharing it in a FAIR way. Non-recommended practices are observed, such as sharing graphs through non-specialized data repositories (Zenodo), and assorted of very basic metadata, if any, except author names. It would be best to collect all the graphs in a dedicated repository, itself hosted in the INSDC databases (NCBI, EBI, DDBJ), with a standardized relationship between the graphs and the embedded sequences, the individuals, the publication, etc. A first suggestion, made for gene-centric pangenomes (Heuermann et al., 2025), could be extended to sequence-based graphs. A unified, consistent, and metadata-rich repository will ensure a long-term preservation of these datasets, improving reproducibility and scientific probity.
Finally, a FAIR pangenome graph file should be linked to derived FAIR data from the entire study, beyond the input FASTA files: annotations, variations, synteny blocks, genes families, among others. State-of-the-art methods could link these diverse objects (Soiland-Reyes et al., 2022). This would facilitate the reuse of the graph, interoperability with existing databases, and implementation of new tools (Arnoux et al., 2024). Pangenome graphs could also be part of genome portals, which include multi-species portals (e.g. Ensembl (Dyer et al., 2024)), and specialized ones (e.g. Rice Genome Annotation Project (Hamilton et al., 2024) or The Arabidopsis Information Resource (Reiser et al., 2024)). For instance, variations in the graph could be linked with the variation database, in order to assess its frequency in the sampled population, and possibly link to the phenotypes of the individuals carrying the variation of interest.
To summarize, we advocate for transparent practices, that would make any user able to reproduce the same graph using metadata. This metadata information could be stored inside the graph, using normalized keywords, or provided in an external file, in order to keep the graph file as small as possible. Moreover, it is crucial that these graphs, metadata and related information be stored in high-quality, long-term strategic repositories, encoded into community-approved formats, which support querying for a fast and intuitive retrieval and ensure open and fair data licensing.
Using a graph
Manipulating and exploring data from graphs. A pangenome graph contains in itself a wealth of information that users may want to extract. Yet, graphs are very large, and dedicated algorithms should be developed.
The most straightforward graph manipulation is to extract a locus of interest. It is already implemented in vg chunk (Garrison et al., 2018) or odgi extract (Guarracino et al., 2022). Extracting the loci that share similarity with a given sequence can also be performed through mapping the sequence beforehand. This way, it is possible to focus on a particular gene, and visualize its variations (Section “Graph visualization”). Structural variants, such as tandem repeats, inversions, or translocations, are usually more difficult to extract, and would require additional tools. Ideally, these extractions should be accessible using simple queries, so the user can add several constraints (e.g. find all the inversions inside the introns of gene X).
Queries should also be able to compare paths, such as the extraction of all the variations that are specific to a sub-population. For instance, one could be interested in finding all the variations that discriminate between wild and domesticated individuals. Similarly, runs of homozygosity measure inbreeding, and can help reconstructing demographic histories (Shafer & Kardos, 2025). Haplotypes of the same ancestry, in case of allopolyploid genomes, could be compared to haplotypes of another ancestry, in order to characterize the variability between them. This information is already present in the graph, and can extend previous methods to non-SNP cases.
Statistics could also be computed along the graph, and possibly, along a reference genome. They include the number of variations per kilo-base-pair, but also the minor allele frequency, or the percentage of heterozygosity. This could qualify and discriminate the different parts of the genome.
Several types of exports are possible, beyond the GFA. VCF encode variations with respect to a reference, and presence-absence matrices can also be computed with odgi pav. Other graphical visualisation, such as principal component analysis, or dendrograms, could also help visualizing the population structure.
Since graphs are large, dedicated index structures should be devised. Odgi (Guarracino et al., 2022) implements its own, and Sirén & Paten, 2022 suggested several, depending on the task. Yet, it seems that we did not reach a stable, widely accepted indexing system for the graphs.
To summarize, while toolbox such as vg or odgi provide many tools for graph manipulations, other, high-level, operations are still lacking for a full exploitation of the graphs.
Population genetics and coalescent theory. A pangenome graph, akin to a multiple sequence alignment, can be considered as an observation of an evolutionary scenario. As such, many questions on evolution could be addressed using this graph. For instance, it is tempting to find a coalescent that would match the pangenome graph, or to run an admixture analysis to find populations. It is indeed a good quality control to check whether the individuals in the graph match the expected breeding history (see for instance the cattle pangenome (Smith et al., 2023)). Discrepancies may hint incorrect or biased assemblies when, for instance, ONT-based assemblies are separated from PacBio HiFi-based assemblies. While in cultivated individuals, the evolution is known, this information could shed light to interesting discoveries in wild individuals, by tracing back the history to putative ancestors. Compared to SNP-based methods, graphs have the advantage to also include structural variants, which may add crucial information.
In principle, finding a distance between genomes, and infer the evolutionary scenario, can be easily done by exploiting the graph. Akin to a mash distance (Ondov et al., 2016), it is possible to extract a Jaccard distance between two individuals by counting the number of common (and private) nodes. Alternatively, it is also possible to compute a distance based on presence/absence of the nodes in a given path (akin to a PAV matrix, where the node replace the genes).
However, contrary to inter-species analyses, inbreeding (crossing individuals with a very recent common ancestry) are frequent inside a population, and should be considered. This is also a difference with a local analysis, spanning the length of a gene, for instance, where this effect can be neglected. It is thus not possible to rely on usual phylogeny to exploit the graph: the phylogenetic tree will differ from locus to locus.
Considering this, it is either possible to model the coalescence from the whole graph using dedicated methods such as split trees (Huson, 1998), or ancestral recombination graphs (Griffiths & Marjoram, 1996). Alternatively, it could be possible to infer local evolutionary scenarios, (partially) independently computed on sub-parts of the graph. This is a complex task since, contrary to a inter-species analysis, not only the branch length should be estimated, but also the shape of the tree (or any formalism that would model the process). Furthermore, segmentation (i.e. finding the boundaries where the model should be used) should also be computed, possibly based on genes.
A possible extension of this method is the search for introgression, which is the addition of genetic material from an outgroup. For instance, cultivated individuals can be crossed with wild ones, in order to increase resistance or vigor. This is a major source of genome plasticity in diploid species, even in autogamous crops (Burgarella et al., 2019). Introgression can be detected by finding unexpected patterns while constructing evolution scenarios in localized areas, or adapting D-statistics and f4 statistics to the pangenome graph.
Selection is also a key issue in agronomy. Some phenotypes are highly desirable, and if they are linked with a genotype, the linked alleles tend to be under strong positive selection. This will results in loss of diversity in the regions. Many methods and tools have been developed (Hejase et al., 2020) (involving for instance the Fst) to address this issue, yet they primarily focus on SNPs, whereas SV should also included in the analysis. The pattern should, in principle be clearly visible in the graph, since we should observe longer nodes, and less entangled paths. On the contrary, regions with a significantly high number of variations could be a trace of local adaptation. To date, only Pansel, provided by authors of this work (Zytnicki, 2024) tackles this problem. However, it is still centered on one reference genome, and uses a fixed-size sliding window, which limits the scope of the tool. To summarize, it thus crucial to develop methods and tools that could compute different metrics on the graph, which include traces of selection, or signs of introgression, to name a few.
Dual pangenomes. A prospective exploitation of pangenome graphs is querying two or more graphs together in order to search for horizontal transfers, which are an important component in agronomical research, for instance in studying plant holobionts or in insect-based biocontrol. Several methods have been developed to tackle this problem (Wijaya et al., 2025), and provide excellent result to detect transferred genetic material. Yet, using pangenome graphs could also be applied to this case, with several different advantages. A first possibility would be to look for paths or subgraphs with similar sequences which come from two different species.
Even more prospective is the search for correlated trajectories in variations contained in two different graphs. For instance, correlated variant frequency changes in subclades, geographical or ecological populations, may be signals of co-evolution between hosts and symbionts. Similarly, pathogens and hosts can be involved in an evolutionary race for which correlated variation patterns may be detected in both graphs. Developing such approaches will require new solutions to query graph variations based on metadata associated to the genome paths (sub-population, environmental factors, etc.) and to look for graph topologies correlated to these parameters in both graphs, or at least phylogenies which would correlate with an adaptation of pathogen to host. Candidate regions would then be investigated for possible changes in proteins, and would explain how interactions would take place. In the near future, we expect that pangenome graphs will be commonly used in population genomics to detect regions involved in adaptation. The pangenome graphs of Fusarium oxysporum, a major plant pathogen, revealed the complexity of linking accessory chromosome content and host specificity (van Westerhoven et al., 2024) when a broad range of hosts could be attacked by the same pathogen. In the case of polyploid plant genomes such as Brassica napus (Brassica oleracea x Brassica rapa), or bread wheat / durum wheat, some pathogens specifically target one ancestral genome. Including ancestral and hybrid genomes in a graph will help to identify sequence variability and evolution between new and ancestral chromosomes in regard to a graph of pathogen strains with specific patterns of adaptation. This kind of approach will help to understand the molecular determinants of adaptation, as studied between L. maculans and B. carinata (Noah et al., 2024). To summarize, variations in the host pangenome graph could be compared with variations in the pathogen graph to find traces of adaptation.
Pangenome graphs for metagenomics and organelle-based studies. Pangenomes graphs were recently proposed as a mean to classify metagenomic sequences from a taxonomic or functional point of view.
A first approach is to base this classification process on organelle-based graphs. While assembly graphs were already derived to study large structural rearrangements in mitochondria, such as Master-graph (He et al., 2022), to our knowledge the vgan package (https://github.com/grenaud/vgan) is currently the only attempt of organelle-based graphs for tasks of classification ranging from human sub-populations to taxonomic classification of environmental metagenomes. All vgan tools have in common a first step where mitochondrial query reads are mapped to a concatenate of mitochondrial variation graphs, then mapping results are exploited in probabilistic frameworks to produce a classification. Currently, this process got adapted to three categories of analyses. Haplocart (Rubin et al., 2023) is dedicated to human haplogroup classification: mitochondrial variations help to compute the likelihood that a sample belongs to a specific sub-population. Euka (Vogel et al., 2023) aims for taxonomic classification and abundance estimation for ancient environmental DNA (aeDNA) samples. A set of mitochondrial graphs is built for each targeted taxon (family, genus, species, etc.) and mappings are filtered using two estimators : their likelihood to result from aDNA-specific degradation and the likelihood of the mapping given the sequence diversity variations hold by the collection of taxon-specific graphs. Finally, Soilbean (Vogel et al., 2024) extends on Euka’s process with a Bayesian inference to refine aeDNA classifications even for the least abundant taxa. Note that while the authors provide all necessary tools and pre-computed graph databases to classify new datasets, it is not always documented how to build a custom database for one’s taxa of interest.
Going further, taxonomic classification combined to gene family functional analysis was proposed by the procaryote-centered, graph-based tool, StrainFLAIR (Da Silva et al., 2021). In this approach genes are extracted from a set of genomes, then families are built via sequence clustering. A variation graph is built for each family’s alignment and query metagenomes can be mapped to this set. Then an algorithm relying on global coverage of mappings in all family graphs is used to produce a strain-level classification as well as relative abundance of the strains.
These applications represent a potential preliminary step toward an extended use of pan-genome graphs in typical ecosystem-integrated (“one health”) projects where a agronomic ecosystem is studied in its entirety, e.g. from communities of domestic species to soil or aquatic ecosystems with which they interact. Strikingly, we did not find any similar approach exploiting plastid genomes, to the exception of some assembly graph based studies (Liu et al., 2023). The potential of plastid-based variation graphs to answer plant driven questions in agroecosystems remains to be explored.
Downstream analysis using omics data
Variant analysis and genotyping. Commonly, genotyping a large number of samples for representative variants requires two successive steps. First, a set of representative genomic variants is obtained from a limited number of samples by read mapping to a linear reference genome, variant discovery and variant callset merging and curation. Second, the curated variant set is genotyped in a larger number of samples, typically sequenced with shorter reads or at a lower read depth. For this second step, the benefits of representing genomic variants in a graph has already been demonstrated. Indeed, most recent variant genotypers now reduce the reference bias in the read mapping and genotype inference steps by using a graph representation of the variant alleles, making the genotyping more accurate, such as BayesTyper (Sibbesen et al., 2018), GraphTyper2 (Eggertsson et al., 2019), Paragraph (Chen et al., 2019), vg call (Hickey et al., 2020), Pangenie (Ebler et al., 2022), Varigraph (Du et al., 2025) with short reads, and SVJedi-graph (Romain & Lemaitre, 2023), developed by authors of this work, with long reads. The benefits are even greater for structural variants compared to SNPs and indels (Hickey et al., 2020), and for variants that are close to each other, overlapping or nested in one another (Romain & Lemaitre, 2023).
These genotypers are based on the quantification of reads supporting each of the variant alleles in the graph, either by read-to-graph mapping (GraphTyper2, Paragraph, SVJedi-graph) or by alignment-free approaches based on k-mer set comparisons (BayesTyper, Pangenie, Varigraph). Several methods thus infer genotypes based on read or k-mer counts along variant paths in graphs. However these methods are not directly applicable to pangenome graphs built from whole-genome alignments, because they all build their own graph by augmenting the reference genome with a set of already characterized variants with respect to this reference. They cannot take any sequence graph as input, and the types of variants they can genotype are limited to simple types and/or those that can be described in relation to a reference genome in VCF format. For instance, to apply Pangenie to the variants derived from the draft human pangenome reference (HPRC) built with Minigraph-Cactus, an intermediate variant formatting step was required. This involved representing the variants relative to a selected reference genome and retaining only those variants compatible with Pangenie in the input set (Liao et al., 2023).
Pangenome graph building tools have their own pipeline to genotype variants directly in their graph, the first step of which is to detect the variants as bubble motifs in the graph (Section “Graph quality assessment”). Genotyping of these bubbles can then be performed directly on the whole graph by read-to-graph alignment methods with vg giraffe (Sirén et al., 2021) for Minigraph-Cactus and PGGB graphs or Minigraph-dedicated mapper (Li et al., 2020). However, when the number of samples to be genotyped is large, read-to-graph alignments can be very resource-intensive and lead to scaling issues. Pangenie (Ebler et al., 2022) constitutes an alternative that scales better. It is based on k-mers, and is thus to be used on de Bruijn graphs. Pangenie requires a reference genome and cannot handle all possible bubbles (complex nested bubbles and cycles are not allowed, see examples in Figure 4). A more general method is thus to be developed.
One critical step in these pipelines lies in the interpretation and characterization of the obtained variants. A bubble can represent a wide range of variant types from single isolated SNPs, to indels and large structural variants. Moreover, there is no one-to-one relationship between bubbles and variants: a bubble can represent several variants combined (for example, for variants that are close to or nested within each other), and the same structural variant can be represented in several overlapping and intricate bubbles. The combination of different types of variants in the same locus, or the inclusion of small variants within larger variants, leads to a multitude of complex and intricate topological motifs in the graph. Apart from assessing the ability of bubble callers to exhaustively detect all these motifs as bubbles, the main problem lies in the fact that all these different types of variants are reported as the same generic bubble motif, with little in-formation, namely a position in the reference genome and the different walks in the graph taken by the different alleles. While isolated SNPs are easily identifiable by their distinctive allele path size of 1 bp, distinguishing and characterizing all the other variant types and their various combinations is much more difficult. Currently, tools like Bubblewave (Liao et al., 2023) are limited to insertions and deletions, and ignores other SV types, such as inversions, duplications, transpositions. As mentioned before, bubble detection tools are limited by the ability of the pangenome graph to detect these complex topologies.
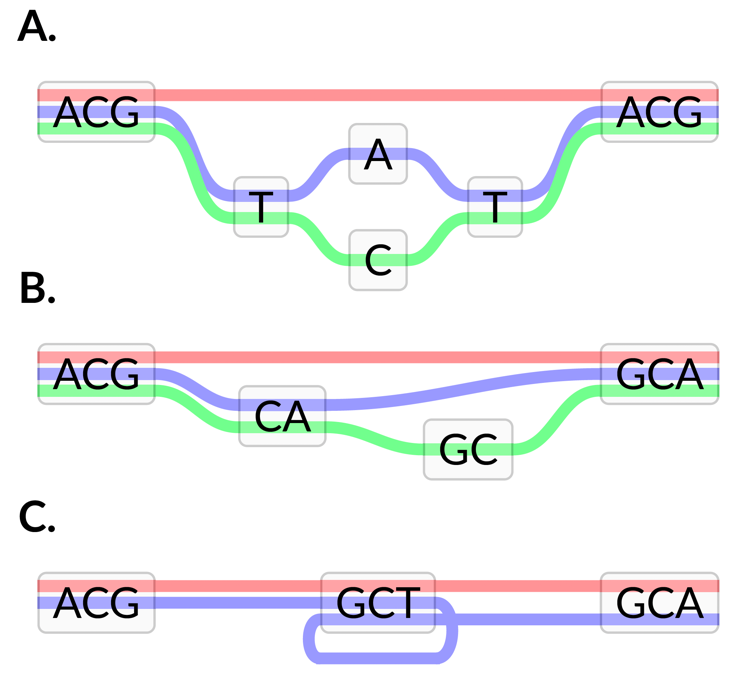
Figure 4 – Examples of nested and complex variants that are difficult to represent and genotype. In these three examples, we suppose that the reference genome is in red. In A., there is a SNP with two different alleles (A in the blue genome, and C in the green genome) in a region that is absent from the reference. This variant is likely to be represented as an insertion with respect to the reference genome with two possible alternative sequences (TAT and TCT). In this case, genotyping will likely genotype the different alternative sequences, but not the individual SNP themselves. In B., we observe two cumulative insertions, when compared to the reference genome: CA is inserted in the blue and green genome, and GC is further inserted in the green genome after CA. This forms overlapping bubbles that may be missed by vg deconstruct and cannot be genotyped for instance with Pangenie. In C., the GCT sequence is duplicated in the blue genome, forming a loop in the graph, which is not allowed in Pangenie.
A recent work investigating the representation of large inversions in pangenome graphs, carried out by authors of this article, showed that few of them are easily identifiable among the bubbles reported by bubble callers and that their representations vary greatly between the different pangenome pipelines (Romain et al., 2025). There is therefore a need to investigate the topological motifs generated by complex variant types, and combinations thereof, and then to provide automated tools to detect and annotate them in the graphs. Furthermore, it remains to be assessed how comprehensive and accurate are current bubble detection tools even for simple SV types, given that there are currently no published studies aiming at benchmarking pangenome graph and bubble detection tools with controlled variant sets. Finally, even without precisely characterizing the variants, current pipelines still rely on a reference genome in intermediate steps and especially in the VCF output format. Thus, representing and analyzing these variants without a reference genome remains a challenge.
Association studies. Genome-wide association studies (GWAS) are a widely used approach in genomics to identify genetic variants associated with specific traits or diseases. These studies typically begin with a large set of single nucleotide polymorphisms (SNPs) located on a linear reference genome. These SNPs are genotyped in contrasting populations, where individuals are sequenced using short reads at low coverage (Uffelmann et al., 2021). Today, thousands of studies have identified large sets of causal variants associated with heritable traits. However, these variants are often reported alongside phenotypically unrelated but physically close variants due to linkage disequilibrium (Watanabe et al., 2019). A first extension of this method consisted in including structural variants, usually detected with long reads mapped to a reference genome, and adapting available methods. This provided impressive results (Wang et al., 2024), with several structural variants discovered, but still relied on a unique reference genome.
Recently, a new GWAS approach without a reference genome uses k-mer count matrices (Corut & Wallace, 2023; Voichek & Weigel, 2020). This method, called kmerGWAS, aims to identify directly trait associated k-mers from a large set of resequencing samples. However, it suffers from the difficulty of repositioning the very short sequences on a reference in order to identify the underlying genomic regions. Methods for estimating the abundance of unitigs (Vicedomini et al., 2025) could also be, in principle, used. This method has several advantages, but it raises new, unanswered questions. Since the k-mers are considered independently, it is difficult to verify that the linkage disequilibrium cannot be leveraged in order to get stronger results. Moreover, k-mer counts are usually not independent: several k-mers encode the same variant allele. And, in case of nested variations, tests are not independent either.
The efficiency of the GWAS highly depends on the genotyping quality. Furthermore, common statistical methods, based on linear mixed models (Lipka et al., 2012; Mbatchou et al., 2021; Widmer et al., 2014; Zhou & Stephens, 2014) often do not take missing data into account, and are limited to biallelic variants, so it is common practice to reduce the variant input set to SNPs characterized in the vast majority of individuals. However, while pangenome graph approaches could make it possible to genotype a greater diversity of genetic variations, the current efficient alignment-free tools based on k-mers such as Pangenie (Ebler et al., 2022) or Varigraph (Du et al., 2025) fail to take into account the complexity of the graph because they need a VCF as input, which can be obtained by scanning the graph with a dedicated tool (above Section “Variant analysis and genotyping”) but consist of a simplification of the graph structure. On the other hand, another common approach (Asri et al., 2025) is to align the reads onto the graph with vg giraffe (Sirén et al., 2021), surject to a linear genome, and call the variants with DeepVariant (Poplin et al., 2018). The latter method has the advantage to consider the entire graph and should be able to identify new smaller variants not present in the pangenome graph, but it is very CPU intensive. Interestingly, Huang et al. (2026) developed a method that considers the dosage of homeolog genes, and added it into the model. Nevertheless, only a few studies (Liu et al., 2024; Yang et al., 2025; Zhou et al., 2022) used the pangenome graph in order to establish a convenient reference calling set for the association studies so far.
To leverage pangenome graphs for association studies, new tools must be created. One initial direction could investigate alignment-free variant calling directly on the graph, instead of first exporting it as a VCF file through a reference-based simplification process. These tools could identify sub-sequences representative of specific genome paths and scan resequenced samples with a k-mer approach. Conversely, another strategy would be to align short sequences identified through a kmerGWAS approach onto a pangenome graph, and exploit its rich structure to characterize complex regions associated with a phenotype. These methods could use the full graph, or focus on the variations that have been previously exhibited in the sequencing data, and possibly added to the graph. Imputation could also be implemented in pangenome graphs.
Indeed, due to cost or technical constraints, sequencing depth is often sacrificed to increase sample size, resulting in high levels of missing data that complicate statistical analyses. Then, untyped variants are usually imputed using a phasing approach with reference individuals or populations (Browning et al., 2018). Employing the pangenome graph as a backbone for phasing facilitates the inference of missing alleles. This is the method used by Bradbury et al. (2022) in their framework, the The Practical Haplotype Graph. They use a treillis graph, where a hidden Markov model can be used to retrieve the haplotype. Yet, a general imputation tool still is missing.
Furthermore, considering that more and more individual genomes will be sequenced in high quality and therefore included in pangenomes, it should be interesting to directly use the graph as input of the classical GWAS. It should be possible to use the nodes and their corresponding paths to construct a presence/absence matrix and perform association tests using the phenotypes of the individuals included in the graph, and first tools have been recently suggested in this direction (Vorbrugg et al., 2024; Zhang et al., 2026). Belinchon-Moreno et al. (2025) used this method in order to find new nucleotide-binding domain leucine-rich repeat receptor genes (NLRs) associated with resistance in melon, and found new loci using graph-based approaches. Yet, the independence of the tests is not clearly solved. Alternatively, topologies representing variations, such bubbles, or snarls, could be analyzed, and paths forming these structures could be genotyped, and used for a GWAS. Currently, the number of genomes in a graph usually does not exceed a few dozens, and it is far from sufficient for an analysis.
Last, it is crucial to be able to include knowledge gathered in the last decades into a pangenome analysis. In principle, it is possible to include previously found SNPs in a pangenome graph, and perform the GWAS on the enriched graph. Previously generated sequencing data can also be used to run an analysis on the graph, instead of a linear genome. It is then expected that more QTLs, or more precise QTLs, will be found (Zhou et al., 2022). In the case of biparental or multi-parental analyses, it is even possible to trim the graph to the variations known to be present in order to reduce the complexity of the analysis (Sirén et al., 2024). Chip data are more difficult to associate to a graph, but they could be used to impute the whole genome sequence of an individual —a task that has not been addressed yet.
To summarise, although SVs from pangenome graphs have already been used on different GWAS approaches, we need new GWAS methods and tools that could directly take advantage on the graph instead of a linear genome.
Towards multi-omics pangenomics. Multi-omics integration refers to the inclusion of different sources of molecular information, such as genomics, transcriptomics, proteomics, epigenomics (methylation, histone marks, and chromosome conformation), metabolomics, and ionomics. We can foresee that, in a near future, it will be affordable to collect several omics data types together with the genomes of interest. The aim is to get a more exhaustive analysis of the cellular processes and interactions, and possibly characterize the link between genotype and phenotype. As such, pangenomics can be considered as a part of a multi-omics analysis, and several databases gather omics data for different individuals (Hu et al., 2024). However, today, most of these data types are still projected to the reference genome.
Graph-based methods can thus be used to remove this reference bias (Danilevicz et al., 2020; Hu et al., 2024; The Computational Pan-Genomics Consortium, 2018; Wang et al., 2022; Zanini et al., 2021). Genotyping, using arrays or sequencing, usually leverages SNPs in order to characterize genome variability, and can also be integrated to other omics analyses. A graph-based method is expected to increase the number of putative variants to be tested, included non-reference variants, and SVs.
Linking variations with one other omic data can be considered as an extension of the GWAS method. For instance, eQTL links genotypes with gene expression, but other analyses have been defined for proteomics, metabolomics, etc. In principle, it is thus possible to adapt methods presented in Section “Association studies” in order to tackle this question.
However, a major difficulty here is to collect information provided by sequencing data. Using a reference assembly, reads produced by RNA-Seq, ChIP-Seq, or other, usually are mapped and compared to gene locations, in order to access gene expression, histone marks, etc. Using pangenome graphs significantly complexifies this step: it requires an exhaustive annotation of the whole pangenome graph, as well as dedicated mapping and quantification tools. Some of these tools exist: Graph Peak Caller (Grytten et al., 2019) can be used to find ChIP-Seq peaks, and Sibbesen et al. (2023) use a combination of vg rna, vg mpmap, and RPVG, in order to map RNA-Seq data and quantify the expression. Interestingly, (Huang et al., 2026) showed that, compared to linear genomes, a graph-based approach improves the mapping step for autopolyploid genomes, since homeolog loci are collapsed into the same nodes; this process decreases by half the number of multi-mapped reads, which are usually discarded in downstream analyses. In the same work, the authors showed an interesting example of a structural variant modifying the chromatin accessibility, with implications on the gene expression in cis (assessed with ATAC-Seq and RNA-Seq respectively). However, the efficiency of these tools remains to be established, and tools for other uses (methylation, chromosome conformation, etc.) are still lacking. These data can then be aggregated using available methods, such as the mixOmics package (Rohart et al., 2017).
Another difficulty is to represent the omics data on the graph. In linear genomes, they are modeled as genomic intervals, and could be translated as sub-paths. These sub-paths should be efficiently stored and indexed, with dedicated data structures (Novak et al., 2024). Now, it is crucial to estimate distances between sub-paths, such as the distance between a promoter (found using ChIP-Seq) and a TSS (found using RNA-Seq). This distance is not clearly defined in a graph, but investigations are more than welcome here. In general, an extension to the operations included in the bedtools suite (Quinlan & Hall, 2010) to the graph would be helpful to the community.
To summarize, we have to adapt tools that use linear genomes for each omics data individually, and also need methods that would compare them. Transitioning from genomic intervals to graph-based regions is a specially complex task.
Conclusions
This work highlights several aspects of pangenomics that still cannot be satisfactorily tackled due to lack of dedicated methods and tools. To date, no need is totally covered. Pangenome builders, such as Minigraph-Cactus (Hickey et al., 2023) and PGGB (Garrison et al., 2024), are still satisfactory, but some aspects, so as the consistency of results (two identical executions do not always produce the same graphs), could be improved. Reads can be mapped using vg (Chang et al., 2025; Sirén et al., 2021), but they have problems with loops in graphs, which limits its use to Minigraph-Cactus graphs. Genotyping can also be done with the same tool (Hickey et al., 2020), yet results are sometimes suboptimal. Other uses are even less covered. The most crucial needs include proper quality assessment, practical visualisation tools, stable file formats and better methods to exploit graphs. Although it may look desperate at first glance, it also means that there are new avenues for developments, which will require closer collaboration between disciplines: computer scientists, statisticians, etc. on the one hand, and biologists, agronomists, etc. on the other hand. The latter group could detail and augment the wish-list presented here, whereas the first group could develop the much needed methods and tools.
Based on the previous sections, we summarize in Table 1 the list of developments that should be implemented in order to make a full use of a pangenome graph. Acknowledgedly, working on graphs with hundreds of millions nodes, as it is common in pangenomes, is hard. This is why the community also needs to develop algorithmic tools. Essential concepts for genomics, such has the Burrows–Wheeler transform (Burrows & Wheeler, 1994), seminal for read mapping on a linear genome (Li & Durbin, 2009), has been extended to graphs (Novak et al., 2017). However, other concepts, including sketching (for example with minimizers) (Ndiaye et al., 2024) should also be extended to the non-linear case. Indeed, since many nodes can be much smaller than the k-mer size, indexing them is not trivial, and new indexing strategies could be devised. All the questions mentioned in this work should be accompanied with methodological developments. In particular, new integrative systems should be developed specifically for graphs and their derivatives, in order to enable user-friendly manipulation, analysis and visualisation in the light of other evidence. New artificial intelligence methods could help to make these systems faster and more accurate.
Links to other pangenomics frameworks should also be investigated further. Pangenomics has been coined twenty years ago, and already benefited from many developments. For instance, the gene-centric view highlights gene family variation/extension/reduction (Shaiber et al., 2020), an information which is not available using current tools working on pangenome graphs. De Bruijn graphs also implemented useful features, which could be adapted to variation graphs. PanTools (Jonkheer et al., 2022), for instance, includes several methods for phylogeny reconstruction. This tool also incorporates a knowledge base, which can store structural and functional annotations, gene families, etc. This idea could be generalized to other types of graphs, and support complex queries. Graphs could also be equipped with links to other resources (i.e. gene expression, or phenotype databases), and be explored using Web portals. An other possibility of development is an interface to metabolic networks. In principle, it could be possible to predict the impact of variations which are observed in a individual, and to compute the expected outcome in the network, paving the way to a personalized metabolism.
Of note, we chose to mention applications to agronomy. Pangenomics is obviously not restricted to this field, and could be used for studying ancient DNA, or cancer evolution, among others. Several of the questions mentioned here could be applied there.
It is also clear that the computer science community should help to perform this transition, and this work is under way. Numerous reviews explaining the concept are available (i.e. Matthews et al., 2024). Because of the a wealth of new methods, it is difficult to match a tool with a need. Fortunately, the community maintains a few lists, such as awesome-pagenomes (Davenport, 2026) that cover the recent developments, organized in topics. Some scientific organizations and private companies now offer courses on pangenomics for newcomers, and we can expect more in the future. Tools may also be difficult to install and use. Several pipelines have been developed in order to ease this process: an nf-core pangenome pipeline (Ewels et al., 2020), and a snakemake pipeline (made by authors of this work, Pan1C: https://forge.inrae.fr/genotoul-bioinfo/Pan1c/pan1c build a pangenome graph (together with a list of variants, and several visualizations) with minimal effort, using tools encapsulated in containers. To date, it seems that most of pangenome graph tools are not available as Galaxy plugins (Abueg et al., 2024); this could however facilitate its use in pipelines. Computational requirements can also be a limitation. One of the largest pangenome graph made so far (Liao et al., 2023) is the human one, with 47 diploid individuals. Minigraph-Cactus and PGGB took a few days (but the process can be parallelized), and a few hundreds of GB RAM, to build the graph. Using a compressed algorithm (Sirén & Paten, 2022), the graph can be stored in a 6Gb file, although it stores 94 haplotypes of size ∼3Gb. Even though it is more complex to map a read to a graph compared to a linear genome, it is not necessarily more time consuming: vg giraffe (Sirén et al., 2021) is faster than Bowtie2 (Langmead & Salzberg, 2012) and BWA-MEM (Li, 2013). It requires however more RAM than other tools (several tens of GB RAM). Sirén et al. (2021) also estimated that genotyping a sample took about 200 CPU-hours, and can also be efficiently parallelized. To summarize, although pangenomics still is at its infancy, and more complex than genomics, the computer science community is currently trying to build bridges in order to facilitate its adoption.
Finally, this paper only mentions the different use cases the authors have been confronted to so far. Without doubts, any improvement, tool, or implemented feature, will unlock new possibilities, and eventually new results, which will trigger new questions. We are far from having explored the wealth of pangenomics methods. It is not the intent of the authors to suggest that pangenomics will replace all previously designed methods, involving for instance SNPs and reference genome. We hope, however, that pangenomics may explain new molecular mechanisms, infer past ancestries, or, prospectively, open new paths for improving breeding of agronomic species. Interestingly, Cheng et al. (2025) suggested a new breeding strategy in order to get as close as possible to an ideal genotype of potato, based on pangenome studies. We believe that this is the future of pangenomics.
Table 1 – Recommendation of developments and standard for an improved exploitation of pangenome graphs.
Topic | What our community needs |
|---|---|
Diversity | A robust and standard method for assessing the diversity of a population, and suggesting individuals that would maximize it, given a budget. |
Graph quality | Guidelines for uniforming SV ambiguous representations in graphs. |
Graph quality | Metrics for quantifying the correctness of the graph with respect to the input genomes. |
Graph quality | Metrics for quantifying the succinctness or usability of a graph. |
Visualization | Indexing data structures and tools for a nucleotide-to-chromosome visualization. |
Augmentation | Optimized methods for long-read mapping to graphs. |
Annotation | A dedicated format for annotation in graphs. |
Annotation | Methods and tools for annotating complex features such as TEs. |
Annotation | Methods and tools for merging several annotations. |
Annotation | Methods for representing gene families. |
FAIR | Standard graph format with exhaustive information on graph construction. |
FAIR | Dedicated databases for graph storing and indexing. |
Manipulation | High-level, easy to use queries for sub-graph extraction. |
Population genetics | Methods for phylogeny inference, with traces of domestication or introgression. |
Dual | Methods for pairwise graph comparisons. |
Metagenomes | Methods for exploring and comparing meta-pangenomes. |
Genotyping | Improved methods for complex SV detection. |
Genotyping | File format for graph-based variations. |
Association studies | Methods and tools to perform GWAS on the graph. |
Omics | Methods for RNA-Seq, ChIP-Seq, etc. on graphs. |
Omics | Interval comparison from linear genomes to graphs. |
Acknowledgements
Preprint version 6 of this article has been peer-reviewed and recommended by Peer Community In Genomics (https://doi.org/10.24072/pci.genomics.100526; Campos–Dominguez, 2026).
Fundings
Several authors of this work have been founded by the “AgroDiv” project of the Agroecology and Digital Technologies research program and received government funding managed by the Agence Nationale de la Recherche under the France 2030 program, reference ANR-22-PEAE-0005.
Conflict of interest disclosure
The authors declare that they comply with the PCI rule of having no financial conflicts of interest in relation to the content of the article. François Sabot is a recommender for PCI Genomics.