

 CC-BY 4.0
Introduction
The global demographic landscape is changing dramatically, with the population of adults aged 65 years and older projected to double by 2050 (World Health Organization, 2025). However, this demographic shift is associated with numerous challenges, including socioeconomic and healthcare pressures such as increased costs of elderly care, strain on healthcare systems, and decline in the quality of life (Hong et al., 2023; Jones & Dolsten, 2024). Beyond the socioeconomic implications, aging is accompanied by complex physiological and psychological challenges that impair independence and health that vary among individuals. Progressive alterations occur in almost every organ system (Rémond et al., 2015). Body composition changes by the decline of the fat-free mass, especially skeletal muscle tissue, a condition known as sarcopenia, along with an increase in fat mass and its distribution (Genton et al., 2011). Cognitive function deteriorates, particularly with severe consequences such as dementia and Alzheimer’s disease (Anderton, 2002); gastrointestinal function is characterized by diminished sensory perceptions, salivation, oral health, nutrient absorption, and metabolism (Gariballa & Sinclair, 1998). In addition to these physical changes, psychological factors can influence their nutritional status. Depression, loneliness, and cognitive decline diminish interest in food and disrupt eating routines (Rémond et al., 2015). The combined physiological and psychological declines increase the likelihood of malnutrition and frailty, resulting in diminished autonomy and quality of life (Coelho-Junior et al., 2020; Mei et al., 2025). To partially counteract these risks, an increased daily protein intake is advised for these populations: 1.2 grams per kg of body weight per day (g/kg/d) for older adults and up to 1.5 g/kg/day in cases of chronic or acute disease (Nowson & O’Connell, 2015).
Not just the quantity but also the quality and distribution of protein intake matter (Layman, 2024). Consumption of the high-quality proteins rich in essential amino acids, particularly leucine, one of the branched-chain amino acids, is crucial for maintaining muscle mass in older adults (Kaspy et al., 2024; Serafini et al., 2019). The international guidelines recommend that a leucine intake of 3 g at three main meals together with 25–30 g of protein is the goal to be achieved to counteract loss of lean mass in elderly (Rondanelli et al., 2021). To mitigate age-related malnutrition and support independent living, several strategies exist. Home delivery meal service (HDM) is a program that supplies nutritionally balanced ready-to-eat meals directly to seniors’ homes. This service contributes to reducing the risk of malnutrition and enhances the protein intake in the elderly (Borkent et al., 2019; Rémond et al., 2015). In their systematic review, IJmker-Hemink et al. (2020) reported that home-delivered meal services effectively improved energy and protein intake in older adults by providing protein-enriched foods such as bread or snacks, and they also noted high recipient satisfaction. Protein fortification therefore appears to play a crucial role in helping meet the increased protein requirements of older people (Borkent et al., 2019). Beelen et al. (2017) further observed that older adults prefer consuming familiar foods without increasing portion size, making fortification of usual foods a suitable strategy to enhance protein intake while preserving existing eating habits. Soup is an ideal vehicle for nutritional enrichment due to its texture. In institutional or home-delivered meal programs, soups are routinely provided on a daily basis, and their smooth texture facilitates consumption in older adults who frequently experience chewing and swallowing difficulties (Kao et al., 2025; Sinchaipanit et al., 2023). Preserving the original texture of soups during enrichment is essential, as changes in viscosity or smoothness can decrease acceptance among elderly consumers. Since soups are typically consumed without chewing, enrichment must be carefully optimized to maintain a consistent, easily swallowable texture suited to their physiological needs (Geny et al., 2024).
Selecting appropriate protein sources for enrichment is essential, as dietary proteins differ in their nutritional, chemical, and biological attributes. Moreover, these ingredients must be readily available and suitable for incorporation into commonly consumed foods (Geny et al., 2024). Animal-derived proteins (from meat, dairy, and eggs), as well as alternatives like plant-based, and algal sources, all serve as dietary protein options (Lonnie et al., 2018). Animal proteins are generally regarded as complete, offering higher digestibility and a more optimal profile of essential amino acids (EAAs) compared to plant-based proteins (Day et al., 2022). Growing concerns over the health and environmental impacts of animal-based proteins have spurred interest in alternatives such as plant sources. Recent reviews emphasize that plant and other non-animal proteins not only reduce greenhouse gas emissions and resource use but also align with dietary patterns linked to health benefits, fostering a global shift away from traditional animal protein (Aiking & de Boer, 2020; Day et al., 2022). Thus, choosing suitable protein sources is critical to meet the specific nutritional needs of older adults. Combining different sources through supplementation can enhance overall nutritional quality, as plant-based proteins often lack certain essential amino acids vital for the elderly and may contain antinutritional factors like phytic acid (Day et al., 2022; Popova & Mihaylova, 2019).
This study selected five vegetable-based soups to represent diverse plant matrices relevant to traditional European diets. It aimed to evaluate the nutritional impact of enriching these soups with naturally protein-rich ingredients, both animal-derived and alternative sources, to enhance protein intake among elderly recipients of home-delivered meal services. Specifically, we assessed the effects of enrichment on protein content, and after static in-vitro digestion, on protein digestibility, amino acid bioaccessibility, and related nutritional parameters.
Material and methods
Preparation of soups and protein enrichment
Five vegetable-based soups were prepared using pumpkin (Cucurbita maxima), green lentils (Lens culinaris), canned chickpeas (Cicer arietinum L., Auchan, France), fresh white button mushrooms (Agaricus bisporus, La Ferme de la Gontière, France), and split peas (Pisum sativum, Priméal, France). Additional ingredients included potatoes, onions, organic cream 30% (Lait Plaisirs, France), and water. Protein enrichment was achieved using cooked ham, eggs (Bio Bonval, France), La Vache qui rit® processed cheese (Bel Group, Suresnes, France), La Vache qui rit® Formule Plus, and spirulina (100%, Spiruline Ventoux-Luberon, France) as an alternative protein source. The two cheese-based enrichments corresponded to distinct commercial products: La Vache qui rit® processed cheese was used as the standard processed cheese enrichment, whereas La Vache qui rit® Formule Plus was used as a fortified processed cheese designed for foodservice applications and specifically intended to improve the nutritional profile of dishes for older adults. According to the manufacturer’s product information, La Vache qui rit® Formule Plus is a processed cheese speciality containing rehydrated skimmed milk, cheeses, butter, milk proteins, calcium, polyphosphates, citric acid, and vitamin D. Per 100 g, it provides 177 kcal, 12 g protein, 13 g fat, 3 g carbohydrates, 1.7 g salt, 1240 mg calcium, and 12.5 µg vitamin D. The product is described as suitable for soups, purées, and desserts, with a fluid texture intended to provide binding and smoothness in whole or texture-modified preparations for older adults. All soups were prepared following recipes developed by a professional chef at the Central Kitchen of Ambert, France. The details of the soups and enrichments are presented in supplementary Table S1 and S2. Ingredients were combined and cooked according to each recipe, then blended with an electric mixer (Moulinex, France) to obtain a smooth, homogeneous texture. After cooking, soups were rapidly cooled from above 70 °C to approximately +4 °C within 20 min using a blast chiller (Model MX30ATS7, Friginox, Villevallier, France). Each soup was divided into five 200 mL portions: one as control and four enriched samples. To ensure comparability among matrices, the same quantities of each enrichment ingredient were incorporated into all soups. All enrichments were thoroughly mixed to ensure full homogenization of the texture. In total, 25 soup samples were obtained and stored at −20 °C until further analysis.
Dry matter content and sample freeze-drying
Dry matter content of the soups was determined according to ISO 12880:2000 standard protocol (International Organization for Standardization, 2000). Samples were oven-dried (Thermo Scientific, Waltham, MA, USA) at 105 °C until constant weight (16 h) using aluminum crucibles. The results are expressed as percentage dry matter, as the ratio of the weight of the sample after drying to the initial weight of the sample, multiplied by 100.
For subsequent analyses, 10 g aliquots of each soup were freeze-dried using a laboratory freeze dryer (Alpha 1-2 LDplus, Martin Christ, Germany) for 42 h until complete moisture removal. The lyophilized samples were then ground into a fine powder, placed in airtight containers, and stored at −4 °C until further analyses.
Determination of the protein content
Total nitrogen content of the soups was determined using the Kjeldahl method (Latimer, 2023). A reagent blank was analyzed under identical conditions. Total protein was obtained by applying a nitrogen-to-protein conversion factor of 5.75, which was selected because the soups were predominantly based on vegetable matrices (Mariotti et al., 2008). The same conversion factor was consistently applied to all control and enriched samples to ensure comparability among the different enrichment strategies. To ensure comparability among recipes, protein contents were calculated on a dry matter basis. The dry matter values used for this normalization are provided in Supplementary Table S3.
Lipid oxidation determination
Lipid oxidation in the samples was assessed by quantifying thiobarbituric acid reactive substances (TBARS), expressed as malondialdehyde (MDA) equivalents, as described by Lynch and Frei (Lynch & Frei, 1993). Briefly, 1 g of homogenized soup was diluted (1:5, v/v) with distilled water, and 200 µL of the mixture was reacted with 600 µL of 0.07 M thiobarbituric acid solution in glacial acetic acid/Milli-Q water (30:70, v/v). Samples were heated at 95 °C for 60 min, cooled, and absorbance was measured at 532 nm (corrected by A₇₆₀) using a microplate spectrophotometer (Multiskan Spectrum, Thermo Fisher Scientific, USA). MDA concentrations were calculated from a calibration curve (0–120 µM) prepared with 1,1,3,3-tetraethoxypropane (TEP) and expressed as µmol MDA g⁻¹ soup.
Free Iron
Free iron concentration was quantified using a colorimetric ferrozine assay (Stolze et al., 1996). Freeze-dried soup samples (0.6 g) were extracted with 7.4 mL of citrate–NaCl buffer (140 mM NaCl, 10 mM trisodium citrate). The mixture was homogenized and ultrafiltered through Vivaspin 15 centrifugal filters (5000 Da cut-off, Sartorius, Germany) at 4400 rpm for 4 h at 20 °C. Aliquots of the ultrafiltrate (300 µL) were incubated with 30 µL of L-ascorbate solution (100 mM) and by the addition of 30 µL of ferrozine reagent (10 mM). The reaction was developed in the dark for 15 min, and absorbance was measured at 562 nm using a 96-well microplate spectrophotometer (Thermo Fisher Scientific, Waltham, MA, USA). Iron concentrations were calculated from a calibration curve prepared with FeSO₄·7H₂O standards in citrate–NaCl buffer after blank subtraction, applying the corresponding dilution factor when necessary. As all measurements were performed in the presence of ascorbate, the results represent the total free iron fraction.
Phytic Acid Assay
Phytic acid (PA) was measured using a kit from Megazyme (K-PHYT, Megazyme, Neogen Corporation, Lansing, MI, USA). Briefly, 500 mg freeze-dried sample was extracted with 10 mL of 0.66 M hydrochloric acid and stirred overnight. After centrifugation, 0.5 mL of the supernatant was neutralized with 0.5 mL of 0.75 M NaOH. Two aliquots (50 µL each) of the neutralized extract were used for the determination of free and total phosphorus. Free phosphorus was measured using the assay buffer without enzyme addition, while total phosphorus was determined after sequential enzymatic hydrolysis with phytase and alkaline phosphatase at 40 °C. Released inorganic phosphate reacted with ammonium molybdate under acidic conditions to form molybdenum blue, and absorbance was measured at 655 nm using a spectrophotometer (Model V-770; JASCO, Easton, MD, USA). Phytic acid content was calculated from the difference between total and free phosphorus values, assuming phosphorus represents 28.2% of phytic acid. Results were expressed as phytic acid equivalents (mg/100 g of sample).
in-vitro static digestion model
The in-vitro static digestion of soup samples was conducted according to the INFOGEST protocol (Brodkorb et al., 2019), with specific adaptations for elderly digestion (Menard et al., 2023). Before starting the digestion procedure, simulated gastric fluid (6.9 mL KCl (0.5 M), 0.9 mL KH₂PO₄ (0.5 M), 12.5 mL NaHCO₃ (1 M), 11.8 mL NaCl (2 M), 0.4 mL MgCl₂·6H₂O (0.15 M), 0.5 mL (NH₄)₂CO₃ (0.5 M), 1.3 mL HCl (6 M), and 365.7 mL ultra-pure water), and simulated intestinal fluid (6.8 mL KCl (0.5 M), 0.8 mL KH₂PO₄ (0.5 M), 42.5 mL NaHCO₃ (1 M), 9.6 mL NaCl (2 M), 1.1 mL MgCl₂·6H₂O (0.15 M), 0.7 mL HCl (6 M), and 338.5 mL ultra-pure water) were freshly prepared, stored at 4 °C, and preheated to 37 °C in a water bath prior to use. Enzyme solutions were freshly prepared before each digestion to maintain enzymatic activity. For every ten samples, pepsin solution was prepared by dissolving 48 mg of pepsin from porcine gastric mucosa (3200 U/mg; Sigma-Aldrich, St. Louis, MO, USA) in 4 mL of distilled water, yielding 1200 U/mL of gastric content (using haemoglobin as substrate). Lipase solution was prepared by dissolving 72 mg of Amano Lipase A from Aspergillus niger (1200 U/mg; Aldrich, St. Louis, MO, USA) in 2.88 mL of distilled water. The amount of lipase added to each digestion was selected according to the adapted INFOGEST protocol for elderly digestion to provide a final gastric lipase activity of 36 U/mL of gastric content (using tributyrin as substrate). For the intestinal phase, pancreatin from porcine pancreas (8× USP; Sigma-Aldrich, St. Louis, MO, USA) was prepared by dissolving 2.666 g in 25 mL of simulated intestinal fluid (SIF). The amount of pancreatin added to each digestion was selected according to the adapted INFOGEST protocol for elderly digestion to provide a final trypsin activity of 80 U/mL in the intestinal phase, expressed as TAME units using Nα-p-tosyl-L-arginine methyl ester as substrate (Brodkorb et al., 2019; Menard et al., 2023). Bile salts mixture (Sigma-Aldrich, St. Louis, MO, USA) was prepared by dissolving 2.01 g of bile salt (0.666 mmol/g) in 15 mL of SIF, resulting in a final concentration of 6.7 mM. Additionally, a 50% (w/v) trichloroacetic acid (TCA) solution was prepared by dissolving 50 g of TCA in 100 mL of distilled water for protein precipitation. To terminate enzymatic activity after digestion, a 500 mM Pefabloc SC solution (Sigma-Aldrich, St. Louis, MO, USA) was prepared by dissolving 120 mg in 1 mL of distilled water.
Digestion blanks containing all digestive fluids and enzymes, but no food sample, were prepared and processed in parallel with the soup samples to account for the contribution of digestive enzymes and digestive fluids to the measured nitrogen and peptide contents. As no oral phase was included for the soup samples, the blanks were subjected to the same gastric and intestinal digestion steps as the samples. Blank digestions were prepared according to the corresponding digestion conditions, including the pH-adjustment conditions used for the soups. The measured blank values were subtracted from total protein, trichloroacetic acid (TCA)-soluble peptide, and phosphotungstic acid (PTA)-soluble peptide values after applying the appropriate dilution factors. No oral phase was included in the digestion procedure, as the soup samples were liquid and did not require mechanical or enzymatic disintegration typically simulated in the oral phase (Minekus et al., 2014).
Prior to the gastric phase, the initial pH of control soup samples was measured to determine the required volumes of hydrochloric acid (HCl, 6 M) and sodium hydroxide (NaOH, 1 M) for achieving the target pH values. SGF and calcium chloride (CaCl₂, 0.3 M) were added to each sample, and the mixture pH was monitored using a pH meter (Model No. 009023004; Ingold, Mettler-Toledo, Switzerland) and adjusted to 3.7, reflecting the recommended value for elderly digestion (Menard et al., 2023). Subsequently, 5 mL of each sample was combined with 4 mL SGF, 2.5 µL CaCl₂, 40 µL HCl, 384 µL water, 333.5 µL freshly prepared pepsin solution and 240 µL lipase solution (both kept on ice) at room temperature. A fixed volume of soup sample, 5 mL, was used for all soups. This aliquot represented a scaled-down portion of a standard 250 mL soup serving, while preserving the ingredient proportions of the complete formulation. Because the enrichment strategies modified the protein content of the soups, this approach resulted in different enzyme-to-protein ratios among samples. The experimental design was therefore based on a fixed food-volume comparison rather than on digestion of equivalent protein loads. The mixture was vortexed thoroughly and incubated at 37 °C for 3 h using a shaking Incubator (Model NB-205L; N-Biotek Co., South Korea) at 300 rpm. For lentil soup samples, the volumes of HCl and water were adjusted to 60 µL and 364 µL, respectively.
At the end of the gastric phase, intestinal digestion was initiated by adding 4 mL SIF, 20 µL CaCl₂, 1980 µL water, 2.5 mL pancreatin solution, and 1.5 mL bile solution to each tube. For lentil soup samples, 20 µL NaOH (1 M) and 1960 µL water were used instead of 1980 µL water to reach the target intestinal pH of 7.0. The mixture was vortexed and incubated at 37 °C for 2 h using a shaking Incubator at 300 rpm. Immediately after incubation, digested samples were placed on ice, and 20 µL of Pefabloc was added to each tube to inhibit enzymatic activity. Samples were vortexed thoroughly to ensure homogeneity.
Nitrogen content in digesta
Total Nitrogen
After the in-vitro static digestion, the same procedure described in section 2.3 was applied to determine total nitrogen in the digested samples.
TCA-Soluble Nitrogen (TCA-SN)
4 mL aliquot of digesta was mixed with 1.33 mL of TCA (48%) while vortexing and left for 30 min at room temperature. Under these conditions, proteins are precipitated, whereas large peptides until approximately 5–10kDa remain in the soluble fraction (Yvon et al., 1989). Samples were centrifuged at 4000 rpm for 15 min at 4 °C, and the supernatant was analyzed for nitrogen content using the Kjeldahl method (Latimer, 2023). The amount of TCA-soluble peptides was expressed as protein equivalent, and the same calculation formulas used for total protein determination were applied.
PTA-Soluble Nitrogen (PTA-SN)
3 g of digesta was mixed with 2.1 mL of 3.95 M H₂SO₄ and 0.9 mL of phosphotungstic acid (PTA) solution (33%) gently added while vortexing, vortexed, and incubated overnight at 4 °C. PTA precipitation retains larger peptides, whereas peptides containing fewer than approximately 6-7 amino acid residues remain in the soluble fraction (Bouton & Grappin, 1994; Rohm et al., 1994). After centrifugation (4000 rpm, 20 min, 4 °C), the supernatant was analyzed for nitrogen content using the Kjeldahl method as described in Section 2.3. Titration was performed using 0.01 N HCl. The PTA-soluble peptides were calculated as protein equivalents using the same formulas.
For total protein, TCA-soluble peptides, and PTA-soluble peptides, results were corrected by subtracting the corresponding digestion blank values after applying the appropriate dilution factors. The corrected nitrogen contents were converted into protein equivalents using the Kjeldahl conversion factor described above. TCA- and PTA-soluble fractions were therefore reported as blank-corrected protein-equivalent contents in the digesta. These values were used as indicators of apparent protein hydrolysis and peptide solubilization after in-vitro digestion.
Amino acid profiling
Free amino acids in the aqueous phase of the digested soup samples were quantified by high-performance liquid chromatography (HPLC) using the AccQ•Tag™ Ultra method (Waters Corporation, Milford, MA, USA), adapted from the manufacturer’s protocol and the internal laboratory procedure. Protein precipitation and removal of high-molecular-weight compounds were achieved by mixing 700 µL of digested sample with 300 µL of 50% (w/v) trichloroacetic acid (TCA) in 1.5 mL Eppendorf tubes kept on ice. The mixtures were briefly vortexed and centrifuged (Model Allegra X-15R, Rotor ID 5.3; Beckman Coulter, Brea, CA, USA) at 10,000 rpm for 30 min at 4 °C. Supernatants were collected and stored at −80 °C until analysis.
For calibration, the commercial amino acid standard mixture was supplemented with L-glutamine, L-asparagine, and L-tryptophan, which were not included in the original kit standard. Individual stock solutions of these three amino acids were prepared at 10 mmol/L in 2.5 mmol/L HCl. A mixed stock solution containing glutamine, asparagine, and tryptophan was then prepared and combined with the commercial amino acid standard to obtain a 20-amino-acid calibration mixture. Working calibration solutions were prepared by serial dilution over the range of 1.25–1250 µmol/L. The internal standard 2-aminobutyric acid (AABA) was prepared separately at 10 mmol/L in 2.5 mmol/L HCl, filtered through a 0.45 µm PVDF filter, aliquoted, and stored at −20 °C until use. Before derivatization, the AABA stock solution was diluted to 1 mmol/L, and 20 µL of this solution was added to 1480 µL of borate buffer, giving an AABA concentration of 13.3 µmol/L in the borate buffer. This AABA-containing borate buffer was used for both standards and samples to normalize amino acid peak areas and compensate for analytical variability during derivatization, HPLC injection, and quantification.
Derivatization was carried out using the AccQ•Tag™ Ultra derivatization kit (Waters). For each sample or calibration standard, 10 µL of supernatant or standard solution was mixed with 70 µL of borate buffer containing AABA, followed by 20 µL of freshly prepared AccQ•Tag derivatization reagent. The mixture was vortexed and incubated in a dry block heater (IKA® Block Heater, IKA-Werke GmbH, Staufen, Germany) at 55 °C for 8 min. HPLC analysis was performed on a Waters Acquity Arc system equipped with an XBridge® C18 column (3.5 µm, 3.0 × 150 mm; Waters) and a 2998 photodiode array detector. Amino acids were detected at 260 nm to simplify signal processing and minimize overlap compared with fluorescence detection. Amino acid identification was based on retention time comparison with derivatized standards. Quantification was performed using calibration curves constructed from the ratio of each amino acid peak area to the AABA peak area. Results were expressed as µmol/L of free amino acids in the aqueous phase of digested samples.
Statistical analysis
Data were analyzed using Jamovi software (The Jamovi Project, Sydney, Australia). Results are presented as mean ± standard deviation. One-way analysis of variance (ANOVA) was performed, and significant differences were identified using Tukey’s Honest Significant Difference (HSD) post hoc test (p < 0.05). Principal component analysis (PCA) was performed in Jamovi to explore multivariate relationships among biochemical variables in digesta. The PCA results were visualized as biplots illustrating sample distribution by enrichment type and variable loadings, with 95% confidence ellipses representing group variability.
Results
Impact of enrichment on the soup composition
Protein enrichment was observed across all soups following the addition of the selected ingredient (Figure 1). Because protein content in the soups was determined from one replicate per soup, due to limited sample availability, these values were used to describe the magnitude of enrichment and were not subjected to statistical analysis. The magnitude of protein enhancement appeared to depend on both the soup matrix and the enrichment strategy. Among the tested enrichments, Ham & La Vache qui rit® consistently produced the greatest increase in protein content relative to the corresponding control soups. Pumpkin soup exhibited the largest relative increase (approximately 3.2-fold), whereas lentil soup showed the smallest proportional increase due to its higher initial protein content. Thus, although the same enrichment ingredients were added to the different soup bases, the final protein values reflected the composition of the whole prepared soup, including the initial protein and dry matter content of each matrix.
Free iron concentrations differed significantly among enrichment strategies across all soup matrices (p < 0.001) (Table 1). Spirulina-enriched soups consistently exhibited the highest free iron concentrations, with the highest value observed in pumpkin soup (333 ± 0.8 µM). Yolk-enriched samples showed the next highest free iron levels across matrices. By contrast, Ham & La Vache qui rit® and La Vache qui rit® Formule Plus enrichments resulted in lower free iron concentrations relative to the other enrichment types. Among the soup bases, lentil soups displayed the lowest free iron concentrations overall, regardless of the enrichment strategy.
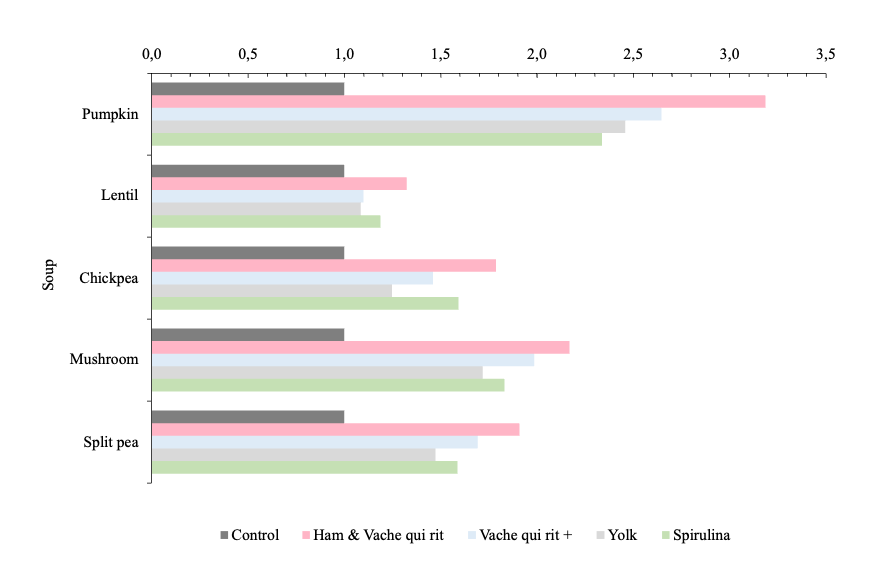
Figure 1 - Fold-increase in protein content of enriched soups relative to the corresponding control soup. Values are expressed on a dry matter basis. Due to limited sample availability, protein content in the undigested soups was determined from one replicate per formulation; therefore, the fold-increase values are presented descriptively and were not subjected to statistical analysis.
Phytic acid concentrations differed significantly among enrichment strategies and soup matrices (p < 0.001). Lentil-based soups showed the highest phytic acid levels, followed by split pea soups, whereas pumpkin and chickpea soups contained lower amounts. Lipid oxidation, expressed as malondialdehyde (MDA) concentration, also varied significantly across enrichment strategies in all matrices (p < 0.001). Enriched soups consistently showed higher MDA values than the corresponding controls. The highest MDA concentrations were observed in Spirulina- and Yolk-enriched samples, followed by those enriched with Ham & La Vache qui rit® and La Vache qui rit® Formule Plus. Among the control soups, lentil soup exhibited the highest MDA value.
Protein, Peptide, and Amino Acid Profiles after in-vitro Digestion
The protein-equivalent nitrogen fractions measured after in-vitro digestion are summarized in Table 2. The blank-corrected total protein-equivalent content in the digesta was significantly higher in all enriched soups compared with the corresponding controls (Lentil soup: p = 0.002; all others: p < 0.001). The concentration of TCA-soluble fractions was also significantly elevated in all enriched samples compared with their controls (p < 0.001 for all recipes). Similarly, PTA-soluble peptides were significantly higher in all enriched soups with statistical significance varying by recipe (p = 0.019 to < 0.001). The proportion of non-digested protein after in-vitro digestion was significantly higher than the control only in split pea soup (p = 0.017). In the other matrices, no significant differences were observed (p > 0.05).
Table 1 - Chemical Composition of the soups.
| Soup | Control | Ham & Vache | Vache + | Yolk | Spirulina | P value |
|---|---|---|---|---|---|---|---|
Free Iron (µM) | Pumpkin | 109 ± 0.8a | 55.9 ± 0.9b | 33.3 ± 0.5c | 90.5 ± 0.9d | 333 ± 0.8e | < 0.001 |
Lentil | 11.8 ± 1.6a | 62.3 ± 0.7b | 18.9 ± 0.6c | 34 ± 0.3d | 18.4 ± 1.1c | < 0.001 | |
Chickpea | 143 ± 14.9a | 75.9 ± 0.7b | 44.5 ± 9.7c | 88.1 ± 6.5b | 195 ± 0.9d | < 0.001 | |
Mushroom | 23.1 ± 1.4a | 28.5 ± 0.4b | 13.4 ± 2.4c | 94.1 ± 0.4d | 200 ± 0.7e | < 0.001 | |
Split pea | 42.4 ± 1.7a | 58.9 ± 0.2b | 43.5 ± 1.2a | 136 ± 0.3c | 223 ± 2.6d | < 0.001 | |
Phytic acid (mg/100 g) | Pumpkin | 15.1 ± 2.5a | 26.1 ± 2.4b | 36.8 ± 0.9c | 18.2 ± 0.8a | 27.5 ± 1.1c | < 0.001 |
Lentil | 144 ± 4.2a | 170 ± 5.6b | 142 ± 6.1c | 216 ± 20a | 180 ± 2.2ab | < 0.001 | |
Chickpea | 15.6 ± 0.9a | 54.1 ± 2.8b | 28.1 ± 2.3b | 24.5 ± 3.1c | 36.1 ± 3.1d | < 0.001 | |
Mushroom | 26.5 ± 3.4a | 62.6 ± 3.1b | 28.6 ± 4.1b | 25.1 ± 0.6c | 46.5 ± 5.5b | < 0.001 | |
Split pea | 47.1 ± 2.1a | 70 ± 7.4b | 88.6 ± 0.6c | 42.1 ± 0.5d | 54 ± 4.1cd | < 0.001 | |
MDA (µmol/g) | Pumpkin | 11.9 ± 0.1a | 24.1 ± 0.1ᵇ | 23.2 ± 0.3ᵇ | 55.4 ± 1.7c | 49.5 ± 2.3d | < 0.001 |
Lentil | 34.7 ± 0.8a | 42.0 ± 0.8ᵇ | 40.3 ± 1.4ᵇ | 51.7 ± 0.5c | 80.9 ± 0.9d | < 0.001 | |
Chickpea | 5.9 ± 0.1a | 25.6 ± 0.2b | 27.8 ± 0.7c | 52.5 ± 0.7d | 53.1 ± 0.5d | < 0.001 | |
Mushroom | 6.2 ± 1.1a | 24.1 ± 3.2ᵇ | 32.3 ± 0.9c | 79.2 ± 1.3d | 51.6 ± 1.1e | < 0.001 | |
Split pea | 6.7 ± 0.4a | 23.7 ± 1.1ᵇ | 37.7 ± 0.6c | 80.4 ± 1.7d | 61.8 ± 3.2e | < 0.001 |
Note: Values are expressed as mean ± standard deviation (n = 3). Different superscript letters within a row indicate significant differences among enrichments (Tukey’s HSD, p < 0.05). MDA signifies malondialdehyde. Vache and Vache+ correspond to La Vache qui rit and La Vache qui rit Plus, respectively.
Following in-vitro digestion, the concentrations of bioaccessible essential amino acids (EAAs), as well as the sums of EAAs and non-essential amino acids (NEAAs), are presented in Table 3. Significant increases in specific EAAs were observed within certain soups. Split pea and mushroom soups showed more pronounced enrichment-related differences, whereas chickpea, lentil, and pumpkin soups exhibited fewer or no significant changes. A Principal Component Analysis (PCA) was performed on remaining total protein, peptides release, and EAAs measured after in-vitro digestion (Figure 2). The PCA revealed two main clustering patterns. Yolk and spirulina samples grouped closer to the vectors for branched-chain amino acids (valine and isoleucine), threonine, and histidine, while Ham & La Vache qui rit® and La Vache qui rit + clustered together associated with higher total protein, TCA- and PTA-soluble peptides, and lysine. Control samples were grouped separately from the enriched soups, with lower association to the variable vectors, indicating lower values for most measured parameters.
Bioaccessible free iron
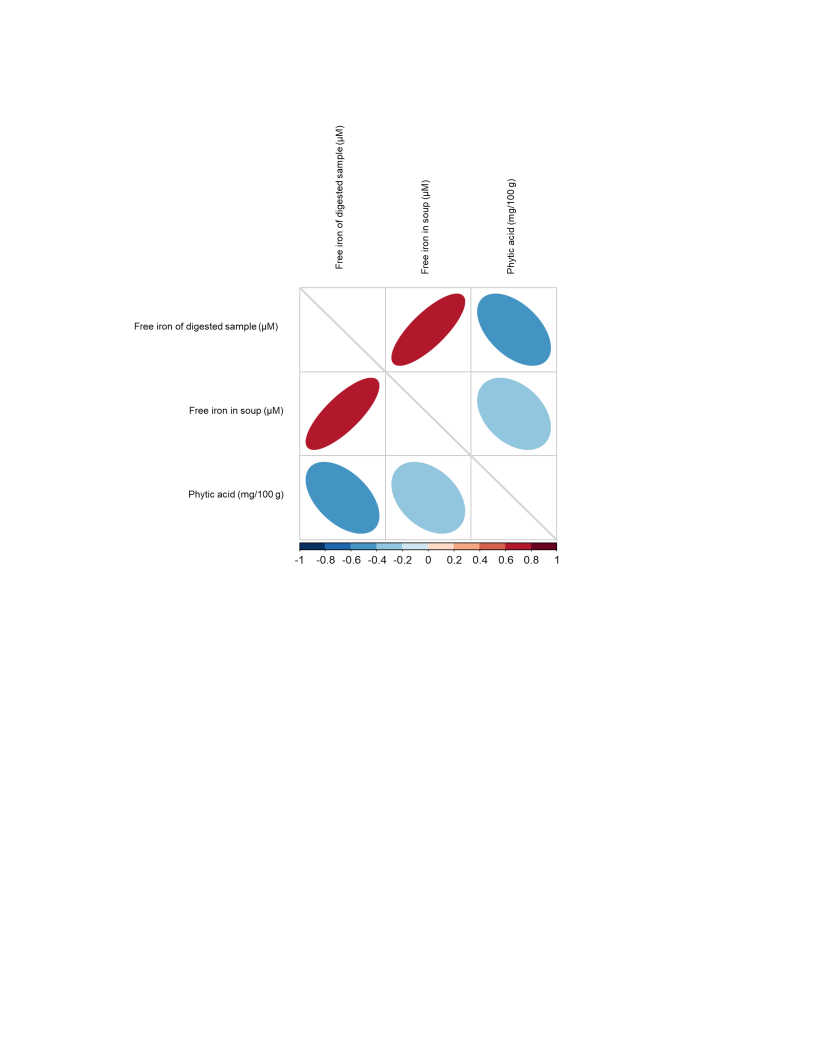
Free iron levels in the soups after in-vitro digestion are presented in Table 4. Across all matrices, enrichment significantly increased the concentration of bioaccessible free iron measured in digested samples compared with the corresponding control (pumpkin, chickpea, mushroom, and split pea: p < 0.001; lentil: p = 0.009). Additionally, among the enrichment strategies, spirulina consistently yielded the highest bioaccessible free iron values within each soup matrix, with concentrations ranging from 14.8 ± 0.5 µM in digested lentil soup, to 158 ± 1.4 µM in digested chickpea soup. In contrast, lentil digesta exhibited the lowest free iron concentrations overall, both in the control and enriched samples. Pearson correlation analysis was conducted to assess the associations among free iron in soups, free iron in digested soups, and phytic acid content in soups (Figure 3). The Pearson correlation matrix indicated a strong positive association between free iron in soup and free iron in digested samples (r = 0.783, p < 0.001). Phytic acid content showed a significant moderate negative correlation with free iron in digested samples (r = −0.506, p < 0.01), and a weaker, non-significant negative correlation with free iron in soup (r = −0.379, p = 0.062). These results show that higher iron release in soups is linked to higher release after digestion, while higher phytate levels are linked to lower bioaccessible free iron. The full correlation coefficients and p-values are provided in Supplementary Table S4.
Table 2 - Protein and peptide fractions in the digesta after 5 h of in-vitro digestion.
Variable | Recipe | Control | Ham & Vache | Spirulina | Vache + | Yolk | P value |
|---|---|---|---|---|---|---|---|
Total protein (g protein /100 g digesta) | Chickpea | 0.99 ± 0.01ᵃ | 1.61 ± 0.02ᵇ | 1.29 ± 0.02ᶜ | 1.46 ± 0.03ᵈ | 1.26 ± 0.04ᶜ | < 0.001 |
Lentil | 1.43 ± 0.09ᵃ | 2.13 ± 0.05ᵇ | 1.75 ± 0.07ᶜ | 1.95 ± 0.09ᵇᶜ | 1.77 ± 0.11ᶜ | 0.002 | |
Mushroom | 0.92 ± 0.01ᵃ | 1.65 ± 0.07ᵇ | 1.18 ± 0.05ᶜ | 1.36 ± 0.09ᶜ | 1.36 ± 0.09ᶜ | < 0.001 | |
Pumpkin | 0.86 ± 0.01ᵃ | 1.46 ± 0.06ᵇ | 1.08 ± 0.05ᶜ | 1.41 ± 0.13ᵇ | 1.19 ± 0.04ᶜ | < 0.001 | |
Split pea | 1.05 ± 0.03ᵃ | 1.69 ± 0.03ᵇ | 1.31 ± 0.04ᶜ | 1.51 ± 0.04ᵈ | 1.40 ± 0.03ᶜ | < 0.001 | |
TCA-soluble peptides (g protein-equivalent/100 g digesta) | Chickpea | 0.69 ± 0.03ᵃ | 1.19 ± 0.03ᵇ | 0.89 ± 0.02ᶜ | 1.00 ± 0.03ᵈ | 0.87 ± 0.02ᶜ | < 0.001 |
Lentil | 0.99 ± 0.04ᵃ | 1.55 ± 0.02ᵇ | 1.20 ± 0.06ᶜ | 1.34 ± 0.04ᵈ | 1.26 ± 0.03cd | < 0.001 | |
Mushroom | 0.99 ± 0.04ᵃ | 1.54 ± 0.02ᵇ | 1.20 ± 0.06ᶜ | 1.34 ± 0.04ᵈ | 1.26 ± 0.03e | < 0.001 | |
Pumpkin | 0.67 ± 0.06ᵃ | 1.08 ± 0.02ᵇ | 0.80 ± 0.03ᶜ | 0.96 ± 0.04ᵈ | 0.87 ± 0.05cd | < 0.001 | |
Split pea | 0.78 ± 0.02ᵃ | 1.23 ± 0.05ᵇ | 0.96 ± 0.02ᶜ | 1.13 ± 0.05ᵈ | 1.03 ± 0.01ᶜ | < 0.001 | |
PTA-soluble peptides (g protein-equivalent/100 g digesta) | Chickpea | 0.29 ± 0.02ᵃ | 0.43 ± 0.03ᵇ | 0.38 ± 0.01ᵇ | 0.38 ± 0.01ᵇ | 0.38 ± 0.01ᵇ | 0.019 |
Lentil | 0.41 ± 0.02ᵃ | 0.57 ± 0.03ᵇ | 0.49 ± 0.03ab | 0.45 ± 0.02ᵃ | 0.50 ± 0.04ᵇ | 0.022 | |
Mushroom | 0.30 ± 0.01ᵃ | 0.47 ± 0.00ᵇ | 0.38 ± 0.01cd | 0.37 ± 0.01ᶜ | 0.39 ± 0.02ᵈ | < 0.001 | |
Pumpkin | 0.27 ± 0.00ᵃ | 0.38 ± 0.01ᵇ | 0.33 ± 0.03ab | 0.34 ± 0.03ab | 0.35 ± 0.03ᵇ | < 0.001 | |
Split pea | 0.32 ± 0.01ᵃ | 0.46 ± 0.02ᵇ | 0.41 ± 0.01ᶜ | 0.41 ± 0.02ᶜ | 0.43 ± 0.03ᵇᶜ | < 0.001 | |
Non-digested protein (g protein-equivalent/100 g digesta) | Chickpea | 0.31 ± 0.04 | 0.42 ± 0.02 | 0.40 ± 0.01 | 0.45 ± 0.03 | 0.39 ± 0.04 | 0.059 |
Lentil | 0.44 ± 0.07 | 0.59 ± 0.05 | 0.55 ± 0.12 | 0.61 ± 0.06 | 0.51 ± 0.09 | 0.211 | |
Mushroom | 0.27 ± 0.04 | 0.48 ± 0.07 | 0.35 ± 0.07 | 0.36 ± 0.15 | 0.44 ± 0.08 | 0.068 | |
Pumpkin | 0.20 ± 0.06 | 0.38 ± 0.06 | 0.28 ± 0.04 | 0.45 ± 0.17 | 0.31 ± 0.05 | 0.112 | |
Split pea | 0.27 ± 0.03ᵃ | 0.45 ± 0.03b | 0.34 ± 0.04ab | 0.38 ± 0.09ab | 0.37 ± 0.02ab | 0.017 |
Note: Values are expressed as mean ± standard deviation (n = 3). Total protein, trichloroacetic acid (TCA)-soluble fractions, and phosphotungstic acid (PTA)-soluble fractions were measured in digesta by the Kjeldahl method and expressed as blank-corrected protein-equivalent contents per 100 g of digesta after applying the appropriate dilution factors and nitrogen-to-protein conversion factor. Digestion blanks containing digestive fluids and enzymes, but no food sample, were processed in parallel and subtracted from sample values. TCA-soluble fractions correspond to nitrogen compounds remaining soluble after trichloroacetic acid precipitation, including peptides and free amino acids, while PTA-soluble fractions mainly represent smaller peptides and free amino acids. These fractions were used as indicators of apparent protein hydrolysis and peptide solubilization after in-vitro digestion. Different superscript letters within the same row indicate significant differences between enrichment types (p < 0.05).
Table 3 - Free essential amino acids in the digested soups
Variable | Recipe | Control | Ham & Vache | Spirulina | Vache + | Yolk | P value |
|---|---|---|---|---|---|---|---|
Threonine (µM) | Chickpea | 913 ± 123 | 841 ± 75 | 1022 ± 35 | 779 ± 100 | 931 ± 311 | 0.068 |
Lentil | 838 ± 150 | 816 ± 99 | 913 ± 149 | 644 ± 96 | 1281 ± 235 | 0.082 | |
Mushroom | 829 ± 42ᵃ | 901 ± 82ᵃᵇ | 1070 ± 148ᵇ | 792 ± 73ᵃᵇ | 1069 ± 24ᵇ | 0.005 | |
Pumpkin | 611 ± 59 | 756 ± 136 | 738 ± 51 | 806 ± 162 | 767 ± 72 | 0.206 | |
Split pea | 881 ± 102ᵃ | 961 ± 58ᵃᵇ | 1016 ± 43ab | 755 ± 44ᵃ | 1149 ± 58ᶜ | 0.004 | |
Lysine (µM) | Chickpea | 2382 ± 276ᵃ | 3809 ± 257ᵇ | 2710 ± 222ᵃ | 2992 ± 119ᵃ | 2554 ± 696ᵃ | 0.02 |
Lentil | 3020 ± 641 | 4926 ± 452 | 3258 ± 750 | 3650 ± 326 | 4293 ± 801 | 0.067 | |
Mushroom | 2114 ± 143ᵃ | 3967 ± 408ᵇ | 2587 ± 259ᵃᶜ | 3120 ± 245ᶜ | 2847 ± 43ᶜ | 0.007 | |
Pumpkin | 2024 ± 240a | 3595 ± 810b | 2138 ± 288a | 3386 ± 469b | 2568 ± 230ab | 0.046 | |
Split pea | 2770 ± 318ᵃ | 4311 ± 228ᵇ | 2889 ± 107ᵃ | 3293 ± 212ᵃ | 3312 ± 238ᵃ | 0.004 | |
Leucine (µM) | Chickpea | 1725 ± 260 | 2376 ± 178 | 2315 ± 28 | 2088 ± 117 | 1998 ± 602 | 0.083 |
Lentil | 2163 ± 335 | 2663 ± 328 | 2684 ± 440 | 2134 ± 251 | 3353 ± 607 | 0.151 | |
Mushroom | 1339 ± 56ᵃ | 2393 ± 223ᵇ | 2144 ± 258ᵇ | 2098 ± 199ᵇ | 2231 ± 46ᵇ | <0.001 | |
Pumpkin | 1154 ± 103ᵃ | 2034 ± 329ᵇ | 1650 ± 94ᵃᵇ | 2149 ± 304ᵇ | 1784 ± 93ᵇ | 0.006 | |
Split pea | 1835 ± 204ᵃ | 2782 ± 167ᵇᶜ | 2426 ± 87ᶜ | 2200 ± 69ᵇ | 2625 ± 145ᶜ | 0.011 | |
Histidine (µM) | Chickpea | 269 ± 23 | 337 ± 55 | 292 ± 19 | 316 ± 61 | 315 ± 33 | 0.413 |
Lentil | 422 ± 64 | 424 ± 57 | 396 ± 58 | 310 ± 44 | 560 ± 90 | 0.082 | |
Mushroom | 409 ± 43 | 364 ± 25 | 397 ± 16 | 337 ± 62 | 383 ± 139 | 0.437 | |
Pumpkin | 372 ± 22ᵃ | 393 ± 30ᵃ | 409 ± 61ᵃ | 327 ± 30ᵃᵇ | 437 ± 4ᵃ | 0.016 | |
Split pea | 382 ± 37ᵃ | 434 ± 30ᵃ | 394 ± 4ᵃ | 300 ± 6ᵇ | 465 ± 21ᶜ | <0.001 | |
Methionine (µM) | Chickpea | 374 ± 49ᵃ | 537 ± 37b | 430 ± 51b | 367 ± 32b | 428 ± 185b | 0.028 |
Lentil | 313 ± 92ᵃ | 583 ± 82ᵇ | 304 ± 77ᵃ | 389 ± 5ᵃ | 596 ± 30ᵇ | 0.003 | |
Mushroom | 315 ± 82ᵃ | 586 ± 46ᵇ | 351 ± 69ᵃ | 422 ± 65ᵃᵇ | 508 ± 71ᵇ | 0.026 | |
Pumpkin | 295 ± 58 | 557 ± 192 | 351 ± 57 | 428 ± 85 | 408 ± 32 | 0.201 | |
Split pea | 381 ± 80ᵃ | 558 ± 18ᵇ | 458 ± 6ᵃᵇ | 416 ± 61ᵃ | 560 ± 28ᵇ | 0.005 | |
Valine (µM) | Chickpea | 1153 ± 166ab | 878 ± 61.4ab | 1352 ± 161ᵃ | 777 ± 73.7b | 1120 ± 353ab | 0.03 |
Lentil | 1139 ± 203ᵃ | 1027 ± 21ᵃ | 1123 ± 98ᵃ | 698 ± 84ᵇ | 1569 ± 198ᶜ | 0.014 | |
Mushroom | 1045 ± 92ᵃ | 1068 ± 95ᵃ | 1360 ± 144ᵇ | 791 ± 71ᶜ | 1196 ± 14ᵃ | 0.007 | |
Pumpkin | 771 ± 135 | 872 ± 335 | 870 ± 194 | 789 ± 136 | 801 ± 110 | 0.968 | |
Split pea | 1252 ± 201ᵃ | 1084 ± 81ᵃ | 1483 ± 60ᵇ | 805 ± 35ᶜ | 1393 ± 105ᵇ | <0.001 | |
Isoleucine (µM) | Chickpea | 812 ± 114ᵃ | 687 ± 55ᵃ | 976 ± 25ᵃᵇ | 542 ± 41ᵇ | 793 ± 248ᵃ | <0.001 |
Lentil | 838 ± 148ᵃ | 733 ± 82ᵃ | 946 ± 169ᵃ | 513 ± 67ᵇ | 1218 ± 255ᵃᵇ | 0.025 | |
Mushroom | 692 ± 41ᵃ | 729 ± 72ᵃᶜ | 991 ± 130ᵇᶜ | 541 ± 54 ᵃ | 900 ± 23ᶜ | 0.002 | |
Pumpkin | 480 ± 54 | 589 ± 112 | 597 ± 41 | 538 ± 89 | 614 ± 44 | 0.197 | |
Split pea | 834 ± 100ᵃ | 830 ± 56ᵃ | 1026 ± 37ᵇ | 555 ± 23ᶜ | 1041 ± 46ᵇ | <0.001 | |
Phenylalanine (µM) | Chickpea | 749 ± 92 | 1000 ± 63 | 942 ± 21 | 913 ± 49 | 762 ± 258 | 0.138 |
Lentil | 953 ± 91 | 1362 ± 194 | 1129 ± 119 | 1007 ± 139 | 1336 ± 251 | 0.138 | |
Mushroom | 555 ± 16ᵃ | 962 ± 64ᵇ | 837 ± 92ᵇ | 847 ± 97ᵇ | 799 ± 23ᵇ | <0.001 | |
Pumpkin | 491 ± 36ᵃ | 896 ± 93ᵇ | 685 ± 57ᶜ | 903 ± 104ᵇ | 673 ± 16ᵃᶜ | 0.005 | |
Split pea | 763 ± 63ᵃ | 1182 ± 53ᵇ | 969 ± 25ᶜ | 925 ± 21ᶜ | 948 ± 61ᶜ | 0.006 | |
Tryptophan (µM) | Chickpea | 505 ± 36 | 530 ± 29 | 555 ± 22 | 567 ± 29 | 484 ± 165 | 0.393 |
Lentil | 425 ± 57 | 642 ± 62 | 552 ± 13 | 500 ± 66 | 613 ± 203 | 0.102 | |
Mushroom | 461 ± 11ᵃ | 605 ± 30b | 544 ± 65b | 536 ± 124b | 553 ± 34b | 0.011 | |
Pumpkin | 462 ± 50ᵃᵇ | 537 ± 64ᵃᵇ | 463 ± 62ᵃᵇ | 571 ± 42ᵃ | 424 ± 23ᵇ | 0.045 | |
Split pea | 481 ± 34 | 618 ± 50 | 558 ± 3 | 544 ± 45 | 560 ± 50 | 0.135 | |
Sum EAAs (µM) | Chickpea | 9509 ± 1198 | 11819 ± 746 | 11425 ± 486 | 10133 ± 373 | 9999 ± 3170 | 0.081 |
Lentil | 10687 ± 1748 | 14256 ± 1426 | 12115 ± 1833 | 10742 ± 1136 | 15785 ± 2826 | 0.117 | |
Mushroom | 8182 ± 445ᵃ | 12425 ± 953ᵇ | 11044 ± 1142ᵇ | 10312 ± 938ᵃᵇ | 11206 ± 214ᵇ | 0.004 | |
Pumpkin | 6998 ± 764 | 11008 ± 2168 | 8446 ± 842 | 10763 ± 1524 | 8954 ± 651 | 0.076 | |
Split pea | 10187 ± 1231ᵃ | 13728 ± 728ᵇ | 12030 ± 368ᵃᵇ | 10660 ± 384ᵃ | 12796 ± 740ᵇ | 0.013 | |
Sum NEAAs (µM) | Chickpea | 12194 ± 1580 | 12506 ± 895 | 13259 ± 407 | 11301 ± 1419 | 11428 ± 3729 | 0.383 |
Lentil | 13464 ± 2077 | 14686 ± 1832 | 13973 ± 2475 | 11353 ± 1374 | 18324 ± 3073 | 0.143 | |
Mushroom | 11437 ± 505ᵃ | 13524 ± 1201b | 14226 ± 1824b | 11723 ± 864b | 13446 ± 254b | 0.026 | |
Pumpkin | 9593 ± 732 | 12292 ± 2055 | 14465 ± 5812 | 12507 ± 2558 | 11091 ± 1380 | 0.275 | |
Split pea | 12322 ± 1307ᵃ | 14451 ± 546ᵃᵇ | 13859 ± 410ᵃᵇ | 11523 ± 663ᵃ | 14860 ± 758ᵇ | 0.019 |
Note: Values are expressed as mean ± standard deviation (n = 3). Statistical differences were assessed using one-way ANOVA followed by Tukey’s HSD post hoc test. Different superscript letters within the same row indicate significant differences between enrichment types (p < 0.05). EAA refers to essential amino acids, and NEAA refers to non-essential amino acids. Vache is La Vache qui rit cheese, and Vache + corresponds to La Vache qui rit Formule Plus.
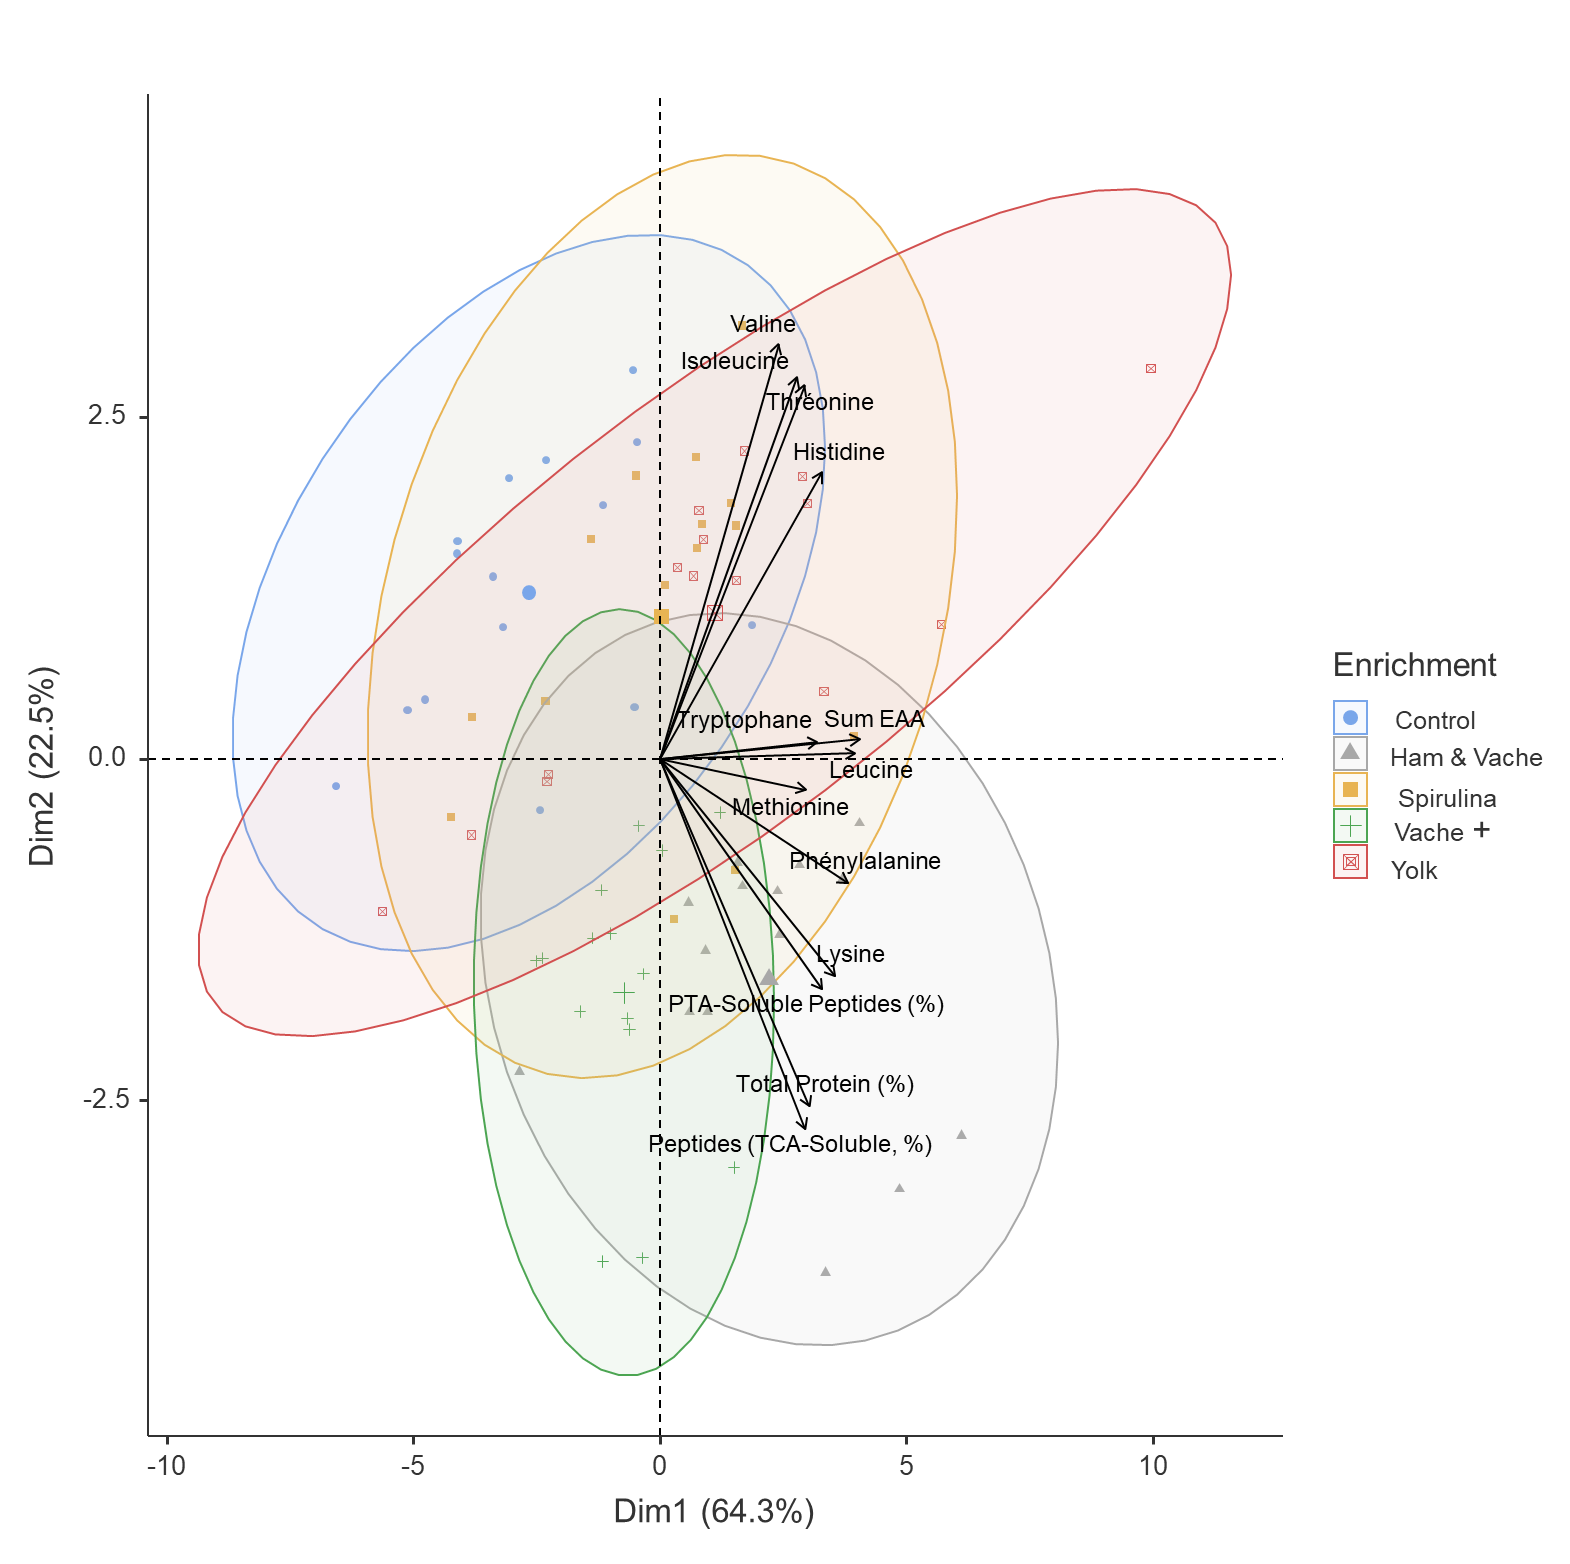
Figure 2 - Principal Component Analysis of total protein, soluble peptides, and free amino acids in all digested soups. The PCA was performed using the measured analytical variables, including total protein, TCA- and PTA-soluble peptides, and individual free essential amino acids. Samples are grouped according to enrichment type: Control, Ham & La Vache qui rit®, La Vache qui rit® +, Spirulina, and Yolk, with each group including all soup matrices prepared with the corresponding enrichment strategy. The 95% confidence ellipses indicate group distribution, and variable loadings represent the contribution of each measured parameter to sample separation along the first two principal components.
Table 4 - Free iron levels measured in the digested soup samples.
Digested sample | Control (µM) | Ham & Vache (µM) | Vache + (µM) | Yolk (µM) | Spirulina (µM) | P value | |
|---|---|---|---|---|---|---|---|
Pumpkin | 43.9 ± 0.5a | 52.4 ± 0.6b | 41 ± 0.1a | 44.5 ± 0.1a | 109 ± 1.9c | < 0.001 | |
Lentil | 6.64 ± 1.1a | 10.3 ± 0.5b | 10.5 ± 0.2b | 6.36 ± 0.4a | 14.8 ± 0.5c | 0.009 | |
Chickpea | 52.1 ± 1.3a | 64.0 ± 0.4b | 61.3 ± 0.6b | 68.3 ± 0.7c | 158 ± 1.4d | < 0.001 | |
Mushroom | 17.6 ± 0.1a | 32.8 ± 0.7b | 29.9 ± 0.1b | 69.9 ± 0.4c | 79.5 ± 2.4d | < 0.001 | |
Split pea | 57.9 ± 0.9a | 65.5 ± 0.3b | 64.1 ± 0.7b | 100 ± 0.8c | 154 ± 0.2d | < 0.001 | |
Note: Values are expressed as mean ± standard deviation (n = 3). Different superscript letters within a row indicate significant differences among enrichment types (Tukey’s HSD, p < 0.05). Free iron refers to the sum of soluble ferrous (Fe²⁺) and ferric (Fe³⁺) ions measured in the digested samples. Vache and Vache+ correspond to La Vache qui rit and La Vache qui rit Plus, respectively.
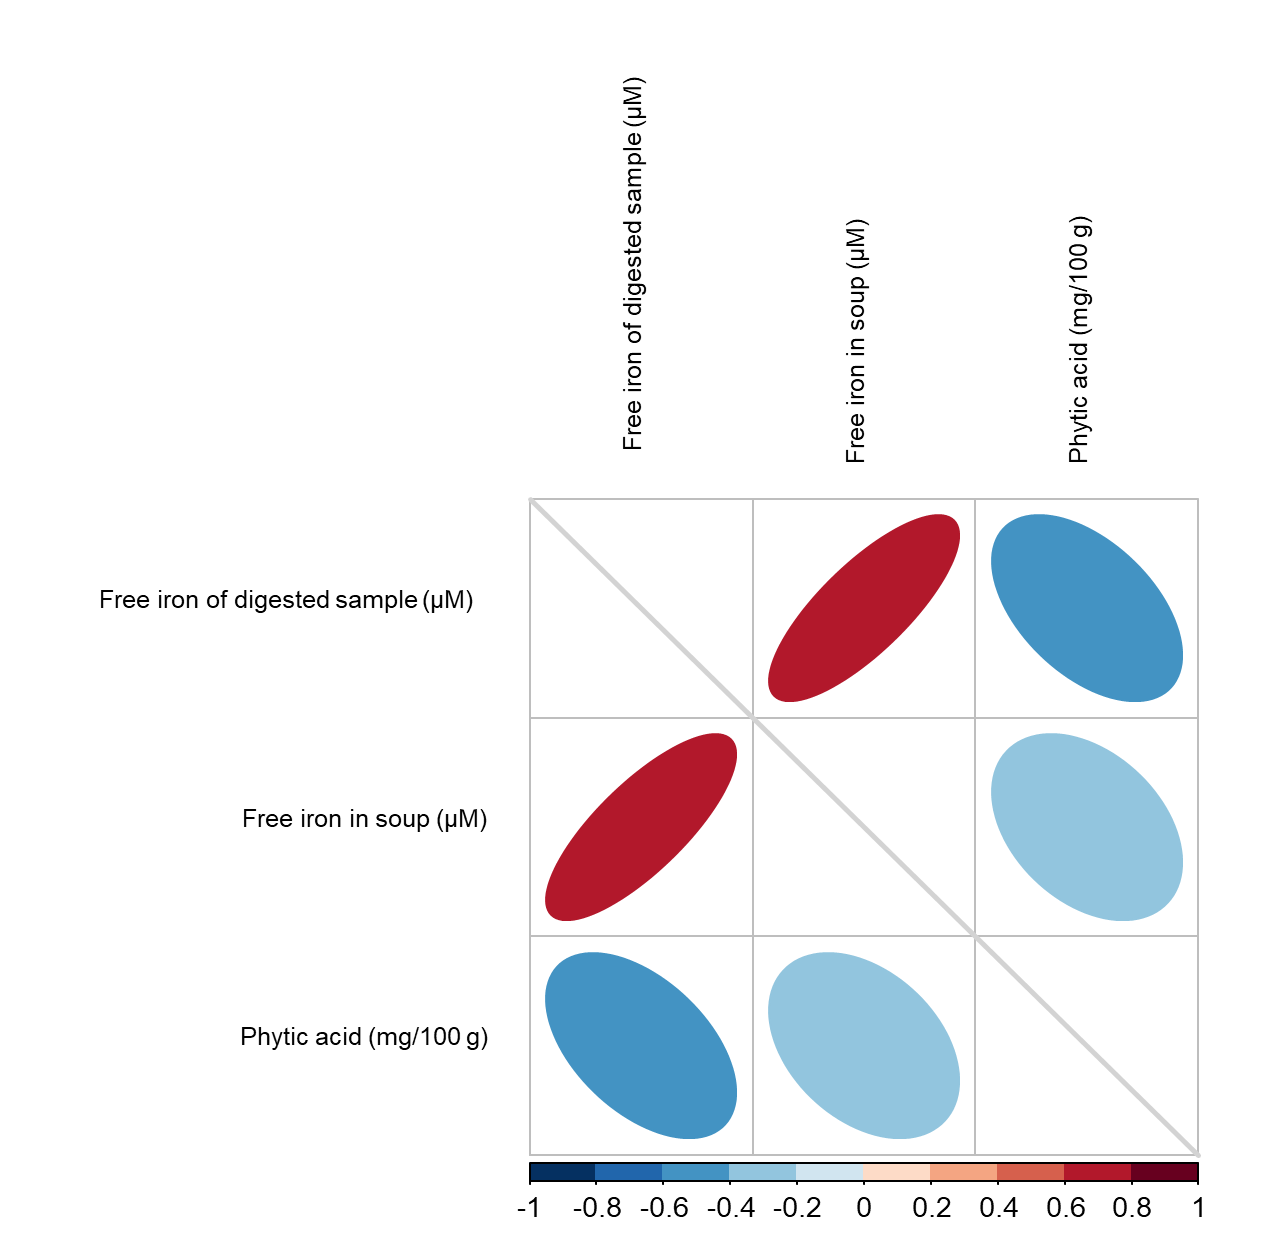
Figure 3 - Pearson correlations among free iron measures and phytic acid content in soups and digested soups. The Pearson correlation matrix shows associations between free iron in soup, free iron in digested samples, and phytic acid content in the soups. Ellipse orientation and color intensity represent correlation direction and magnitude.
Discussion
Impact of enrichment on soup composition
Despite the use of the same enrichment ingredients and quantities across soup bases, the increase in protein content varied according to the initial composition of each matrix. This is because protein content was expressed on a dry matter basis in the final prepared soups, rather than as the absolute amount of protein added per portion. Soups starting with low protein content, such as pumpkin soup, showed the greatest relative gains after enrichment, whereas lentil soup, already protein-rich, exhibited a smaller proportional increase.
In addition to the enrichment ingredients themselves, the initial composition of each soup matrix may influence the final nutritional profile of the enriched soups and their subsequent behaviour during in-vitro digestion. In particular, phytic acid, which was highest in lentil soup, can interact with proteins and minerals through electrostatic interactions, forming complexes that may reduce protein solubility and affect apparent protein hydrolysis and nutrient release. This effect is likely to be less pronounced in low-phytate matrices such as pumpkin and chickpea soups, where proteins may be more readily solubilized during digestion (Berrazaga et al., 2019; Ojo, 2021; Santos-Sánchez et al., 2024). Therefore, phytic acid was considered mainly as a potential contributor to the matrix effects observed during digestion and nutrient bioaccessibility.
Free iron levels differed markedly by enrichment, reflecting interplay between total iron, its chemical form, and the matrix inhibitors. Although raw lentils are iron-rich, lentil soup showed low free iron due to abundant phytic acid counteracting enhancers from vegetables or animal proteins (Piskin et al., 2022). Spirulina-enriched soups, yielded the highest free iron, consistent with its 0.7–2.3 mg/g dry weight, often as labile organic complexes releasing ferrous ions upon heating (Isani et al., 2022). Importantly, the nutritional relevance of spirulina-derived iron is supported by randomized controlled trials showing improvements in serum iron and anemia-related parameters following spirulina supplementation in both iron-deficient children and adults. These findings support the potential of spirulina fortification as an effective food-based strategy to enhance iron nutrition, including in older adults (Moradi et al., 2023; Othoo et al., 2021). Yolk-enriched soups ranked next, as their 2–3 mg Fe/100 g, mostly non-heme bound to phosvitin, becomes bioavailable post-thermal processing (Kobayashi et al., 2015). Furthermore, following gastric digestion, characterized by low pH and proteolytic activity, can further destabilize iron–protein complexes, increasing the pool of labile and potentially absorbable iron (Hoppler et al., 2008; Sharp & Srai, 2007). However, this increase in free iron also has important implications for oxidative stability (Utama et al., 2016). Ham and La Vache qui rit® enrichments trailed, limited by lentil’s phytate chelation of divalent cations (Ojo, 2021).
Enrichment elevated lipid oxidation across soups, evidenced by higher malondialdehyde (MDA) levels, with spirulina and yolk-enriched soups, mirroring top highest free iron levels. This pattern suggests a strong positive relationship between the free iron and lipid oxidation, aligning with iron’s role as a potent pro-oxidant via Fenton reactions, generating hydroxyl radicals that drive lipid peroxidation (Ayala et al., 2014; Utama et al., 2016). For elderly people, who are particularly susceptible to oxidative stress, these findings highlight the importance of balancing iron bioaccessibility with dietary strategies to limit iron-induced oxidation, such as incorporating polyphenol-rich antioxidant components into the diet (Gorni & Finco, 2020; Vallier et al., 2020).
Effect of enrichment on apparent protein hydrolysis and amino acid release after in-vitro digestion
While the previous observations describe the soup matrices before digestion, the results obtained after in-vitro digestion provide further insight into the effect of enrichment on soluble protein-derived fractions and free amino acid release. Compared with their corresponding control soups, enriched recipes generally showed higher total protein-equivalent nitrogen fractions after digestion, together with increased TCA- and PTA-soluble fractions. These results indicate a greater amount of soluble protein-derived compounds in the digesta under the fixed-volume digestion conditions used in this study. However, these values should not be interpreted as direct digestibility percentages, as they were not normalized to the total protein initially introduced into the digestion. In addition, because the same soup volume was digested for all formulations, while enrichment modified the protein content of the samples, the enzyme-to-protein ratio differed among treatments. This may have influenced the extent of hydrolysis and should be considered when comparing enriched soups. Nevertheless, this design was intentionally chosen to compare complete soups on a portion basis, using a 5 mL aliquot representative of a standard 250 mL serving, rather than to compare isolated protein sources at equivalent protein doses. The estimated non-digested protein-equivalent fraction remained stable in most soups, with a significant increase observed only in split pea soup. This isolated result likely reflects the specific behavior of this matrix rather than a systematic negative effect of enrichment. Overall, enrichment increased the amount of soluble protein-derived fractions after digestion without generally increasing the estimated non-digested protein-equivalent fraction, suggesting that the added ingredients contributed to higher levels of soluble protein-derived compounds in the digesta.
Free essential amino acid concentrations showed a less uniform pattern than the TCA- and PTA-soluble fractions. Compared with the corresponding control soup, some enriched recipes showed higher concentrations of free EAAs after digestion, indicating an increased bioaccessible free amino acid pool within the same matrix. Nevertheless, because the total amino acid composition of the initial soups was not determined, these results should be interpreted as absolute bioaccessible free amino acid concentrations rather than fractional amino acid bioaccessibility. This distinction is important, as enrichment may increase the amount of free amino acids released after digestion without necessarily demonstrating a higher proportion of amino acids released relative to the total amino acid content of the food.
The multivariate analysis further highlighted enrichment-specific patterns. Yolk-enriched soups clustered near vectors for branched-chain amino acids (BCAA: valine and isoleucine), threonine, and histidine, reflecting yolk’s rich EAA profile, including high histidine, leucine, and BCAAs that hydrolyze readily during digestion (Attia et al., 2020; Sarantidi et al., 2023). Histidine’s prominence underscore yolk’s value for elderly muscle maintenance (Xia et al., 2022). Spirulina clustered similarly, likely owing to its abundance in BCAAs and essential amino acids (Lee et al., 2022; Xia et al., 2022). Conversely, ham & La Vache qui rit® and La Vache qui rit + clustered with higher total protein-equivalent content, TCA-soluble peptides, PTA-soluble peptides. This aligns with findings from the processed cheese literature, where casein and whey-based processed cheeses undergo extensive enzymatic hydrolysis and release substantial quantities of peptides and essential amino acids during digestion (Lorieau et al., 2019; Shafique et al., 2023). Similarly, processed meats such as cooked ham have been shown to exhibit improved protein quality and enhanced digestibility (Ayuso et al., 2024). These findings indicate that enrichment effects were not uniform across matrices or protein sources, but depended on the interaction between the soup base and the enrichment ingredient.
Impact of enrichment on bioaccessible free iron in digesta
Matrix composition, particularly phytic acid content, appeared to be a key determinant of bioaccessible free iron after in-vitro digestion. Spirulina consistently yielded the highest levels of bioaccessible free iron, supporting its potential as a source of highly releasable iron in enriched soups. This is consistent with previous studies reporting that spirulina supplementation can improve hematological markers, such as hemoglobin, in older adults (Selmi et al., 2011). Lentil digesta, however, exhibited the lowest levels of bioaccessible free iron, even when enriched with spirulina, likely due to its elevated phytate content, as supported by the significant negative correlation between phytic acid and free iron in digested samples. Despite the high total iron content of lentils, phytate chelation may limit iron release during digestion and reduce the effectiveness of iron-focused fortification strategies in this matrix (Khazaei et al., 2017). These findings are consistent with the effects observed for protein enrichment, as phytate appeared to moderate nutrient bioaccessibility. They also underscore the need to consider both the enrichment ingredient and the inhibitory potential of the food matrix when designing home-delivered meals aimed at improving bioaccessible free amino acid release and free iron availability for older adults. Overall, low-inhibitor matrices combined with nutrient-dense enrichment ingredients may help improve the nutritional quality of fortified soups intended for this population.
A limitation of the present study is that the in-vitro digestion was performed using a fixed volume of soup rather than equivalent protein loads. As protein enrichment modified the protein content of the soups, the enzyme-to-protein ratio differed among samples, which may have influenced the extent of protein hydrolysis and peptide/amino acid release. Therefore, the digestion results should be interpreted as apparent protein hydrolysis and nutrient release from fixed soup portions, reflecting realistic consumption conditions, rather than as intrinsic protein digestibility normalized per gram of initial protein. Another limitation could be that protein content in the soups was determined from one replicate per formulation because of limited sample availability. Therefore, the protein enrichment values and fold-increase ratios can be interpreted as descriptive indicators of the achieved enrichment rather than as statistically supported comparisons. However, these values were used only to characterize the prepared soups and to support the interpretation of the fixed-volume digestion design.
Conclusions
This study showed that enriching vegetable-based soups with animal-derived ingredients, including ham, La Vache qui rit® processed cheeses and egg yolk, or with spirulina can increase the protein content of soups intended for older recipients of home-delivered meals, while preserving a familiar food format. After in-vitro digestion, enriched soups generally showed higher soluble protein-derived fractions and, in some cases, higher absolute concentrations of free essential amino acids, including branched-chain amino acids that are critical for sarcopenia prevention. These results indicated an increased bioaccessible free amino acid pool in the digesta.
A pronounced matrix effect was observed, particularly for lentil soup, whose elevated phytic acid content appeared to be associated with lower bioaccessible free iron after digestion, suggesting that enrichment alone may not fully overcome matrix-related inhibitory effects. Among the enrichment strategies, spirulina and egg yolk were associated with higher bioaccessible free iron levels, although these increases should be considered together with their potential impact on oxidative stability.
Overall, these findings highlight the importance of considering both the enrichment ingredient and the food matrix when designing enriched soups for older adults. Future investigations should elucidate lentil-specific inhibitory components, evaluate sensory acceptability among older adults, and explore synergistic combinations with phytase enzymes or low-phytate legume varieties to overcome matrix limitations. Long-term clinical trials assessing functional outcomes such as muscle mass retention and anemia correction in elderly cohorts receiving enriched soups would further validate their efficacy, paving the way for scalable integration into public health nutrition programs.
Appendices
Table S1 - Composition of the soup bases (per recipe)
Soup | Ingredients (quantity) |
|---|---|
Pumpkin | Potatoes (250 g), pumpkin (250 g), chicken broth (10 g), crème fraîche (100 mL), water (1000 mL) |
Lentil | Potatoes (200 g), lentils (100 g), onions (30 g), water (1000 mL) |
Chickpea | Potatoes (200 g), chickpeas (100 g, canned), leeks (50 g), onions (20 g), water (1000 mL) |
Mushroom | Potatoes (300 g), mushrooms (150 g), onions (10 g), water (1000 mL) |
Split pea | Split peas (100 g, soaked overnight), potatoes (300 g), water (1000 mL) |
Note: The quantities shown correspond to the complete recipe prepared prior to portioning. After cooking and homogenization, each soup was divided into five 200 mL portions corresponding to the five enrichment conditions (Control, Ham & La Vache qui rit®, Vache +, Yolk, and Spirulina). The following four enrichments were applied in the same quantity to all five soup bases. Split peas were soaked overnight in water containing NaHCO₃ (sodium bicarbonate) prior to cooking.
Table S2 - Protein enrichment strategies applied to each 200 mL soup portion
Enrichment type |
| |
|---|---|---|
Control | No enrichment | |
Ham & La Vache qui rit® | Pork cooked ham (20 g) and processed cheese (20 g) | |
La Vache qui rit® + | La Vache qui rit® Formule Plus (40 g) | |
Yolk | One egg yolk | |
Spirulina | Spirulina powder (3 g) |
Note: All enrichment strategies were applied in identical quantities to each of the five soup bases. The egg yolk was gently cooked with three spoonfuls of the corresponding soup for 3 min before being reincorporated into the portion. This experimental design resulted in 25 soup samples (5 soup bases × 5 enrichment conditions).
Table S3 - Dry matter content (%) of the soups
Enrichment | Ham & Vache qui rit | Vache qui rit + | Yolk | Spirulina | Control |
|---|---|---|---|---|---|
Pumpkin | 11.1 ± 0.3 | 12.6 ± 0.7 | 11.5 ± 0.8 | 9 ± 0.4 | 7.3 ± 0.1 |
Lentil | 18.8 ± 0.1 | 19.8 ± 0.2 | 18.9 ± 0.1 | 16.8 ± 0.2 | 13.2 ± 0.2 |
Chickpea | 11.1 ± 0.3 | 11.9 ± 0.4 | 10.5 ± 0.2 | 9.2 ± 0.4 | 5.9 ± 0.5 |
Mushroom | 10.5 ± 0.1 | 10.9 ± 0.1 | 10.8 ± 0.1 | 7.9 ± 0.1 | 5.4 ± 0.6 |
Split pea | 12.7 ± 0.2 | 13.7 ± 0.1 | 12.9 ± 0.1 | 10.8 ± 0.1 | 8.7 ± 0.9 |
Values are expressed as mean ± standard deviation (n = 3). These data were used to calculate and present all protein results on a dry matter basis in the main manuscript. “Vache” refers to La Vache qui rit® cheese, and “Vache +” refers to La Vache qui rit® Formule Plus.
Table S4 - Pearson correlation matrix for free iron measurements and phytic acid content of soups
|
| Free iron of digested sample | Free iron in soup | Phytic acid |
|---|---|---|---|---|
Free iron of digested sample | Pearson’s r | — |
|
|
p-value | — |
|
| |
Free iron in soup | Pearson’s r | 0.783*** | — |
|
p-value | <.001 | — |
| |
Phytic acid | Pearson’s r | -0.506** | -0.379 | — |
p-value | 0.010 | 0.062 | — |
Note: * p < .05, ** p < .01, *** p < .001. The table presents Pearson correlation coefficients (r) and corresponding p-values for associations between free iron in soup, free iron in digested soups, and phytic acid content in the soups. Significant correlations are indicated by p < 0.05.
Author contributions
Conceptualization: V.S.-L.; methodology: P.H.; investigation: P.H., A.L., B.S., L.V.; formal analysis: P.H.; validation: V.S.-L.; writing – original draft preparation: P.H.; writing – review & editing: V.S.-L.; supervision: V.S.-L. All authors have read and agreed to the published version of the manuscript.
Acknowledgements
The authors thank David Blanchefort, chef of Ambert Hospital for sharing his recipes, and Dr Amel Hedhili from ESA (Ecole Superieure of Agriculture) for her valuable advice. Preprint version 3 of this article has been peer-reviewed and recommended by PCI Nutrition (https://doi.org/10.24072/pci.nutrition.100139; Calvez, 2026).
Funding
This work received financial support from INRAE and the Auvergne Rhône-Alpes Region as part of the TETRAE program.
Conflict of interest disclosure
There are no conflicts to declare.
Data availability
Data are available online: https://hal.inrae.fr/hal-05559419 (Santé-Lhoutellier et al., 2026).