

 CC-BY 4.0
Introduction
Biophysical plant models aim to mechanistically represent how plants acquire, process, and utilise biophysical resources (such as light, water, and carbon) across spatial and temporal scales by integrating fundamental physiological processes such as photosynthesis, transpiration or energy balance (Fourcaud et al., 2008). These models are used by different communities of scientists interested in the simulation of plants at different scales: organ-to-plant with functional-structural plant models (FSPM; Vos et al., 2010), plant-to-plot with individual process-based models (PBM; e.g. Duursma & Medlyn, 2012, Maréchaux & Chave, 2017), or earth models (e.g. Krinner et al., 2005). Generally, FSPM and PBM use leaf-scale measurements to parameterise different sub-models, enabling the upscaling of such measurements to the plant (FSPM) or plot level (PBM), thereby simulating variables that are hard or impossible to directly measure (e.g. water and energy balance) and predicting system behaviour under current or new conditions (e.g. assessing climate change impacts) (Wu, 2023). The community of plant growth modelling is encountering challenges in parameterizing models due to the complexity of these models and the high costs associated with data acquisition. Consequently, there is a notable absence of benchmarking, which hinders the ability to compare the diverse range of models present in the literature effectively (Cournède et al., 2013).
In FSPM, evaluating a model becomes challenging when numerous interconnected processes are simulated, as it is often the case with biophysical processes in natural systems, and these interactions may act across different scales and environments (Rötter et al., 2012). Yet, despite their broad relevance, these models are often evaluated using data collected at a single scale, most commonly at the leaf or plot level, due to the rarity of datasets that capture both detailed organ-level measurements and integrated responses at the whole-plant scale (Wu, 2023). In practice, the challenge of acquiring coherent datasets that simultaneously capture plant geometry, physiological traits, and whole-plant gas exchange under controlled and well-documented conditions often restricts the thorough assessment of models. There is no standard method to test FSPMs since collecting all the necessary data for model development is often challenging or even impossible, leading to many assumptions and significant uncertainty in the resulting models (Wang et al., 2018). More specifically, assessing the coupling between light interception models and photosynthesis models is particularly difficult. First, light interception is often estimated using 3D mock-ups generated by architectural models based on statistical or allometric formalisms, which do not accurately reproduce the specific architecture of individual plants (Perez et al., 2019). As a result, variations in integrated model outputs, such as carbon assimilation, may arise from uncontrolled differences in plant architecture. Secondly, calibration of photosynthesis and stomatal conductance models is generally performed using spot measurements, despite these processes may vary spatially and temporally. Consequently, most models remain untested or insufficiently evaluated at integrative levels, reducing our confidence in their predictions and their applicability to real-world scenarios.
Another limitation of current holistic modelling approaches is the lack of available datasets for testing extreme climatic events. Since physiological processes typically exhibit nonlinear responses to climatic variables, it is crucial to acquire this data and assess model performance in predicting plant behaviour under future climate scenarios.
We argue that accessible databases that enable the evaluation of biophysical models across various scales, from the leaf level to the plant and plot levels, are crucial for increasing confidence in model predictions. Those databases should include different experiments conducted in more to less controlled conditions, allowing the evaluation of models with varying degrees of freedom, evaluating physics-based processes first (such as light interception or phnotosynthesis), and coming to more biology-based processes (such as caron partitioning). For example, the experimental data acquired by Schymanski & Or (2017) can help evaluate the energy balance (sensible and latent heat) components of models at the scale of an individual leaf, thanks to their experiment on highly controlled conditions using an artificial leaf.
In this data paper, we address the lack of accessible and suitable dataset by providing a comprehensive database of biophysical measurements in young oil palm plants (Elaeis guineensis) to evaluate the biophysical processes of light interception and photosynthesis at leaf-to-plant scale under controlled conditions. Our dataset encompasses detailed 3D reconstructions of the plants aerial architecture, leaf-level gas exchange measurements that inform fundamental physiological parameters, and whole-plant flux data acquired under controlled varying climatic conditions. By bridging the scales from individual leaves to the entire plant, this database provides modellers the data required to calibrate a digital twin (or shadow) of the experiment, allowing the assessment of their biophysical models at a fine spatial resolution and evaluate their predictive accuracy at a more holistic level: the whole plant. In doing so, we aim at providing a new generation of open-access databases that empower researchers to rigorously benchmark biophysical models, ultimately improving their robustness, reliability, and utility.
Material and experimental monitoring
Plant material and pre-experiment growing conditions
Four oil palm plants (Elaeis guineensis Jacq.) from two genetic origins were studied: Deli x Lame crossing (P1, P2 & P4) and a Deli x Yamgambi crossing (P3). Only four plants were selected due to the time available for carrying out the experiment. The individuals were selected based on their visually distinct morphology, which stood out among all the available plants. Our aim was to explore the potential diversity in plant responses driven by their structural and physiological differences. The plants were sown on May 11th 2020 in pots of 4.8L (16 cm x 16 cm x 23 cm) filled with a mix made of 1200 g of substrate (mixture of blond peat, perlite, coconut fiber, and sand, containing 57% dry matter and 34% organic matter) and 8 g of NPK fertilizer (50% of Basacote 13-5-18 and 50% of Bio 5-3-8; Compo Expert). Plants cultivated in a greenhouse from CIRAD’s Abiophen platform (Montpellier, France). The air temperature was controlled at 26°C during the day and 21°C during the night, relative humidity at 70% and air CO2 concentration ([CO2]) at around 400 ppm. Photosynthetically active radiation (PAR) was maintained around 600 µmol m-2 s-1 with artificial light complementing natural light with a 12 hour photoperiod (light from 6 am to 6 pm). The plants were irrigated every two to three days to prevent water stress. On February 25th, 2021, the plants were transferred to the microcosm’s experimental platform of the European Ecotron of Montpellier (https://www.ecotron.cnrs.fr).
Microcosms
Set-up
Two microcosms growth chambers of dimensions 114 cm width x 113 cm depth x 152 cm (~1.5 m3) height were used for the two-month experiment. The microcosms allowed for a precise control of radiation in the visible spectrum (Supplementary Material Figure S1) with four LED lamps (Soledaire, France), air temperature (5-50±0.5°C), relative humidity (20-90±3%), and CO2 concentration (10-2000ppm). The monitoring microcosm was used to measure the biophysical processes of a single plant in response to different climate conditions with varying air temperature, relative humidity and radiation. The storage microcosm was used to store the three other plants waiting for their turn in the monitoring microcosm.
Monitoring
The monitoring microcosm was operated as an open CO2 gas exchange system. The flow rate of dry air at the inlet was measured and regulated at 4.9 Nm3 h-1 using a mass flow regulator (F-202AV, Bronkhorst, The Netherlands). The net CO2 flux was measured continuously by sequentially measuring the inlet and outlet of the chamber every 5 minutes using a Valco selector (EUTA-SD4MWE, VICI, Switzerland) and a Picarro G2101-i (Picarro, USA) CO2 analyser. For each position of the selector, the first two minutes were discarded, and the last three minutes were averaged. The air sampling at the inlet circulated first through a 30-litre buffer volume with a flow rate regulated at 1.5 l min-1 using a needle valve, while the outlet was directly measured.
The monitoring microcosm was also equipped with a photosynthetically active radiation sensor (quantum sensor LICOR LI-190 SA, Lincoln, NE, Figure 1), air temperature (CTN 35, Carel) and humidity sensors (PFmini72, Michell instrument, USA), a thermal camera on the top left corner pointing towards the centre of the chamber to measure leaf temperature, and a precision scale to monitor weight. The thermal camera and the precision scale were controlled by a Raspberry Pi (https://www.raspberrypi.org/) board that triggered a camera shot every minute and automatically logged the stream of data from the scale. Data from all other sensors were automatically logged by the microcosm facility.
The pot of the plant was sealed with an inert plastic film before entrance into the monitoring microcosm to avoid water loss and prevent gas exchange between soil and atmosphere, enabling the computation of plant transpiration from weight loss. Plants were automatically watered every six hours to maintain non-limiting soil water availability.
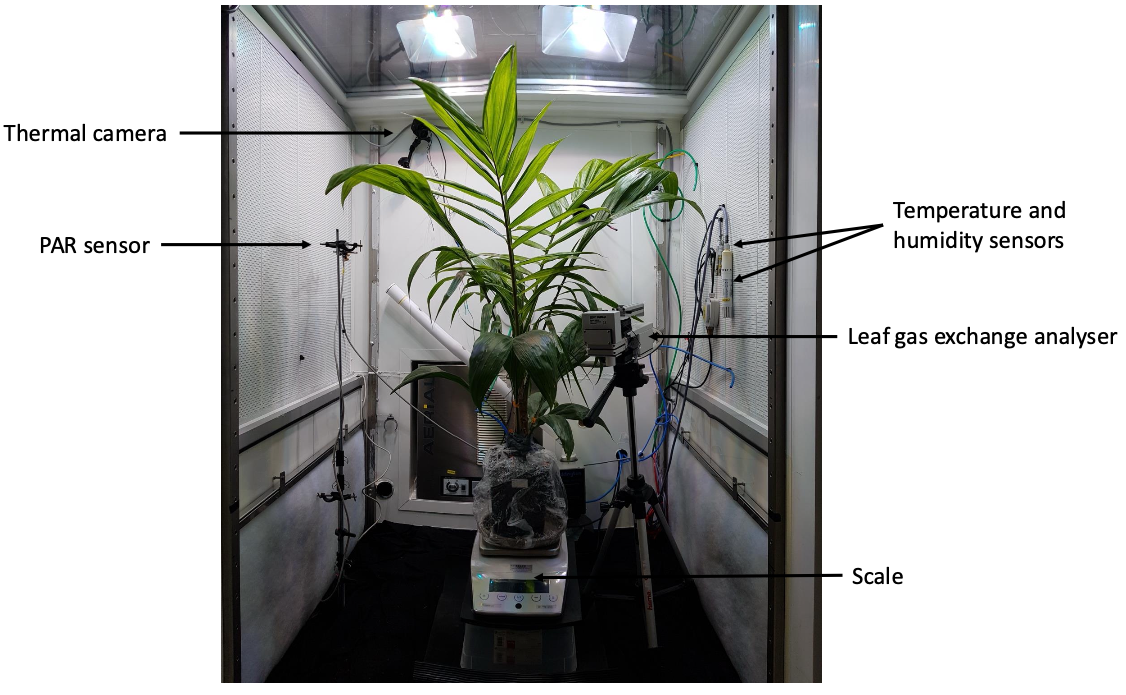
Figure 1 - Oil palm plant in the monitoring microcosm. The pot was sealed to avoid water loss and prevent gas exchange between soil and atmosphere. A precision scale was positioned under the pot to estimate plant transpiration from variations in plant weight. Sensors for photosynthetically active radiation (LICOR LI-190), temperature, and relative humidity were installed in the chamber to regulate the environmental conditions. The head of the leaf gas exchange analyser (Walz GFS-3000 ) was positioned in the chamber to conduct either CO2 response curves in the storage microcosm or to follow leaf assimilation during specific scenarios in the monitoring chamber.
Integrated methods and data overview
Multiple datasets were acquired during the experiment and can be grouped according to their typology. An overview of these datasets is provided in Table 1, followed by a detailed description of the methodologies used to collect them in the following sections.
Table 1 - Datasets of the different measurements carried out during the experiment
Datasets | Description | Variables (units) | Time/spatial scales | Raw data folder | Processed data folder |
|---|---|---|---|---|---|
Climate data | Climate conditions in the monitoring microcosm (including instructions and measurements) | Temperature (°C) Relative humidity (%) Radiation (µmol m⁻² s⁻¹) [CO2] (ppm) | Each day of climate scenario Every 30 seconds | 00-data/climate | 01-climate |
mappingLight | 3D mapping of the photosynthetically active radiation (PAR) in the microcosm | PAR (µmol m⁻² s⁻¹) | 5 heights in the microcosm 60 x 18 positions per heigh | 00-data/mappingLight | |
3D plant architectures | 3D reconstructions of plants topology and geometry made from LiDAR points clouds | 3D mock-up in OPF (cm) | 4 times per plant | 00-data/LiDAR/reconstructions | 08-recontruction |
Morphology and biomass | Leaves dimensions and biomass of leaves, bulb and roots | Leaf length (cm) Leaf width (cm) Leaf area (cm2) Leaf fresh and dry biomass (g) Roots fresh and dry biomass (g) Bulb fresh and dry biomass (g) | At the end of the experiment (May, 5th 2021) | 00-data/morphology and biomass | |
Leaf-level CO2 and H2O gas exchanges | Response curves of CO2 assimilation (A) with varying [CO2] (Ci) or light (PPFD) Response curves of stomatal conductance (gsw) with varying vapor pressure deficit (VPD) | A (µmol m⁻² s⁻¹) Ci (ppm) PPFD (µmol m⁻² s⁻¹) gsw (mol m⁻² s⁻¹) VPD (kPa) | Before and after each scenario on one leaf | 00-data/walz | 06-walz |
Plant-level CO2 gas exchanges | CO2 fluxes measured in the microcosms | Flux (µmol s⁻¹) | Each day of climate scenario Every 10 minutes | 00-data/picarro_flux | 03-CO2 |
Plant-level transpiration | Dynamic of pot weight allowing the estimation of H2O fluxes (transpiration) measured in the microcosm | Pot weight (g) | Each day of climate scenario Every minute | 00-data/scale_weight | 05-transpiration |
SPAD data | Leaf SPAD (proxy of chlorophyll or N content) | SPAD | Before every leaf gas exchange measurement in all the leaves | 00-data/spad | 07-spad |
Thermal camera data | Leaf temperature in the microcosm estimated from images and masks | Leaf temperature (°C) | Each day of climate scenario Every minute | 00-data/thermal_camera_images 00-data/thermal_camera_roi_coordinates | 04-thermal_camera_measurements |
The different data sets (except mapping light data and 3D data) were then merged in a single file to provide the database gathering all the processed variables, as presented in Table 2.
Table 2 - Final database merging the processed datasets of climate, fluxes, leaf temperature and photosynthetic parameters. The database for the eight climate scenarios are provided at either 5-minute (09-database/database_5min.csv) or 10-minute (09-database/database_10min.csv) intervals. A dedicated database for the WalzClosed and WalzOpen scenarios (09-database/database_light_experiment.csv) is available at a 30-second interval and also includes leaf-level CO₂ and H₂O gas exchange measurements (see Table 1).
Name | Unit | Description |
|---|---|---|
DateTime_start | UTC | DateTime of the start of the measurement |
DateTime_end | UTC | DateTime of the end of the measurement (either the 5-min output measurement window, or the whole 10-min output-input) |
Plant | - | Plant ID |
Leaf | ID | Leaf ID, leaf ID 1 is the first emitted leaf (the oldest) |
Scenario | - | Scenario forcing climatic conditions |
Sequence | - | Sequence for the scenario. Plants can stay in the chamber for one or several days (one or several scenario). The sequence change value when the plant changes. |
DateTime_end_CO2_in | UTC | DateTime of the end of the CO2 input measurement (CO2 was measured for 5min output, then 5min input) |
DateTime_start_sequence | UTC | DateTime of the start of the sequence |
DateTime_end_sequence | UTC | DateTime of the end of the sequence |
CO2_outflux_umol_s | µmol plant-1 s-1 | CO2 flux measured from the chamber (outflux from the chamber) |
CO2_dry_input | ppm | CO2 concentration of the input flux in the chamber |
CO2_dry_output | ppm | CO2 concentration of the output flux of the chamber |
Ta_instruction | Celsius degree | Instruction on the air temperature of the chamber |
Ta_measurement | Celsius degree | Effective air temperature of the chamber (measurement) |
Rh_instruction | % | Instruction on the relative humidity in the chamber |
Rh_measurement | % | Effective relative humidity in the chamber (measurement) |
R_instruction | % | Instruction on the radiation in the chamber (0 = turned off, 1 = maximal intensity) |
R_measurement | µmol m-2 s-1 | Effective radiation in the chamber (measurement) |
CO2_ppm | ppm | CO2 concentration in the chamber |
CO2_influx | Input CO2 flux of the chamber | |
CO2_instruction | ppm | Instruction for the CO2 concentration in the chamber |
transpiration_linear_g_s | g plant-1 s-1 | Transpiration of the plant, computed from the rate of change within the 5min window using the slope of a linear regression (uses all points) |
transpiration_diff_g_s | g plant-1 s-1 | Transpiration of the plant, computed from the difference in weight between the begining and end of the time-step (uses fewer points) |
Tl_mean | Celsius degree | Average leaf temperature of all pixels in the mask for the leaf |
Tl_min | Celsius degree | Minimum leaf temperature of all pixels in the mask for the leaf |
Tl_max | Celsius degree | Maximum leaf temperature of all pixels in the mask for the leaf |
Tl_mean | Celsius degree | Average corrected leaf temperature of all pixels in the mask for the leaf |
Tl_min | Celsius degree | Minimum corrected leaf temperature of all pixels in the mask for the leaf (corrected the offset using Tleaf-Tair=0 at night) |
Tl_max | Celsius degree | Maximum corrected leaf temperature of all pixels in the mask for the leaf |
Tl_std | Celsius degree | Standard deviation of the leaf temperature of all pixels in the mask for the leaf |
Date_walz | UTC | Date of measurement of the response curves on which the parameters are fitted on (VcMaxRef, JMaxRef, RdRef, g0 and g1) |
Leaf_walz | ID | ID of the leaf on which the response curve was measured |
VcMaxRef | µmol m-2 s-1 | Reference VcMax, fitted on the response curve preceding the plant sequence |
JMaxRef | µmol m-2 s-1 | Reference JMax, fitted on the response curve preceding the plant sequence |
RdRef | µmol m-2 s-1 | Reference Rd, fitted on the response curve preceding the plant sequence |
TPURef | µmol m-2 s-1 | Reference TPU, fitted on the response curve preceding the plant sequence |
Tr | Celsius degree | Reference temperature on which the parameters were fitted |
g0 | mol[CO2] m-2 s-1 | g0, fitted on the response curve preceding the plant sequence |
g1 | - | g1, fitted on the response curve preceding the plant sequence |
VcMaxRef_mean_leaf | µmol m-2 s-1 | Reference VcMax, averaged on all measurements of this leaf during the whole experiment |
JMaxRef_mean_leaf | µmol m-2 s-1 | Reference JMax, averaged on all measurements of this leaf during the whole experiment |
RdRef_mean_leaf | µmol m-2 s-1 | Reference RdMax, averaged on all measurements of this leaf during the whole experiment |
TPURef_mean_leaf | µmol m-2 s-11 | Reference TPU, averaged on all measurements of this leaf during the whole experiment |
Tr_mean_leaf | µmol m-2 s-1 | Reference temperature on which the parameters were fitted, averaged over all measurements on that leaf during the whole experiment |
g0_mean_leaf | µmol m-2 s-1 | g0, averaged on all measurements of this leaf during the whole experiment |
g1_mean_leaf | µmol m-2 s-1 | g1, averaged on all measurements of this leaf during the whole experiment |
VcMaxRef_mean_plant | µmol m-2 s-1 | Reference VcMax, averaged on all measurements of this plant (whatever the leaf) during the whole experiment |
JMaxRef_mean_plant | µmol m-2 s-1 | Reference JMax, averaged on all measurements of this plant (whatever the leaf) during the whole experiment |
RdRef_mean_plant | µmol m-2 s-1 | Reference Rd, averaged on all measurements of this plant (whatever the leaf) during the whole experiment |
TPURef_mean_plant | µmol m-2 s-1 | Reference TPU, averaged on all measurements of this plant (whatever the leaf) during the whole experiment |
Tr_mean_plant | µmol m-2 s-1 | Reference temperature of the measurements, averaged on all measurements of this plant (whatever the leaf) during the whole experiment |
g0_mean_plant | mol[CO2] m-2 s-1 | g0, averaged on all measurements of this plant (whatever the leaf) during the whole experiment |
g1_mean_plant | - | g1, averaged on all measurements of this plant (whatever the leaf) during the whole experiment |
Climate scenario construction and climate data
The microcosm climate conditions were established based on the average daily variations recorded at a weather station in Pekanbaru, Indonesia, a region characterized by optimal conditions for oil palm cultivation. The baseline environmental parameters comprised a constant atmospheric CO₂ concentration of 400 ppm, daily air temperature fluctuations ranging from 22°C to 33°C, relative humidity varying between 82% and 51%, and PAR levels ranging from 0 to approximately 300 µmol m⁻² s⁻¹ measured at mid-height within the chamber, and approximately 1000 µmol m⁻² s⁻¹ directly beneath the light source. These baseline conditions were maintained consistently within the storage microcosm throughout the entire experimental period.
To investigate the effects of key climate variables on physiological processes such as photosynthesis and stomatal conductance, the baseline conditions were modified to simulate eight environmental scenarios. Specifically, atmospheric CO₂ concentrations were elevated to 600 ppm and 800 ppm to assess the influence of increased CO₂ availability. Radiation intensity was reduced to simulate low PAR conditions, with PAR set to 130 µmol m⁻² s⁻¹ at mid-day and mid-height within the chamber. Temperature variations were introduced by decreasing or increasing the baseline air temperature by 30%, representing colder and hotter conditions, respectively. Additionally, combined adjustments of temperature and relative humidity were applied to simulate drier and cooler environments by decreasing relative humidity by 30% while decreasing temperature by 30%, as well as drier and hotter conditions by decreasing relative humidity by 30% and increasing temperature by 30%. These scenarios were designed to capture the complex interactions between CO₂ concentration, radiation, temperature, and humidity, with particular emphasis on vapor pressure deficit (VPD), given the pronounced sensitivity of oil palm stomata to leaf-to-air vapor pressure differences (Dufrêne & Saugier, 1993). VPD can be calculated following the equation of Buck (Buck, 1981):
\(VPD = (1 - \frac{RH}{100}) \times 0.61121 \times e^{(18.678 - \frac{T}{234.5}) \times \frac{T}{257.14 + T}}\)
The eight resulting climate scenarios are presented in Figure 2.
Each plant was sequentially placed in the monitoring microcosm for one or more days, following the experimental design illustrated in Figure 3. Scenarios involving potentially detrimental effects on plant function due to extreme high temperatures were conducted during the final days of measurements for each plant. We collected at least one full day of measurements per scenario and per plant. Due to rapid changes in plant architecture over time and significant inter-individual variability, it was not feasible to include all combinations of scenario replications in our experiment. Consequently, we chose to prioritize replication after a stressful scenario (e.g. DryHot) to ensure they did not affect plant functioning for further scenario.
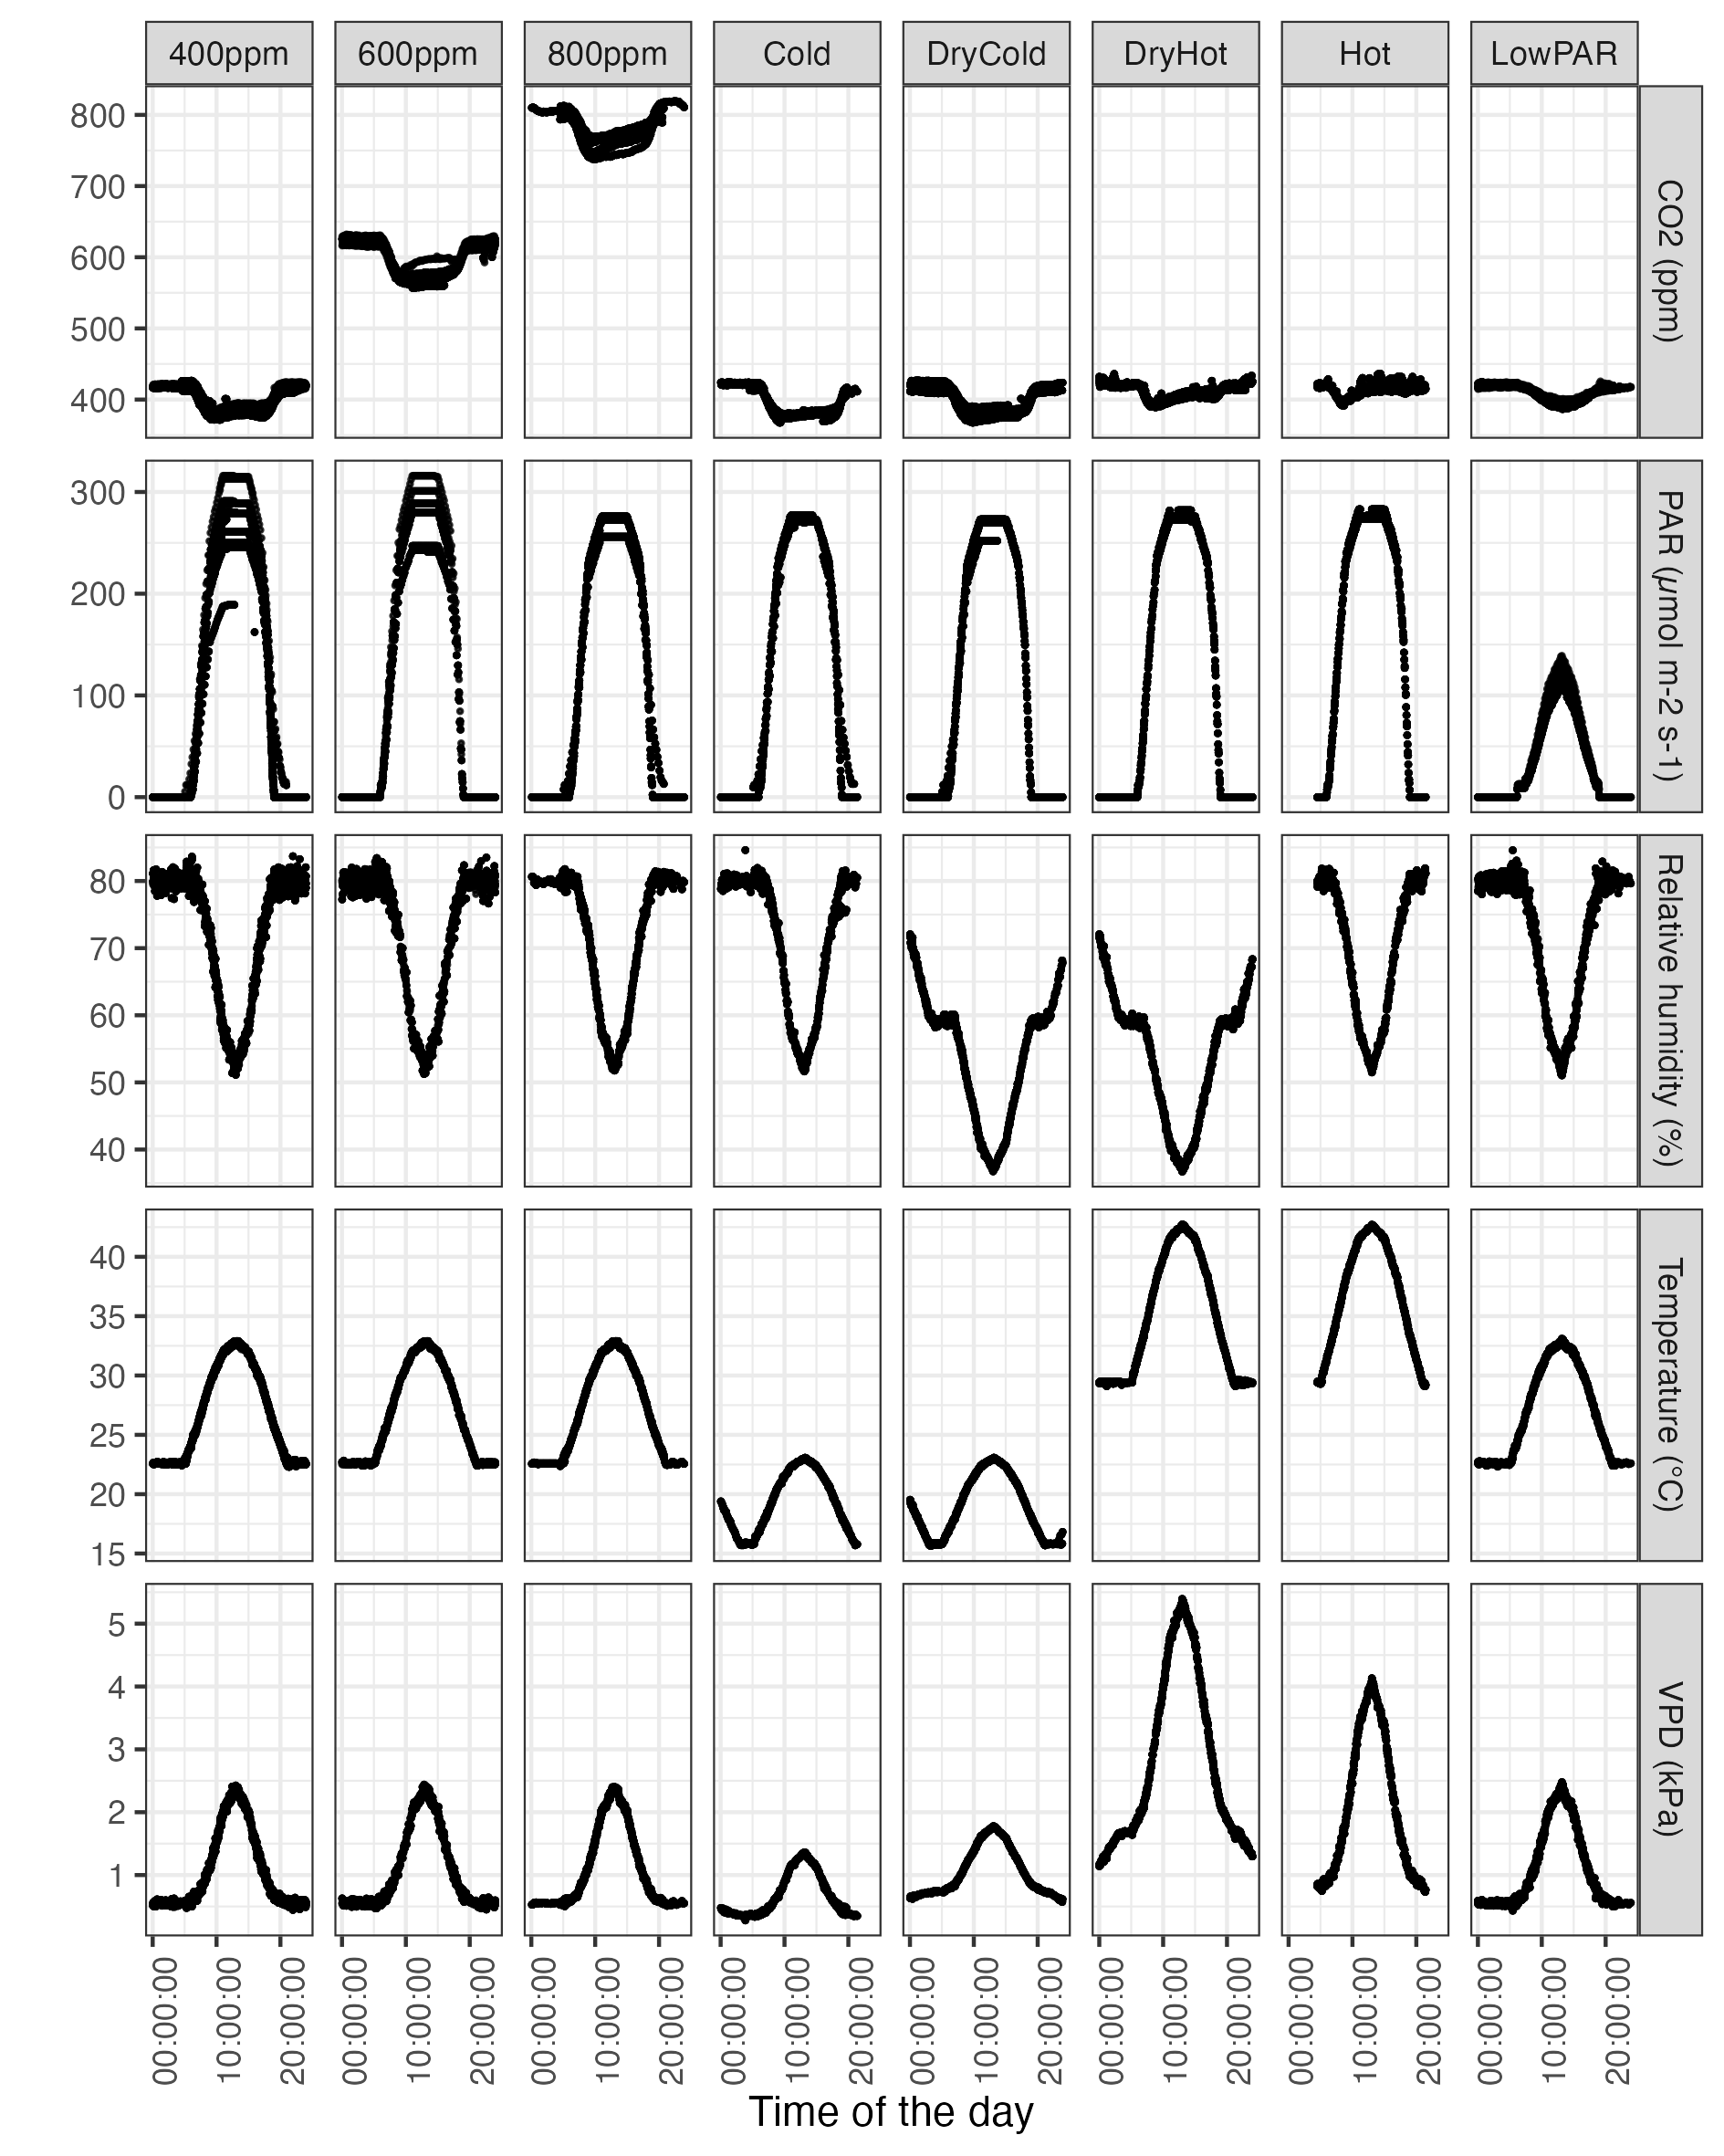
Figure 2 - Monitoring radiation, air temperature, and relative humidity over time for the eight climate scenarios. Points represent measurements recorded every 10 minutes for all the days of a given scenario (one scenario may be applied one or multiple days). Photosynthetically active radiation was measured at the chamber’s centre height. The reference scenario is the ‘400ppm’ scenario (first column). The VPD was calculated following the equation of Buck et al (1981).
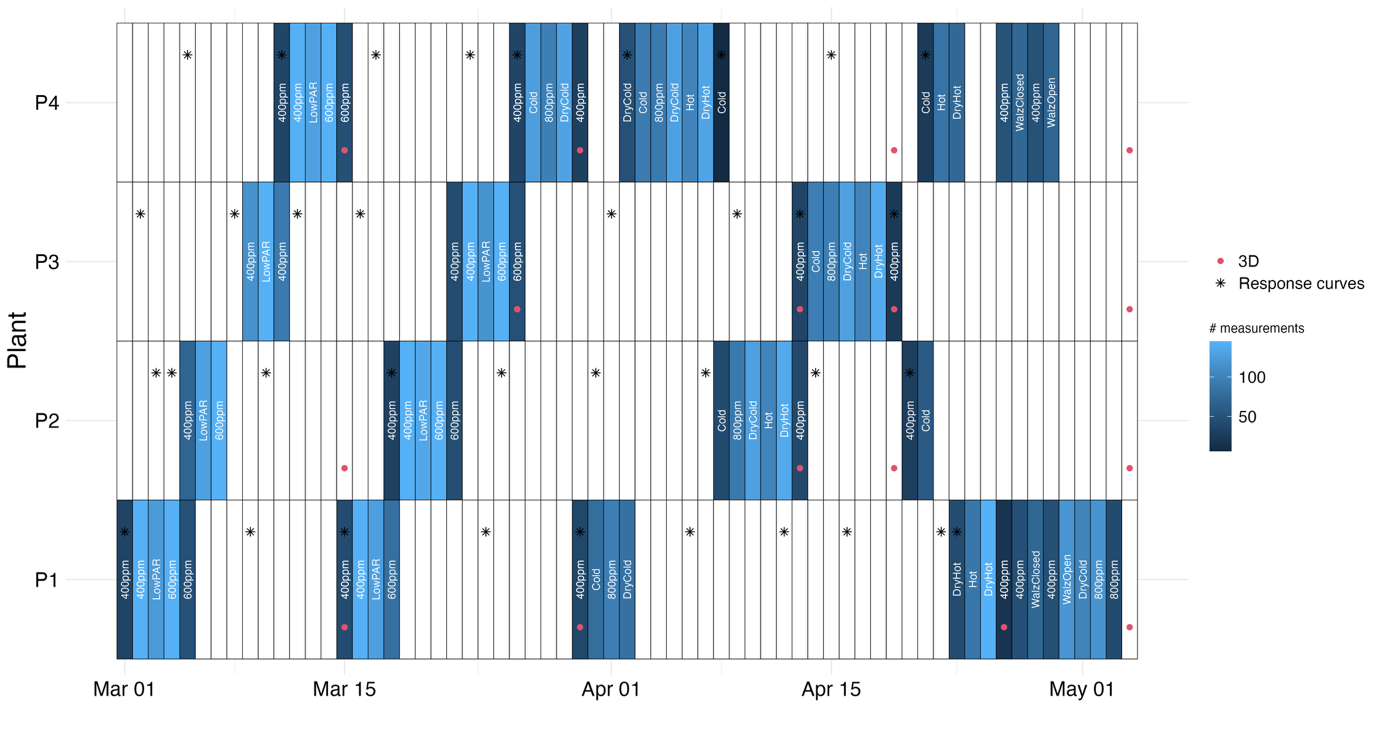
Figure 3 - Climate scenarios set in the monitoring microcosm and the sequence of measurements. White cells with no text indicate dates on which the plant is in the storage microcosm. Points indicate the date of leaf gas exchange measurement (black crosses) and dates of 3D reconstruction of plant’s aerial architecture (red points). Colors refer to the number of plant-level gas exchanges measurements per day.
Three-dimensional mapping of the radiative environment in the microcosm
In addition to the climate inputs discussed in the previous sections, it was essential to accurately simulate the radiative environment to reliably estimate the light intercepted by the plants and the subsequent process of photosynthesis. We conducted specific measurements to assess the spatial heterogeneity of light within the microcosm using a ceptometer (Sunscan, Delta-T, Figure 4). This device was equipped with 60 PAR sensors, each spaced 1.6 cm apart, which allowed for a fine-scale mapping of the light environment. These measurements were performed to thoroughly evaluate 3D reconstruction and their impact on light interception and light transmission within the microcosm. The idea was to measure actual light intensity at multiple points in the space, with or without plant in the microcosm, and compare it with simulated light intensity from 3D simulations.
Measurements were performed under three distinct conditions: i) in an empty microcosm to capture both direct and diffuse radiation; ii) in an empty microcosm with black felt applied to the walls to suppress scattered light and only measure direct light (Figure 4A); and iii) in the microcosm with a plant inside it (Figure 4B).
For the empty chamber, light was measured at four vertical heights (21 cm, 51 cm, 81 cm, and 111 cm from the light source) to capture the vertical distribution of radiation. In the presence of a plant, measurements were taken at the top of the pot (105.4 cm from the light source), and at mid-canopy level (91.5 cm from the light source). At each of these heights, we conducted a horizontal mapping by measuring light at eleven positions spanning from 10 cm to 90 cm across the chamber starting from the left side, with additional measurements at 5 cm and 95 cm to capture edge effects. The pot was placed in the centre of the chamber, approximately 56 cm from the lateral and back walls, and a black net was positioned on the chamber floor in all conditions to minimize light reflections. The light source consisted of four LED spots, selected for its spectral distribution close to natural light (Supplementary Material Figure S1).
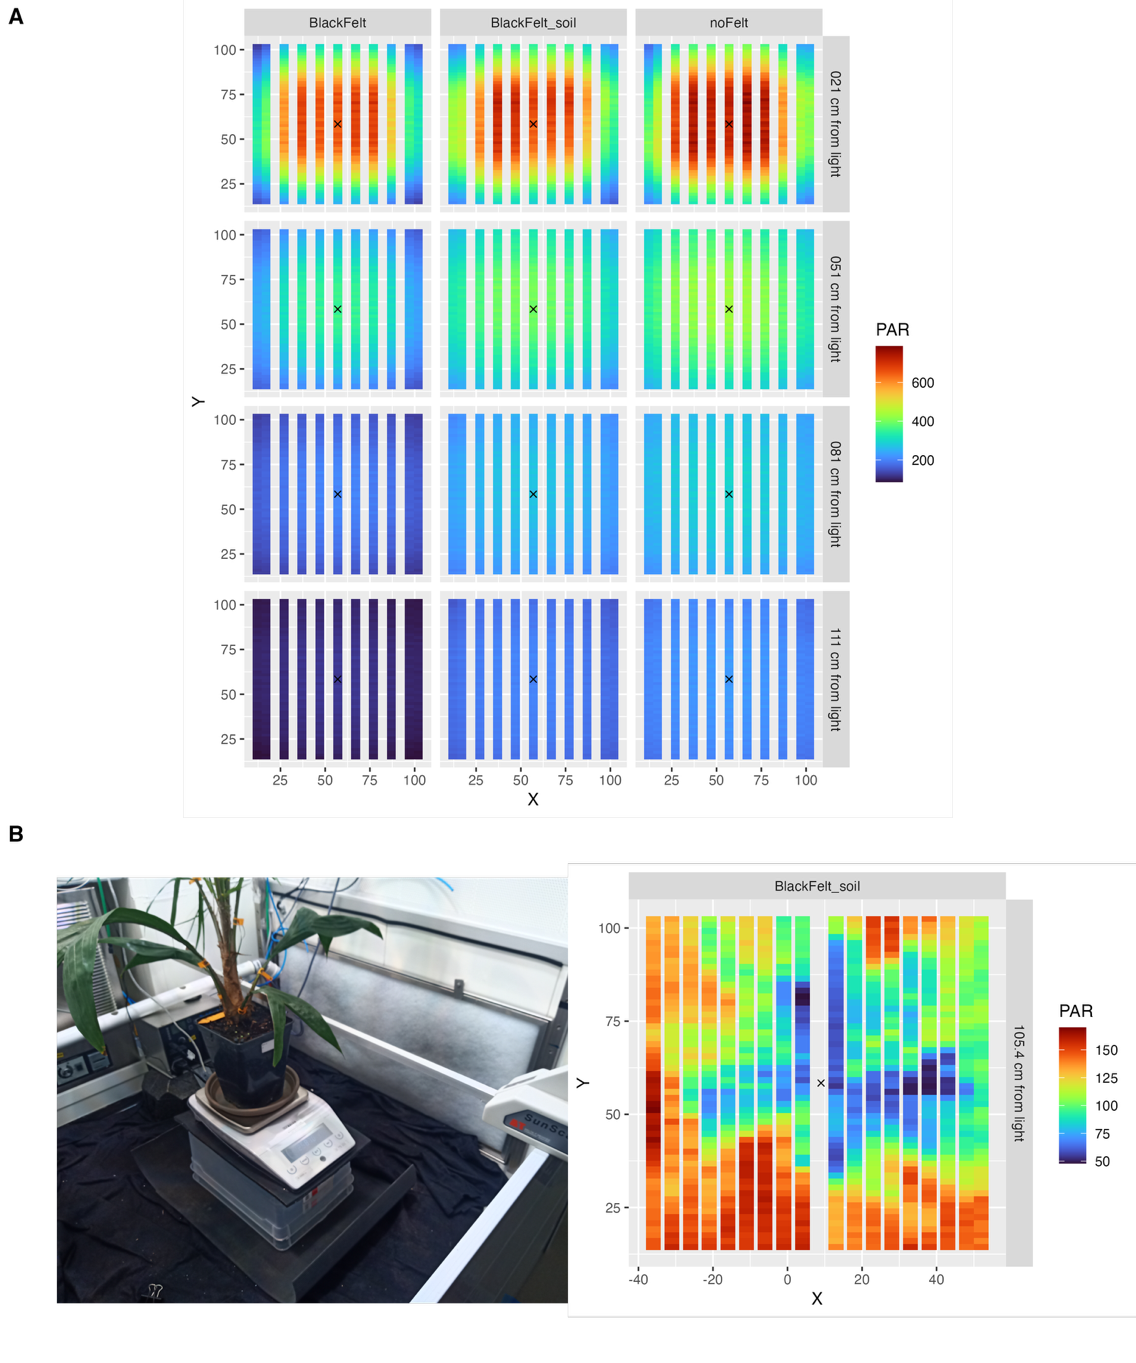
Figure 4 - Mapping of light distribution within the microcosm using a SunScan system (Delta-T) equipped with 60 light sensors. (A) Radiation maps illustrating the spatial variation of light intensity relative to the distance from the light source and the optical properties of the chamber walls and floor, which were either uncovered or covered with black felt to minimize light diffusion (blackfelt: walls and floor covered, blackFelt_soil: only floor covered; noFelt: uncovered walls and floor) (B) Left panel: measurements of light transmission beneath the plant P1 obtained with the SunScan; right panel: corresponding spatial map of photosynthetically active radiation (PAR) intensity beneath the plant. The center of the pot is indicated with a black cross. Colors indicate PAR levels in µmol m⁻² s⁻¹.
Three-dimensional reconstruction of plant architecture
Three-dimensional reconstructions of the plant’s aerial architecture are essential for simulating biophysical processes such as light interception and photosynthesis. To capture the evolution of plant architecture over time, LiDAR scans of the four plants were conducted weekly during the entire period of flux measurements. At least three viewpoints were captured for the co-registration process to accurately represent the whole plant and minimise occlusion issues. To overcome the challenge of distinguishing overlapping leaves in the central region, the leaves were removed from the plant and scanned individually at the end of the experiment. The leaves were placed vertically in sticks and sorted according to their rank. Three viewpoints were captured for the co-registration of the cut leaves. This step enabled detailed reconstruction of each leaf, particularly in the densely overlapping central regions, and the bulb without interference from adjacent foliage. Leaves and bulb reconstructions were carried out manually in Blender (Blender Development Team, 2022). Using plane meshes fitted to the leaf point clouds via the poly build tool with automatic vertex merging (Figure 5A), each organ was reconstructed separately and exported as a ‘ply‘ file. Since the morphology of oil palm leaves does not change over time once they are emitted (no more elongation and expansion), we leveraged the individual leaf reconstructions to guide the plant-scale point clouds reconstructions. Starting with the latest LiDAR scan (which was closest in time to the individual leaf scans), we integrated these detailed leaf reconstructions into the overall reconstruction. Then, proceeding chronologically backward, we manually modified and adjusted the meshes to fit the point clouds of preceding dates, using the later reconstructions as references. This sequential, reference-based approach enhanced the consistency and accuracy of the reconstructions over time (Figure 5B).
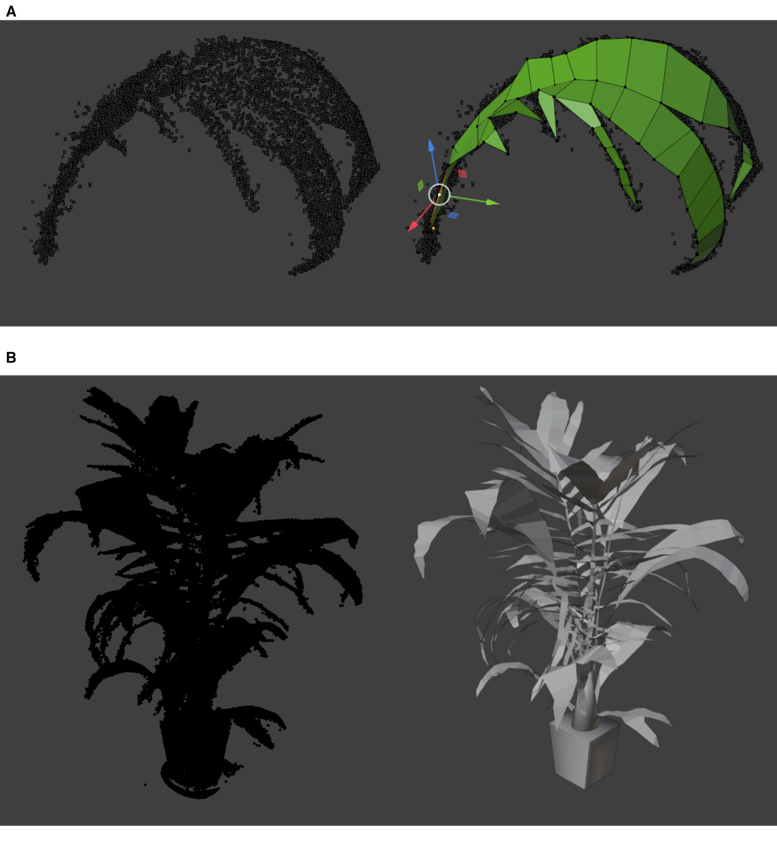
Figure 5 - 3D reconstruction from LiDAR point clouds. A) Building plane meshes on point cloud with the poly build tool of Blender. B) Full reconstruction of the 3D mock-up from points cloud.
For each plant and climate scenario applied in the microcosm, we selected the LiDAR point cloud that best represented these dates for reconstruction. Due to the heavy time-consuming process of 3D reconstruction and the slow development of the plants, we did not use all the LiDAR scans to reconstruct 3D mock-up. Three to four dates were chosen that best corresponded to a complete daily flux measurement for each scenario and plant (Figure 3). These 3D mock-up captured the evolution of the plant architecture for each plant (see supplementary Figure S3).
In the final step, each ply reconstruction file was converted into an Open Plant Format (OPF, Griffon & de Coligny, 2014), a portable file that stores both plant topology and geometry and is commonly used in simulation models of biophysical processes. The plant topology was defined by six symbols: Plant, Pot, Bulb, Stipe, Leaf and Spear (leaf without expanded leaflets).
Carbon Dioxide (CO2) and water vapor (H2O) flux data
Leaf-level CO2 and H2O gas exchanges
Leaf gas exchange measurements were performed with a Walz GFS-3000 portable gas analyser with a Walz PAM-Fluorometer 3056-FL (Walz, Effeltrich, Germany) and a cuvette area of 8 cm2. The penultimate leaf fully expanded was measured in the storage microcosm during the experiment (responses curves, Figure 6) before and after the plant was placed under a climate scenario sequence. Measurements were not taken during the application of the scenario to avoid any disturbances such as plant handling, opening doors, or changes in radiation caused by the gas analyzer. Instead, measurements were conducted before and after the sequence to assess both the stability of the measurements and the potential impact of the stress scenario on photosynthetic performance.
At each date, the last leaf fully expanded was selected for conducting photosynthesis response to CO2 (A~Ci curves), followed by the photosynthesis response to photosynthetic photon flux density (A~PPFD curves) and stomatal conductance response to vapour pressure deficit (Gs~VPD). The A~Ci curves were performed at a saturating PPFD of 1500 µmol m⁻² s⁻¹, a controlled cuvette air temperature of 25°C, a relative humidity of 65%, a constant air flow rate through the cuvette of 750 mL min-1, and decreasing [CO2] from 400 to 50 ppm, then increasing it from 400 to 2000 ppm in 13 steps of [CO2] in total. Measurements during the A~Ci curves were performed every 90 seconds.
The A~PPFD curves were performed after an acclimation to ambient CO2 of 6 minutes after the A-Ci curves. The temperature and relative humidity were maintained at 25°C and 65% as for the A-Ci curves and the light was decreased in 9 steps of PPFD from 1500 µmol m-2 s⁻¹ to 10 µmol m² s⁻¹. Measurements during the A~PPFD curves were performed every 180 seconds.
The Gs~VPD curves were measured in 7 steps from 0.7 kPa to 2.5 kPa at 1500 µmol m² s⁻¹ of PPFD and 400 ppm [CO2]. The VPD was controlled by changing the relative humidity (from 75% to 30%) and the air temperature (from 23°C to 27°C). Measurements during the gs~VPD curves were performed every 120 seconds.
The three response curves can be used to estimate the parameters of coupled leaf photosynthesis and transpiration models (Busch et al., 2024). In the dataset, we used the A~Ci curves to estimate the parameters from the Farquhar-von Caemmerer-Berry (FvCB) of C3 photosynthesis (Farquhar et al., 1980) at a reference temperature of 25°C using the temperature-dependent parameters from Kumarathunge et al. (2019), except for the rate of decrease of the function above the optimum for the rate of electron transport (Hdj) and rubisco activity (Hdv) that were taken from Dreyer et al. (2001) and Medlyn et al. (2002). The estimated parameters included the maximum rate of RuBisCO carboxylation (Vcmax), the maximum potential electron transport rate (Jmax), the rate of mitochondrial respiration (Rd) and the triose phosphate utilisation rate (TPU, Figure 6a). Response curves to VPD were used to estimate the parameters of Medlyn’s stomatal conductance model (Medlyn et al., 2011), i.e. the residual stomatal conductance (g0) and the slope parameter (g1, Figure 6b), although other models could be used.
Leaf gas exchange sensitivity to plant-scale radiation
At the end of the experiment, from 27th to 30th April, additional scenarios called WalzClosed and WalzOpen, were conducted on two plants to assess the correlations between leaf-level gas exchanges and plant-level gas exchanges (Figure 3). The aim of these measurements was to investigate the sensitivity of leaf gas exchange to incoming radiation at the whole-plant scale. We hypothesized that, although saturated light is applied within the leaf gas analyzer chamber, CO2 assimilation also depends on the plant overall radiative environment (Ngao et al., 2021). This assumption was justified by the lag in leaf response between the portion inside the gas analyzer head and the rest of the leaf. High variability in leaf gas exchange measurements on oil palm has been previously observed (personal communication) and could be attributed to variations in the light environment outside the gas analyzer head.
The plant was placed in the flux chamber, with one leaf attached to the Walz portable gas analyser. At the plant scale, the climate conditions (temperature, relative humidity, [CO2]) within the microcosm followed the reference scenario (400 ppm), except for the radiation that drastically change from shading periods to full light periods. Starting at 2 pm, shading periods were applied every 15 minutes for 5 minutes each, with incremental decreases in incident radiation of 25%, 50%, 75%, and 95%. Then, in reverse order, shading periods were applied with incremental increases in incident radiation, following shading levels of 75%, 50%, and 25% (supplementary material Figure S2). At the leaf scale, the conditions within the Walz’s head followed the climate conditions applied at the plant scale within the microcosm, while the light was either at saturation (1500 μmol m-2 s-1; scenario WalzClosed) or following the light conditions in the microcosm by removing the light component from the head (scenario WalzOpen).
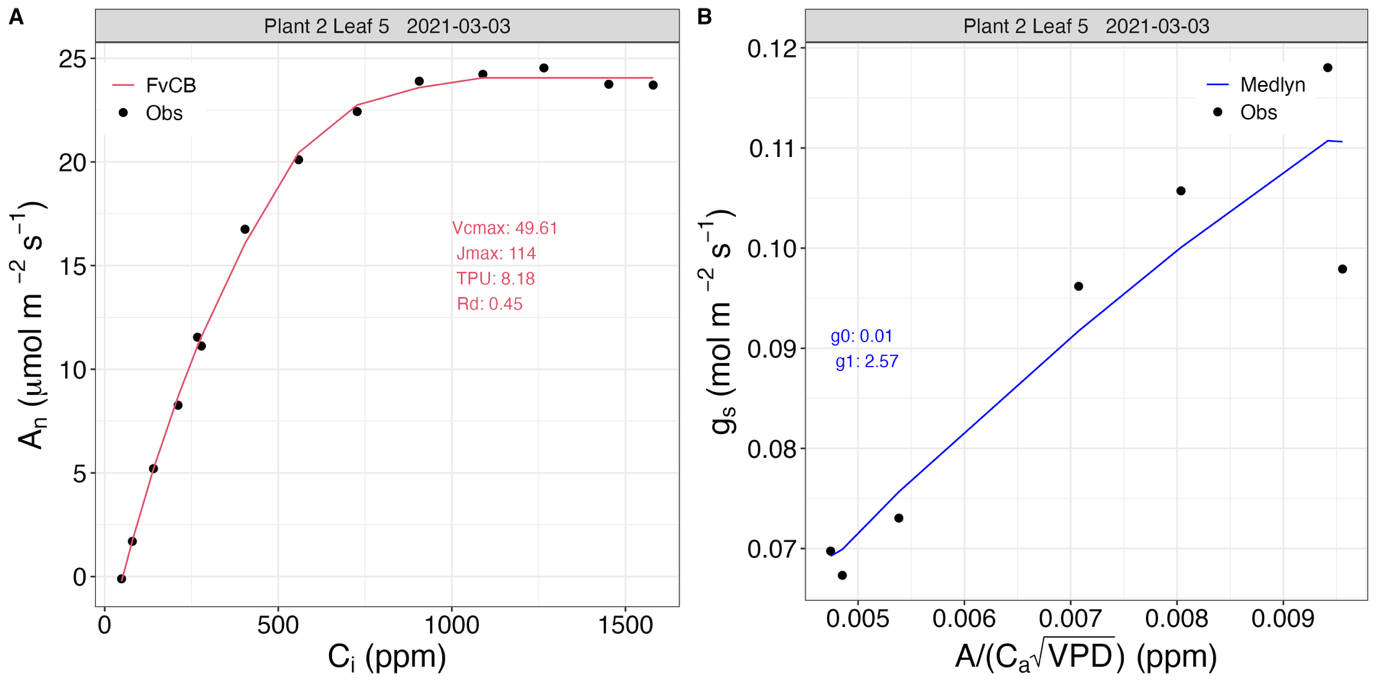
Figure 6 - Calibration of photosynthesis and stomatal conductance models from leaf gas exchange responses curves. A) A~Ci response curve fitted with the Farquhar-von Caemmerer-Berry (FvCB) model. B) The gs~VPD (Dl) response curve is fitted with Medlyn’s stomatal conductance model (Medlyn et al., 2011).
Plant-level CO2 and H2O gas exchanges
The net flux of CO2 was calculated from the inlet and outlet fluxes following:
\(N = D(C_{in} - C_{out}\))
Where N is the net flux of CO2, in µmol s-1, D is the flow rate of air at the inlet of the chamber, in µmol s-1, Cin and Cout are the mixing ratio of CO2 corrected for dilution by water vapour, respectively at the inlet and outlet of the chamber, in µmol mol-1.
Because the pot of the plant was sealed, any variation in the weight measured from the scale could be attributed to plant transpiration. Large increases in pot weight were used as indicators of irrigation. Transpiration was then estimated using two different methods. The first method measured the difference in pot weight between the start and end of a specified time interval. The second, known as the regression method, determined transpiration by calculating the slope of a linear regression fitted to all weight measurements within that interval.
Transpiration and CO2 fluxes showed contrasting variation during the day depending on the climate scenarios (Figure 7). The highest transpirations were recorded under the reference scenario and the ‘dry hot’ scenario. Interestingly, the ‘hot’ scenario showed the lowest level of transpiration and CO2 assimilation. Results showed consistent behaviour among plants, with the highest value of assimilation under 600 ppm of [CO2] and the lowest under the ‘hot’ scenario. Results also demonstrated good consistency across repeated measurements of the same scenario on the same plant (see Figure 11). The water use efficiency, calculated as the ratio of assimilated carbon dioxide over the transpired water, showed to be the highest under 800ppm and the lowest under the ‘dry hot’ scenario.
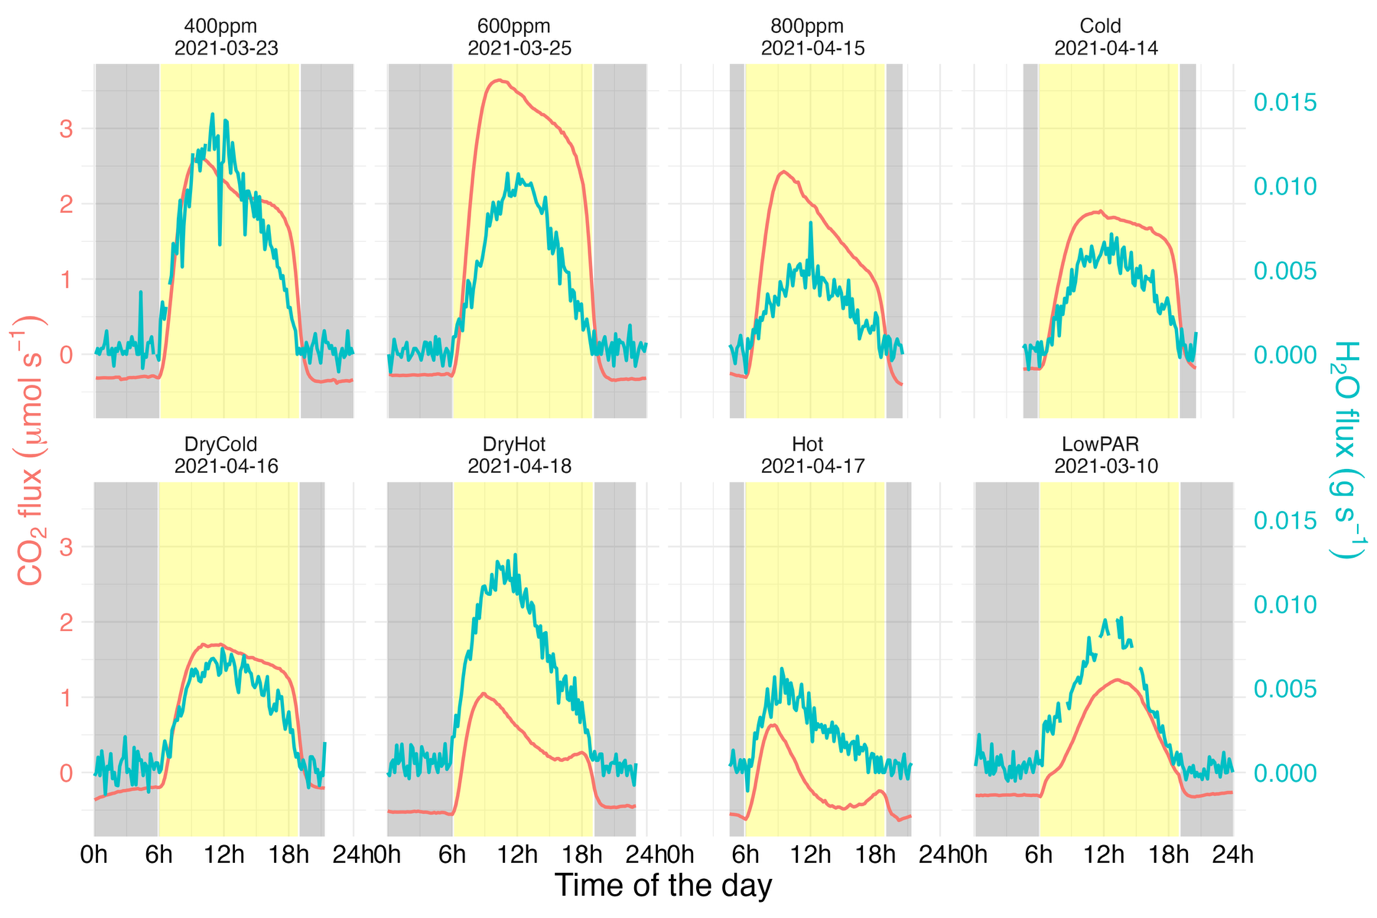
Figure 7 - Measured CO2 and H2O fluxes over a day for a single plant (P3) depending on the climate scenario. Each facet represents the fluxes for one scenario. Yellow bands indicate the daytime period from 6:00 AM to 7:00 PM.
Leaf chlorophyll content
The chlorophyll content of leaves was measured with a SPAD chlorophyll meter (SPAD-502; Minolta, Ltd., Japan). At the beginning of the experiment (February 16th and 23rd), SPAD readings were taken on every leaf of all the plants. The SPAD value was calculated as the average of four measurements taken from the middle section of the leaf, corresponding to the area where gas exchange measurements were conducted. Then, SPAD measurements were repeated on all leaves of each plant prior to conducting leaf gas exchange measurements in the microcosm. These data were collected to evaluate models that enable the upscaling of leaf gas exchange from the leaf level to the whole-plant scale, specifically examining the relationship between variations in photosynthetic parameters and chlorophyll content. For example, SPAD readings can serve as a proxy for nitrogen content, which in turn, can be linearly related to the Farquhar parameter, as proposed by Prieto et al. (2012).
Leaf temperature
Leaf temperature primarily varies with air temperature, but it is also influenced by the state of the stomata, as stomatal opening can cool the leaf through transpiration. Typically, leaf temperature is an output of biophysical models. Therefore, measuring leaf temperature over time and assessing the spatial distribution of these temperatures within the plant can serve as valuable variables for evaluating the accuracy of biophysical processes.
Leaf temperature was measured with a FLIR Vue™ Pro R thermal camera triggered by a Raspberry Pi to take one image every second automatically. The camera was installed on the top left corner of the chamber and oriented toward the centre of the microcosm to ensure optimal coverage of the plant canopy. A calibration process was performed using objects with known temperature. Images were continuously recorded from March 2nd to May 3rd and later processed to extract regions corresponding to identifiable leaves from each frame. For every image, fixed masks were defined manually to isolate the maximum consistently visible area of each leaf over time, accounting for slight movements induced by wind inside the chamber (Figure 8). As a result, leaf temperatures were calculated over time for each pixel of the masks, after adjusting for air temperature and relative humidity within the chamber. Finally, the mean, maximum, minimum and standard deviation of the temperatures within each mask were computed.
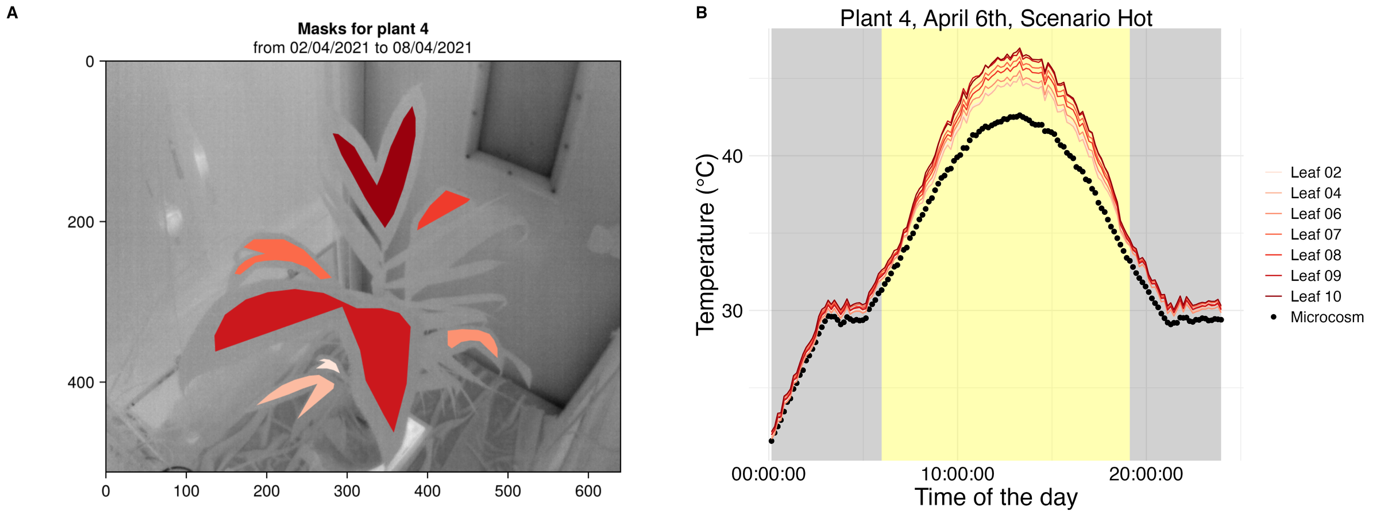
Figure 8 - A) Masks of leaf area for estimating leaf temperature. The mask is located at the centre of the leaf to avoid capturing image pixels that may not consistently represent the leaf due to internal chamber wind. The colours represent the different masks of the monitored leaves. B) Temperatures of leaves and the air temperature (black points) over a day. Example on April 6th during the “Hot” scenario on plant 4. The yellow band indicates the daytime period from 6:00 AM to 7:00 PM.
Technical validation and usage notes
Quality of plant reconstruction
The quality of the virtual reconstructions was assessed by comparing the area of each virtual leaf to measurements obtained with a leaf area meter (Licor LI-3100C) at the end of the experiment. The results demonstrated a high level of agreement between the measured and reconstructed leaf areas (R2=0.99 and slopes close to 1 for the four plants; Figure 9).
Estimating plant leaf area from a 3D mock-up enabled to estimate the evolution of leaf area growth throughout plant development (Figure 10) and assess the fluxes per unit of leaf area. The leaf area increased over time, demonstrating a consistent and coherent estimation of this variable across successive 3D plant reconstructions.
Replicability of fluxes measurements
Scenarios were successively applied to plants, potentially affecting their physiology over time. Although the most stressful scenarios (Hot and DryHot) were applied at the end of the sequence, repeated exposure to stress conditions may progressively impact the photosynthetic apparatus. To explore this, some scenarios were repeated on the same plants to evaluate changes in physiological responses when possible (see Figure 3). Figure 11 illustrates the dynamics of CO2 fluxes for each scenario and plant, including the repeated measurements to appreciate this potential changes. It is important to note that the observed changes may result from the confounding effects of plant age (particularly changes in plant leaf area) as well as adaptation to stressful conditions. The dynamics observed in repeated scenarios on the same plant, as well as between different plants across scenarios, showed similar patterns, highlighting the value of the dataset for revealing the effects of climate conditions on gas exchange fluxes.
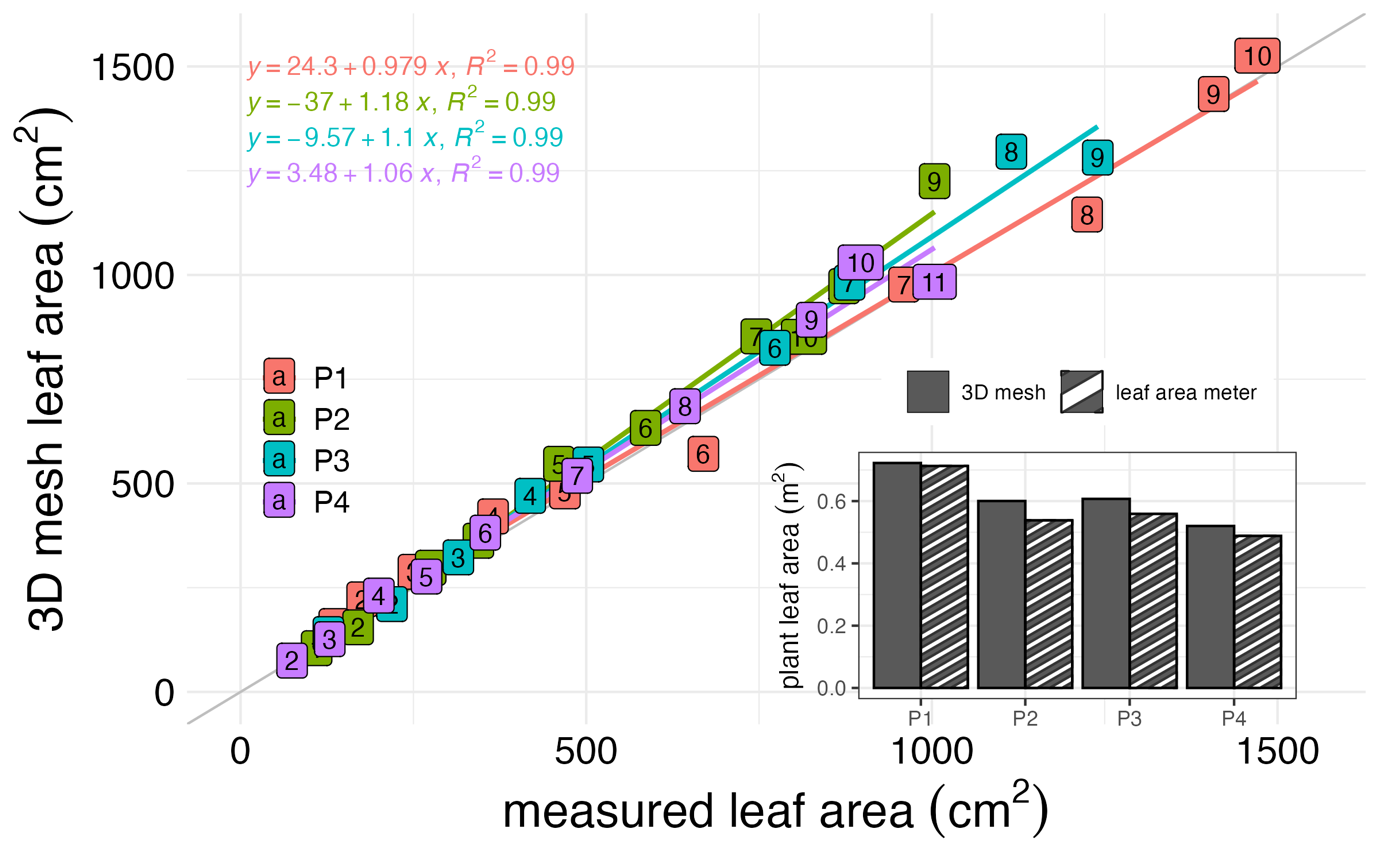
Figure 9 - Evaluation of 3D reconstructions based on leaf area. Leaf numbers are indicated within each data point, while colors correspond to individual plants. The inset compares the total leaf area per plant estimated from the 3D mesh with measurements obtained using a leaf area meter at the end of the experiment (4th May).
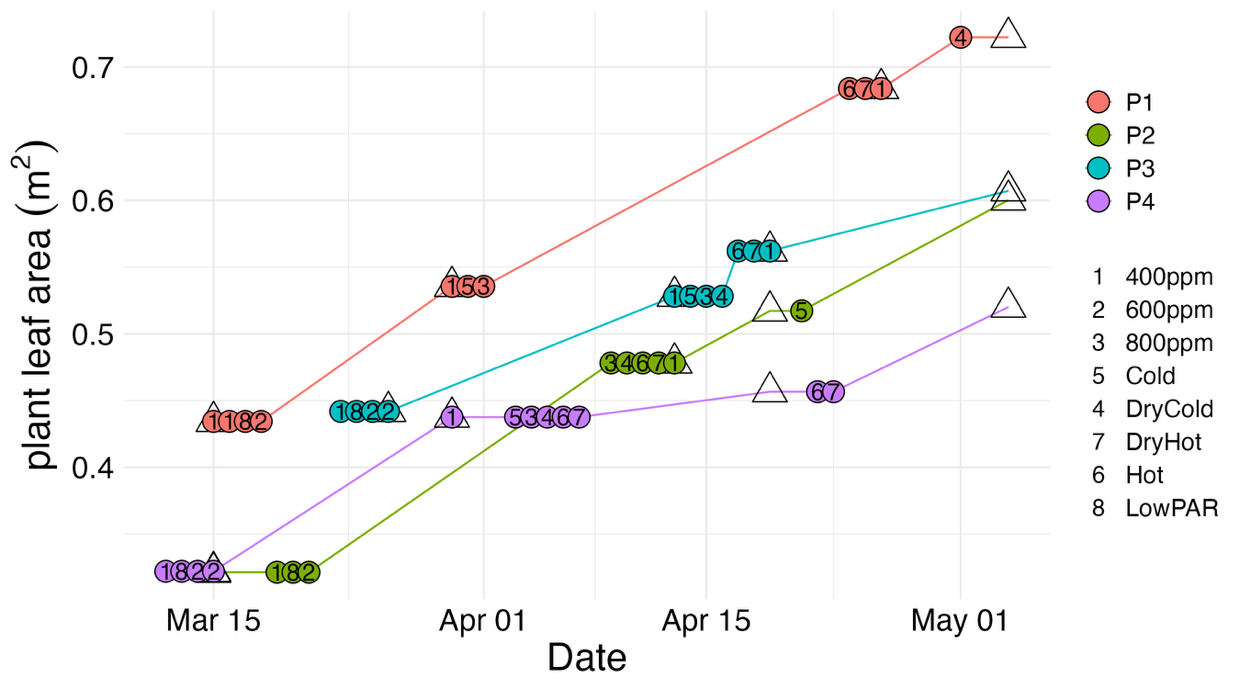
Figure 10 - Plant leaf area was estimated from 3D mock-ups over time for each plant. The numbers indicate the corresponding main scenario applied on each date in the microcosm, along with the associated plant leaf area. Triangles indicate the dates when LiDAR scans were taken.
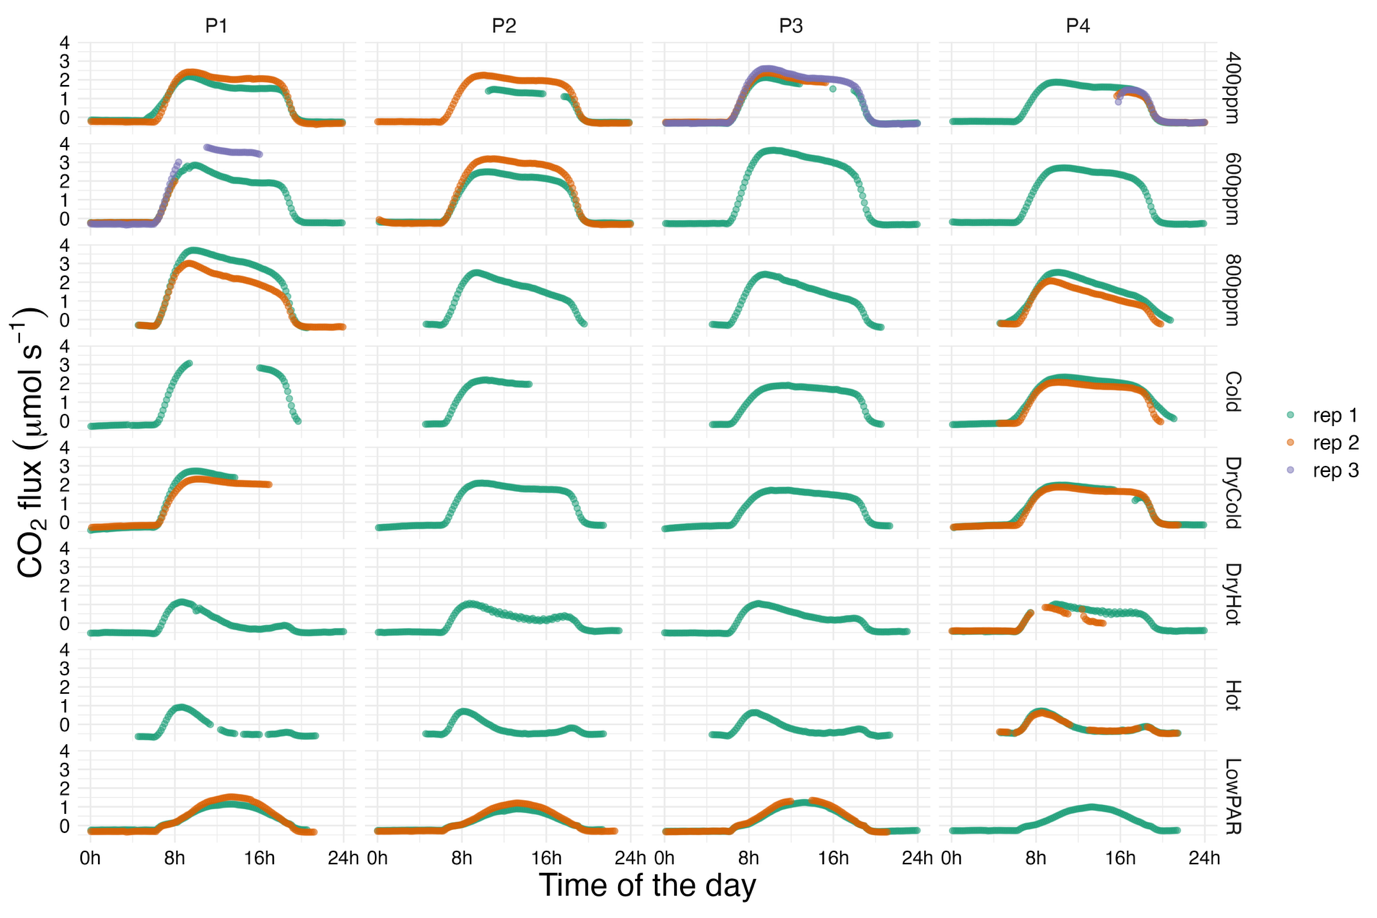
Figure 11 - Daily Measured CO2 fluxes over a day for the four plants under the eight climate scenarios. Colors represent different days when repeated measurements of the same scenario on the same plant occured. Only the days with at least height hours of measurements are represented.
Impact of plant light environment on leaf-level gas exchange measurements
Leaf gas exchange measurements were conducted on plants located in the microcosm, where there were significant variations in the incoming light to the plants. Although the photosynthetic photon flux density (PPFD) received by the plants at mid-height in the chamber was low, small fluctuations in the light source affected the measured assimilation at the leaf scale (Figure 12). Assimilation varied both when the light in the portable head chamber was saturated (WalzClosed) and when it followed the incoming light of the microcosm (WalzOpen). Assimilation dropped sharply in response to changes in microcosm light, then increased again with a slight delay after light conditions improved. However, these changes in assimilation were less pronounced under WalzClosed than under WalzOpen scenario. These results highlight the sensitivity of leaf-scale measurements to the overall light environment of the plant and emphasize the importance of maintaining consistent and equivalent ambient light conditions at the plant scale when performing leaf-scale assimilation measurements to calibrate photosynthesis models or compare physiological performances.
Using the dataset for calibrating and assessing biophysics models using FSPM
By integrating detailed structural data with physiological measurements at both the leaf and whole-plant scales, this database will enable the construction and evaluation of digital twins (or digital shadows) of plants under controlled conditions. To achieve this, the following calibration procedure for digital twins can be applied. In the first step, a light interception model can be calibrated using the plant 3D structure along with spatially recorded light mapping inside the chamber. By fitting the simulated light outputs to the measured radiation at various positions within the microcosm (both with and without the plant), the intensity and positions of the light sources can be accurately estimated in the simulations.
In the second step, the photosynthesis response curves may be used to calibrate models of photosynthesis and stomatal conductance to simulate carbon assimilation and transpiration. We propose using the parameters of Farquhar-von Caemmerer-Berry (FvCB) of C3 photosynthesis (Farquhar et al., 1980), i.e Vcmax,Jmax and TPU, as well as the parameters from Medlyn’s stomatal conductance model (Medlyn et al., 2011), namely g0 and g1. Additionally, the raw data allow estimation of other parameters derivable from the response curves. The coupling of these physiological processes with the outputs of light interception simulations enables the modelling of plant carbon assimilation and transpiration.
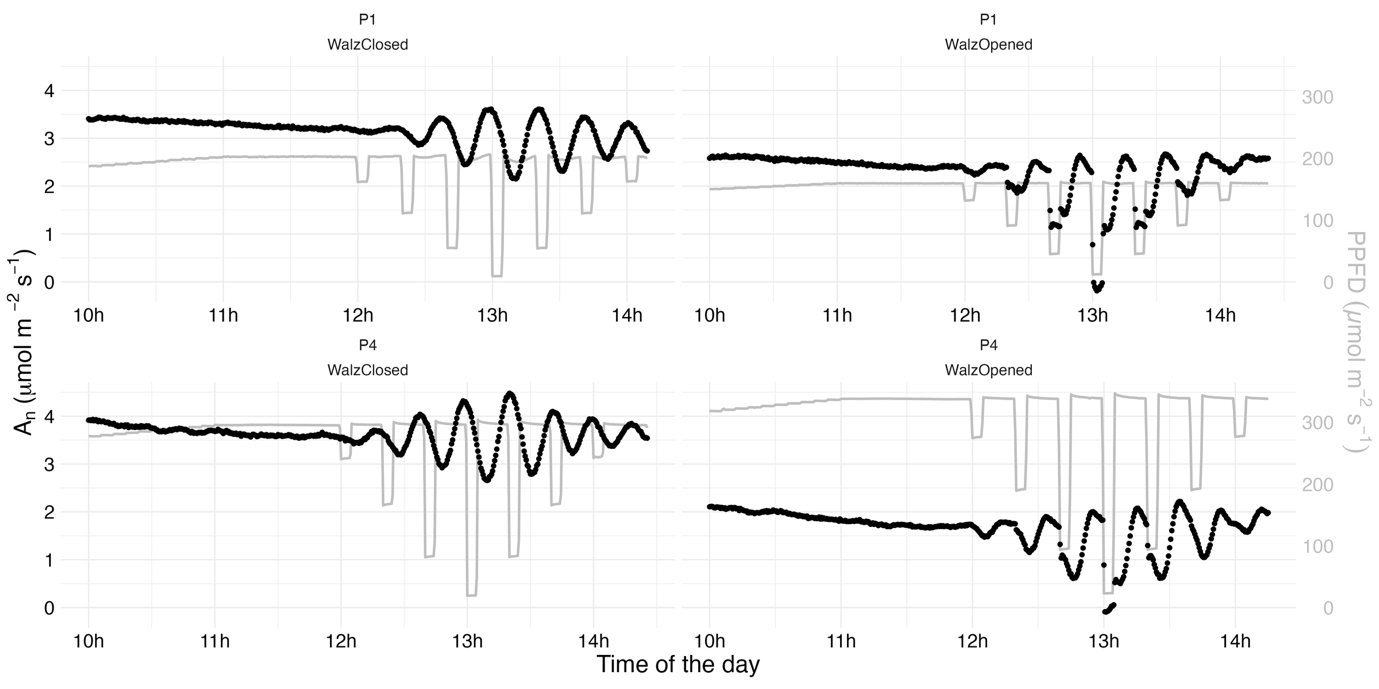
Figure 12 - Net carbon assimilation (An) over time for two plants (P1 and P4) under saturating light conditions (WalzClosed, 1500 µmol m⁻² s⁻¹) or ambient microcosm light (WalzOpen) transmitted to the measured leaf in the Licor head chamber. The grey lines represent the ambient light measured by the PAR sensor in the microcosm (right axis).
Finally, the simulated CO2 fluxes and transpiration rates can be compared with the recorded measurements to assess the accuracy of the physiological models used, depending on the scenario and plants selected. Simulations of leaf temperature can also be compared to measurements provided in this database (Albasha et al., 2019)
Acknowledgements
The authors have been supported by the MaCS4Plants CIRAD network, initiated from the AGAP Institute and AMAP joint research units. Preprint version 4 of this article has been peer-reviewed and recommended by Peer Community In Plants (https://doi.org/10.24072/pci.plants.100036; Gawinowski, 2026). The authors would like to express their gratitude to the reviewers and the recommender for their insightful comments and suggestions.
Funding
This work was financially supported by the SMART Research Institute (SMARTRI, Smart Tbk.).
Conflict of interest disclosure
The authors declare that they comply with the PCI rule of having no financial conflicts of interest in relation to the content of the article.
Data, scripts, code, and supplementary information availability
The raw data and scripts used to generate the final database are detailed and accessible on Zenodo (https://doi.org/10.5281/zenodo.12705929; Vezy et al., 2025a), the code is also accessible via a Github repository (https://github.com/PalmStudio/Biophysics_database_palm), and we also provide a companion website (https://palmstudio.github.io/Biophysics_database_palm) showing how computations were made and the main results. The code to trigger the FLIR camera and for logging the precision scale data is also available on dedicated Zenodo repositories (https://doi.org/10.5281/zenodo.14862498; Vezy, 2025b & https://doi.org/10.5281/zenodo.14862494; Vezy, 2025c). Supplementary information is available online: https://doi.org/10.5281/zenodo.21979605 (Perez & Vezy, 2026)