


 CC-BY 4.0
Introduction
Per- and polyfluoroalkyl substances (PFAS) are widespread environmental contaminants, several of which are highly persistent (Evich et al., 2022; Martinon et al., 2026; Wee & Aris, 2023). Their binding affinity to proteinaceous tissue (Jones et al., 2003) enables these substances to bioaccumulate in living organisms, even at low environmental concentrations (Groffen et al., 2025). PFAS can subsequently be transferred through the food web to other organisms, resulting in even higher accumulated tissue concentrations at higher trophic levels (van den Heuvel-Greve et al., 2026). High PFAS concentrations have indeed been found in many species across the globe (Bonato et al., 2025; Evich et al., 2022; Giesy & Kannan, 2001; Kelly et al., 2009; Vendl et al., 2024), including humans (Kannan et al., 2004), and this may ultimately lead to negative health outcomes, including endocrine disruption, immunotoxicity, lipid and insulin dysregulation and increased risk of cancer (Fenton et al., 2021; Grandjean et al., 2020; Mišľanová & Valachovičová, 2025). For humans, food is the most important exposure source of PFAS and particularly animal products, like fish and seafood, offal, and game meat (Ericson et al., 2008; Wee & Aris, 2023). In 2020, the European Food Safety Authority (EFSA) derived a tolerable weekly intake (TWI) of 4.4 ng/kg body weight per week for the sum of four PFAS: perfluorooctane sulfonic acid (PFOS), perfluorooctanoic acid (PFOA), perfluorononanoic acid (PFNA) and perfluorohexanesulfonic acid (PFHxS) (EFSA CONTAM Panel et al., 2020). These four PFAS are hereafter referred to as the EFSA-4. The TWI was based on epidemiological evidence linking prenatal and early-life PFAS exposure to a significantly reduced antibody response to vaccines in children (Grandjean et al., 2017). Recent biomonitoring confirms widespread PFAS exposure in the Dutch population (Bil et al., 2025). To reduce dietary exposure, the European Commission has set maximum levels (MLs) for four PFAS, as well as their combined total, for specific foods sold commercially, like fish, meat, and eggs (Commission Regulation (EU) 2023/915 of 25 April 2023 on Maximum Levels for Certain Contaminants in Food and Repealing Regulation (EC) No 1881/2006, 2023). In backyard chicken eggs, which are generally produced for private consumption rather than commercial sale, PFAS concentrations can be particularly high, and may exceed the maximum levels established for commercially sold eggs as set by the EU or other national legislative bodies (Lasters et al., 2022). Despite considerable among-site variability in PFAS concentrations in eggs, several regional and national health authorities have published advice ranging from consumption limits to advising against consumption, as done by the Dutch National Institute for Public Health and the Environment (Nederlof et al., 2025).
The PFAS contained in backyard eggs originate from multiple environmental pathways, with industrial fluorochemical emissions representing an important historical source (Lasters et al., 2024). In the Netherlands, the Chemours (formerly DuPont) factory in Dordrecht has been a dominant contributor of PFOA, leading to regional contamination (van Poll et al., 2017). Other sources include the historical use of PFAS-containing firefighting foams at airports and military bases, and some PFAS-processing industries such as paper- and textile factories (Lendewig et al., 2025; Pervez et al., 2025), which have resulted in contamination hotspots in both soil and groundwater (Eschauzier et al., 2013; Filipovic et al., 2015; Sadia et al., 2023). Wastewater treatment plants (WWTPs) also act as conduits, releasing PFAS via treated effluent and concentrating them in sewage sludge (Derksen & Baltussen, 2021). Using and disposing of PFAS-treated consumer products, including end-of-life waste streams such as landfills, also adds PFAS to the environment and pollutes nearby water and soil (Glüge et al., 2020).
From these industrial and smaller localized sources, PFAS and their precursors can travel through surface and groundwater (Ahrens & Bundschuh, 2014) and through the atmosphere (Wallington et al., 2006), and return to land via wet and dry deposition (Ahrens & Bundschuh, 2014; D’Ambro et al., 2021). PFAS discharged from industrialized areas into rivers can eventually reach the marine environment, and along the coast, re-emission via sea-spray aerosol can enhance coastal deposition (Sha et al., 2024). Deposition or influx of PFAS, including in residential areas, can contaminate soil and water, allowing these substances to accumulate in living organisms. Bioaccumulation of PFAS has been documented in aquatic and terrestrial invertebrate fauna, including annelids such as aquatic oligochaetes (Higgins et al., 2007) and earthworms (Navarro et al., 2016), as well as other soil fauna, including snails, slugs, isopods, and spiders collected near industrial emission sites (Buytaert et al., 2025; Vrijenhoek et al., 2026). This bioaccumulation acts as an amplification mechanism, converting low concentration soil contamination into high-dose dietary inputs for predators of soil fauna (Burkhard & Votava, 2023).
Free-ranging backyard hens can also be exposed to PFAS by incidental ingestion of contaminated soil, (drinking) water, kitchen leftovers and by foraging on soil fauna (Lasters et al., 2022; Wilson et al., 2021). After ingestion, a large proportion of PFAS are eventually released in developing eggs. Controlled feeding experiments have demonstrated high maternal transfer efficiencies, with up to 99% of ingested PFOS and 49% of PFOA being transferred to the eggs. Consistent with this rapid transfer, PFOS levels in eggs decline quickly after exposure ends, showing a half-life of 4.3 days (Kowalczyk et al., 2020). The variability in environmental and biological processes related to PFAS intake and the rapid release to eggs plausibly contribute to the apparent small-scale spatial variability observed in home-produced eggs (Vrijenhoek et al., 2026). For several PFAS, a significant portion of this variability could be attributed to local environmental factors, including proximity to the source, physicochemical soil properties and PFAS levels in local feed sources, such as homegrown crops and earthworms (Lasters et al., 2023). While these enclosure-specific factors appear to play a significant role in shaping PFAS concentrations in eggs, the contribution of many other local determinants, such as outdoor space per hen, flock size, and the number of eggs laid per hen per week, remains poorly understood.
To create insight and transparency regarding the PFAS concentrations observed in chicken eggs in the Netherlands, the website pfasinkaart.nl was created at the initiative of Van Donselaar. On this citizen-science website, backyard chicken owners can voluntarily register concentrations of the EFSA-4 PFAS in eggs as measured by the accredited laboratories commissioned by the users. In addition, contextual information was provided on the location, the flock size and egg-laying frequency, chicken housing, feed type, and water source. We hypothesised that variation in egg PFAS concentrations would be associated with both regional contamination patterns and local husbandry variables, particularly those influencing hens’ access to soil and soil fauna. We therefore aimed to identify which registered variables best explained the observed variation. A unique strength of this study is the voluntary contribution of test results and contextual data by private chicken owners, enabling the creation of the first large-scale dataset on PFAS in home-produced eggs in the Netherlands, providing a large geographic coverage and real-world relevance unattainable through traditional research programmes. This study is an exploration of overall correlational patterns, and its primary goal is to provide a solid basis for guiding future research into potential mitigation measures that can reduce PFAS concentrations in backyard eggs, providing a basis for potential solutions for a global societal problem. Ultimately, knowledge on the contribution of local factors that explain variability in PFAS concentrations is also relevant for identifying cost-effective mitigation measures to lower PFAS concentrations in eggs of free-ranging laying hens.
Methods
Study design and PFAS testing
All PFAS measurements used in this study were based on samples submitted by citizens to laboratories accredited to ISO/IEC 17025. Citizens then reported their laboratory results to the website pfasinkaart.nl, which has been online since 6 April 2024. The first registered laboratory report, submitted retrospectively, dates from 24 January 2024. Sampling was uncoordinated and performed at the participant’s own initiative and expense. Participants typically sent (non-frozen) eggs from their backyard chickens by post to accredited laboratories. The eggs were not frozen before or during shipment. Testing is relatively expensive, with prices generally ranging between €125 and €270 depending on the laboratory and number of PFAS analysed. Most samples were analysed by three main laboratories, each operating through a corresponding commercial testing website: testenoppfas.nl (Normec, 78% of the samples, 10 whole eggs per test), pfastest.nu (Cotecna, 11%, minimum of one egg or a homogenized mixture), triskelion.nl (Triskelion, 9%, homogenized mixture of 6 to 12 eggs) and “Other” (a variety of other labs, 2%). Because both the website and laboratory names are often used interchangeably in public communication, this paper consistently refers to the laboratory name to avoid confusion. All laboratories tested PFAS concentrations (in μg/kg egg wet weight) for at least the EFSA-4, and, depending on the laboratory, up to 23 PFAS in total. For consistency across the full dataset, this study analysed only the EFSA-4 (PFOS, PFOA, PFNA and PFHxS), which were reported by all laboratories. Detailed extraction and instrumental protocols were not publicly available for all laboratories. All laboratories were accredited to ISO/IEC 17025 and reported concentrations of PFOS, PFOA, PFNA and PFHxS in egg samples. To assess whether laboratory-specific procedures would influence the measured PFAS concentrations, laboratory identity was included as a factor variable in the statistical models.
Table 1 - Data fields registered on pfasinkaart.nl or derived from the table values. Variables in italic are used in model fitting. All measured PFAS concentrations (used as response variables) were expressed in μg/kg egg wet weight.
|
Source |
Variable |
Type |
Description |
Unit |
|---|---|---|---|---|
|
PFAS egg concentrations |
||||
|
Data field |
PFOS |
Numeric |
Perfluorooctanesulfonic acid |
μg/kg |
|
Data field |
PFOA |
Numeric |
Perfluorooctanoic acid |
μg/kg |
|
Data field |
PFNA |
Numeric |
Perfluorononanoic acid |
μg/kg |
|
Data field |
PFHxS |
Numeric |
Perfluorohexanesulfonic acid |
μg/kg |
|
Derived |
ΣPFAS |
Numeric |
Sum of the above |
μg/kg |
|
Laboratory properties |
||||
|
Data field |
lab_name |
Factor |
The sample testing laboratory |
|
|
Data field |
lat, lon |
Numeric |
Coordinates of the sampling location (WGS84) |
Decimal degrees |
|
Derived |
x, y, x_km, y_km |
Numeric |
Coordinates of the sampling location (EPSG= 28992) |
km |
|
Data field |
lab_date |
Date |
Date on laboratory test report |
day-month-year |
|
Derived |
cday_2024 |
Numeric |
Days since January 1st 2024 |
|
|
Chicken enclosure properties |
||||
|
Data field |
hens_n3 |
Numeric |
Number of hens kept |
|
|
Data field |
hens_age |
Numeric |
Average age of hen whose eggs were sent off for testing |
years |
|
Data field |
eggs_n |
Numeric |
Number of eggs laid per hen per week |
|
|
Data field |
outdoor |
Factor (yes/no) |
Do the chickens have access to an uncovered outdoor space? |
|
|
Data field |
area_out |
Numeric |
The total area of uncovered outdoor space |
m2 |
|
Derived |
area_out_hen3 |
Numeric |
The total area of uncovered outdoor space divided by the number of hens (hens_n). Log represents natural logarithm |
m2 |
|
Feed properties |
||||
|
Data field |
water_src |
Factor (tap/rain/ground) |
Source of drinking water for the chicken |
|
|
Data field |
feed |
Factor1 |
What type of food is provided to chickens |
|
|
Data field |
always_feed |
Factor (yes/no) |
Do the chickens always have food available? |
|
|
Derived |
feed_organic |
Factor (yes/no) |
Do the chickens (partly) receive organic feed? |
|
|
Derived |
feed_mealworms |
Factor (yes/no) |
Do the chickens receive mealworms as feed? |
|
|
Derived |
feed_scraps |
Factor (yes/no) |
Do the chickens receive kitchen scraps as feed? |
|
|
Location properties |
||||
|
Derived |
soil_class |
Factor2 |
The class of sediment derived from Dutch soil map |
|
|
Derived |
dist_Chemours |
Numeric |
Distance to Chemours Dordrecht (51.81691° N, 4.72816° E) |
km |
|
Derived |
dist_coast |
Numeric |
Distance to coastline (“Basiskustlijn”) |
km |
1 Unique values for feed type include laying pellets, grain mix, kitchen scraps, free-range mix, mealworms (live or dried), laying mash, other, and organic. Multiple options allowed. 2 Unique values for soil class are shown in the supplement, Figure S1 3 In the model, the natural logarithm of hens_n and area_out_hen was included
Citizen data collection
Each registration included a copy or screenshot of the laboratory results, which was used to validate the entered PFAS concentrations. Participants were also asked to provide supplementary information regarding their chicken husbandry, including housing and feeding practices. The data collection has been an evolving process, with new explanatory variables being added to the dataset over time. Table 1 presents an overview of the registered variables. The data were provided anonymously, with personal information removed before release for statistical analysis, in line with the General Data Protection Regulation (GDPR).
Independent data for reporting bias assessment
To assess potential reporting bias, specifically whether participants with higher PFAS concentrations were more or less likely to upload their test results to pfasinkaart.nl, we obtained data on ΣPFAS concentrations in chicken eggs directly from testenoppfas.nl, for which samples were analysed by Normec. This independent dataset contained data from 3,548 samples with laboratory sample receipt date between 13 March 2024 and 28 May 2025.
Whereas pfasinkaart.nl includes only test results voluntarily uploaded by participants, the testenoppfas.nl database contains all samples analysed by Normec, and was therefore not subject to potential reporting bias. However, the testenoppfas.nl data received only contained the ΣPFAS concentrations and egg sample receipt date, and lacked additional husbandry or location data available in the pfasinkaart.nl data.
To align the independent testenoppfas.nl dataset (which records egg sample receipt date) with Normec results submitted to pfasinkaart.nl (which records laboratory report date) over the same time period, we used those Normec laboratory reports uploaded on pfasinkaart.nl to estimate the average time lag between egg sample receipt date and the corresponding laboratory report date. This time lag was estimated at 7.6 days. Accordingly, we selected Normec laboratory results uploaded to pfasinkaart.nl from 21 March 2024 to 5 June 2025, corresponding to an eight-day offset.
Data preparation
Limits of quantification (LOQs) for PFAS varied across laboratories. The “Other” category included data from Nutricontrol (n=3), Bodemkundige Dienst van België (n=1), ECCQ (n=1), TLR International Laboratories (n=1), SGS Environmental Analytics (n=3), NofaLab (n=5), Wageningen (n=4), Lovap NV (n=1), and Eurofins (n=2). Nutricontrol, Bodemkundige Dienst van België, and ECCQ applied LOQs equal to the EU maximum levels (see table 2), which were considered uninformative for our analysis, and were therefore excluded. TLR International Laboratories and SGS Environmental Analytics applied an LOQ of 0.2 µg/kg and were also excluded. Data from all other laboratories were retained. Normec, Eurofins, and Lovap NV applied an LOQ of 0.10 µg/kg. Wageningen used an LOQ of 0.01 µg/kg, while all remaining laboratories applied an LOQ of 0.05 µg/kg. Triskelion also used an LOQ of 0.05 µg/kg but reported all values below this threshold as 0 µg/kg. Although regression-based methods exist to handle such left-censored data (EFSA, 2010), those are not readily available for the Generalised Additive Models (GAMs) we used for this research. Instead, the LOQs values in the database were replaced with the mean concentration below the LOQ, derived using maximum likelihood estimation (MLE) (Helsel, 2012). Traditionally, this is achieved by assuming a log-normal distribution for concentrations. Because the data showed an excess of PFAS concentrations close to zero, a similar likelihood-based approach was used, assuming a Tweedie distribution. The Tweedie distribution is flexible and encompasses a range of statistical distributions, including a normal distribution with log link function. For each PFAS, the distribution parameters were estimated by minimizing the following negative log-likelihood function:
-
\(\mathcal{L}(\mu,\phi,p) = - \left( \sum_{i:y_{i} \geq LOQ}^{}{\log\left( f\left( y_{i}|\mu,\phi,p \right) \right)} + \sum_{i:y_{i} = LOQ}^{}{\log\left( F\left( y_{i}|\mu,\phi,p \right) \right)} \right)\ \)
where \(f( \cdot )\) is the probability density function (function dtweedie, R-package ‘tweedie’) and \(F( \cdot )\) is the cumulative distribution function (CDF) (function ptweedie, R-package ‘tweedie’). The parameters \(\mu\), \(\phi\), and \(p\) are the mean, dispersion and power parameter respectively. The parameters were estimated using the optim-function in R (method = “BFGS”). Next, based on the estimated parameters for each laboratory, the conditional expected mean of the log concentration was calculated:
-
\(Ε\left( log(y)|y < LOQ \right) = \frac{\int_{0}^{LOQ}{\log(x) \bullet f\left( x|\mu,\phi,p \right)}}{F\left( LOQ|\mu,\phi,p \right)}\)
which was subsequently exponentiated to obtain the expected geometric mean. The \(log(x)\) was applied so that conditional expectations were evaluated on the same scale as the linear predictor of the Tweedie GAM, which uses a log-link function. Finally, values below each laboratory- specific LOQ were replaced by the corresponding expected mean.
For the explanatory variables, the following data processing was carried out. An additional variable, the area of uncovered (i.e. without a roof) outdoor space per hen, was calculated by dividing the registered area by the number of hens kept. The variable “Access to uncovered outdoor space” was recorded as yes or no. For the variable “feed”, a combination of different options could be entered on pfasinkaart.nl: laying pellets, grain mix, kitchen scraps, free-range mix, mealworms (live or dried), laying mash, other, and organic. From these variables, three specific factor variables were extracted, namely whether each feed combination included organic ingredients (yes/no), mealworms (yes/no), or kitchen scraps (yes/no). The date of egg collection was not provided. Instead we used the date of the laboratory report, typically 2 to 3 weeks post-collection. The date was expressed as the number of days elapsed since January 1, 2024.
In certain cases, values for some explanatory variables were missing. When fitting a model with multiple explanatory variables, this would require excluding all sampling points lacking data for any explanatory variable. To avoid unnecessary data loss, we applied multivariate imputation (Kenward & Carpenter, 2007; Buuren, 2018) using the mice (Multivariate Imputation by Chained Equations) package in R (Buuren & Groothuis-Oudshoorn, 2011). All explanatory variables included in the model were used for multivariate imputation. To limit computational time, a single imputed dataset was generated using method = “norm.predict”, which replaces missing values with predicted values from linear regression.
Extraction of spatial covariates
PFAS concentrations may correlate with soil class, either directly via soil intake, or indirectly through the consumption of soil fauna whose abundance depends on soil properties (Lasters et al., 2022, 2023). Soil class for each sampling point was extracted from the “bodemkaart van Nederland” (Chardon & Schoumans, 2007). Since soil texture may vary at small spatial scales (e.g. among backyards), these estimates represent a poor proxy. PFAS sampling coordinates (in latitude and longitude, WGS84) were projected to Amersfoort Rijksdriehoek coordinates (EPSG = 28992), and the value of the soil class polygon containing the PFAS sampling point was subsequently extracted. If no soil class estimate was available, for example for urban areas or sampling sites outside the Netherlands, the soil class was classified as “undefined”.
Several studies indicate that PFAS concentrations are generally higher in the vicinity of industrialised or urban areas (Cousins et al., 2022; Lasters et al., 2024). Historically, the primary source of PFOA emissions and discharges in the Netherlands was the DuPont/Chemours Dordrecht plant (51.81691° N, 4.72816° E) (Bokkers et al., 2016). Therefore, the st_distance function from the “sf” package (Pebesma, 2018) was used to calculate the distance of each PFAS sampling location to the Dordrecht plant. Another important potential pathway is the re-emission via sea-spray aerosols and subsequent coastal deposition (Sha et al., 2024). This process was represented using the distance to the nearest coastline as a proxy variable, calculated from the “basiskustlijn” coastline data (Rijkswaterstaat, 2008) using the st_distance function.
Statistical analysis
Model structure
Four response variables related to PFAS concentrations were defined: the concentrations of PFOS, PFOA, PFNA and PFHxS. The individual EFSA-4 concentrations were skewed toward higher values, and therefore a Gaussian distribution is inappropriate. Instead, the response variable was assumed to follow a Tweedie distribution; a flexible family of probability distributions that includes, among others, the Gaussian, Gamma, inverse-Gaussian, and compound Poisson-Gamma distributions (Dunn & Smyth, 2018). Generalised Additive Models were used to model variations in concentrations as smooth functions of different explanatory variables, allowing non-linear relationships between the response variable (egg PFAS concentrations) and explanatory variables (Wood & Augustin, 2002). The gam function (package: mgcv) also attempts to select the appropriate ‘wiggliness’ in order to reduce overfitting, and setting method = “REML” (Restricted Maximum Likelihood) generally results in lower chances of overfitting (compared to “GCV”) and is generally more stable and reliable for penalized terms, like random effects (Wood, 2011; Wood et al., 2016).
Initially, a base model was fitted with the following explanatory variables: the date of the lab measurement (in days) since January 1, 2024 (cday_2024), the available outdoor area per hen on the (natural) log-scale (in m² – log_area_out_hen), the number of hens kept on the log-scale (log_hens_n), weekly egg production per hen (eggs_n), the distance to the coast (in km – dist_coast), the distance to Chemours in Dordrecht (in km – dist_Chemours) and soil class (soil_class) included as a random effect variable. Subsequently, the laboratory name was added as a fixed factor variable to the model to account for potential inter-laboratory variability caused by differences in extraction and sample preparation protocols. This factor was retained in the base model only if it was statistically significant, as assessed using ANOVA F test.
To account for potential residual spatial autocorrelation, a stochastic partial differential equation (SPDE) latent field (Lindgren et al., 2011) was incorporated into the model. Although SPDE-based models can be fitted using INLA (Lindgren et al., 2011; Rue et al., 2009) or sdmTMB (Anderson et al., 2025), we used the mgcv package to take advantage of its double penalty feature for integrated variable selection and extended the GAM with SPDE functionality (Miller et al., 2020).
A spatial mesh was first constructed (function inla.mesh.2d, R package INLA) with max.edge values set to 5/k (inner) and 10/k (outer), and a cutoff parameter of 0.1/k, where k = 0.1. After loading the required SPDE functions from Miller, 2019 the existing model (including the above covariates but still excluding the SPDE term) was updated using the update function to add a smooth term of the x and y coordinates (Rijksdriehoek, in km) with a spline basis bs = “spde”.
Model selection
Traditionally, model selection is performed using likelihood-based information criteria, such as AIC, BIC, or DIC. Here, we instead employed the “double penalty” approach (Marra & Wood, 2011; Miller, 2025), which applies both a wiggliness penalty and a shrinkage penalty. This approach has the advantage that it prevents overfitting: If the data provide no evidence for a (non-linear) relationship between the response and a given explanatory variable, the corresponding smooth function is effectively reduced to a null (non-significant) effect. For each explanatory variable, a shrinkage version of a thin plate regression spline (bs = “ts”) was specified, and the select = TRUE option was used to enforce the double penalty.
In addition to the explanatory variables mentioned above, it was also investigated whether factor variables including food availability, food type (with/without mealworms, organic feed, or kitchen scraps), as well as drinking water significantly contributed to explaining egg PFAS concentrations. Since values for those explanatory variables were too frequently missing and hence, multivariate imputation was considered inappropriate, each of these factor variables was added individually to the base model described above to assess its ability to explain observed variation in PFAS concentrations. The significance of each explanatory variable was assessed using the p-value associated with the Wald F-test for its corresponding model parameters. Explanatory variables with parameter estimates significantly different from zero were considered to have a significant effect on the observed PFAS concentrations.
Model visualisation
The final model was used to show the relationship between explanatory variables and the observed PFAS concentrations. For each explanatory variable, 200 values were generated at regular intervals, with all other explanatory variables set to their median values. Predictions were then made for each variable-specific prediction dataframe using the function predict.gam. The uncertainty of the relationship between the response variable and each explanatory variable was assessed through two methods: 1) By exclusively considering the uncertainty in the estimated smooth function of the explanatory variable of interest (set type=’terms’ in the predict.gam function). 2) By considering all prediction uncertainties, including those caused by all other explanatory variables and the SPDE-term (set type=’link’ in the predict.gam function). To show the effect of the spatial covariates, including the SPDE term, a regular 200 x 200 point grid within the range of the x and y coordinates was first created. Corresponding values for other spatial covariates, including distance to the coast, distance to Chemours Dordrecht (Netherlands), and soil class, were subsequently extracted, and predictions were generated for this grid.
Modelling PFOA fractions
Existing literature (van Poll et al., 2017), visual inspection of the data, and preliminary model results suggested higher PFOA concentrations in the vicinity of the Chemours plant. To assess whether this spatial pattern was more consistent with groundwater- or wind-mediated dispersal, a separate model was fitted using the fraction of PFOA relative to summed PFAS concentrations as the response variable. This approach was based on the rationale that husbandry conditions, such as available outdoor space or flock size, introduce substantial variation in absolute PFAS concentrations, but affect all PFAS types to a similar extent. Expressing PFOA as a fraction of total PFAS was therefore expected to reduce this shared variability, yielding a smoother estimate of the spatial variation in PFOA fraction. A generalized additive model was fitted with this fraction as the response variable, assuming a beta distribution with a logit link function, modelled as a thin plate regression spline smooth (Wood, 2017) between distance and bearing (R function bearing, package geosphere) relative to the Chemours plant. Analyses were restricted to locations within 100 km of the plant, excluding sampling sites at unrealistic distances.
Results
Egg PFAS profile and concentrations
A total of 810 test observations were included in the database (pfasinkaart.nl; access date: 30 January 2026, first observation: 24 January 2024, last observation: 27 January 2026). Nine observations from laboratories with a limit of quantification (LOQ) ≥ 0.2 were excluded, leaving 801 observations for analysis. To assess potential reporting bias, the observations used in this study were compared with a full testenoppfas.nl dataset, which contained all laboratory results and was not subject to inherent reporting bias. The two datasets showed highly consistent distributions of ΣPFAS concentrations (Supplement, Figure S2), with means of 3.30 and 3.51 µg/kg, medians of 1.90 and 2.12 µg/kg and standard deviations of 4.70 and 4.59 µg/kg for the independent and pfasinkaart.nl datasets, respectively. A generalized linear model (GLM) treating ΣPFAS concentrations above 1.7 µg/kg (the EU limit for ΣPFAS) as a binomial response variable and data source (the full testenoppfas.nl dataset versus testenoppfas.nl samples included in the pfasinkaart.nl database) as the explanatory factor variable, revealed no significant difference (z = 1.654, p = 0.10), providing no evidence of selective reporting bias in pfasinkaart.nl submissions.
Table 2 - Descriptive statistics for the four types of PFAS, including their cumulative total (ΣPFAS). Summaries are based on all 801 samples.
|
Type |
Mean (μg/kg wet weight) |
SE |
Median |
Max |
EU maximum level |
% > EU maximum level |
|---|---|---|---|---|---|---|
|
ΣPFAS |
3.311 |
0.1936 |
1.896 |
102.40 |
1.7 |
52.43% |
|
PFOS |
2.872 |
0.1819 |
1.600 |
102.00 |
1.0 |
62.05% |
|
PFOA |
0.224 |
0.0165 |
0.110 |
7.80 |
0.3 |
20.22% |
|
PFNA |
0.161 |
0.0122 |
0.070 |
7.90 |
0.7 |
2.62% |
|
PFHxS |
0.054 |
0.0157 |
0.000 |
11.90 |
0.3 |
1.87% |
Note: All concentration values (mean, Standard Error (SE), Median, Maximum (Max)) expressed in μg/kg wet weight. All minimum values were below LOQ and not presented. PFOS is the most abundant PFAS, accounting for 86.7% of the EFSA-4 sum. The percentage of samples below the EU maximum levels for the EFSA-4 sum and all four individual maximum levels is 35.7%.
For the pfasinkaart.nl data used in this study, the mean summed EFSA-4 concentration was 3.31 μg/kg egg wet weight (SE = 0.19), with a median of 1.90 μg/kg (Table 2). Overall, 52.4% of the egg samples exceeded the EU maximum level of 1.7 μg/kg. Based on the EFSA tolerable weekly intake (TWI) of 4.4 ng/kg body weight for the sum of PFOS, PFOA, PFNA, and PFHxS, an individual with an average adult body weight of 78.6 kg (Centraal Bureau voor de Statistiek, 2025) and an average egg consumption of 126 g/week (which corresponds to approximately 2.5 eggs of 50 g each) estimated for the Dutch population (van Rossum et al., 2023), consumption of backyard eggs containing the average concentration observed in our dataset would correspond to ~121% of the TWI. Because backyard chicken owners likely consume more home-produced eggs than the average Dutch consumer, their PFAS intake may exceed the TWI by an even greater margin.
Among the four PFAS, PFOS was detected at the highest average concentration (2.9 μg/kg, SE = 0.18 μg/kg), exceeding the EU maximum level of 1.0 μg/kg in 62.0% of the samples (Table 2, Supplement Figure S3). PFOA was the second most abundant PFAS, with a mean concentration of 0.22 μg/kg (SE = 0.017 μg/kg), exceeding the EU maximum level of 0.3 μg/kg in 20.2% of the samples. Concentrations of PFNA and PFHxS were lower, with 2.62% and 1.87% of the samples exceeding the EU maximum levels of 0.7 μg/kg and 0.3 μg/kg, respectively.
The distributions of the observed concentrations for all four PFAS were heavily right-skewed (Supplement, Figure S4), with some observed egg concentrations of PFOS being very high (maximum: 102.4 μg/kg). Although the overall spatial distribution of the PFAS showed clear heterogeneity, some regions were characterised by relatively high concentrations compared to other areas (Figure 1). This was most evident for PFOA and PFHxS, for which higher concentrations could be identified in the west and the north along the coast (Figure 1). In addition, PFOA concentrations appear particularly high in the south-west of the Netherlands.
Within-site variability of egg PFAS concentrations
At some backyard chicken sites, eggs were sampled multiple times (ranging from two to four sampling events). All citizen-science participants who submitted repeated samples were contacted about their motivation. Reported reasons included: assuming the first test result was incorrect, interest in whether test results varied seasonally, receipt of a free test, or acquisition of a new flock of chickens. Except for one case (K, Figure 2), none of the repeated tests followed reported changes in husbandry practices. We therefore assume that inclusion of those repeated samples in the model fitting should not introduce bias. Figure 2 shows substantial unexplained variability in the observed concentrations. For example, for PFOS, the within-site variance (σ² = 0.48 on the scale of the Tweedie link function) was only slightly lower than the among-site variance (τ² = 0.52), indicating a weak consistency among repeated measurements collected at the same site.

Figure 1 - Spatial distribution of measured egg PFAS concentrations for PFOS, PFOA, PFNA and PFHxS. Each point represents an individual egg sampling location. Small dark blue points indicate egg samples in which the concentration of a PFAS is close to zero. PFAS concentrations are represented by both point size and colour (see legend). The factory symbol on the PFOA map marks the location of the fluorochemical plant Chemours near Dordrecht.
PFOS analysis model results
In the baseline model, most variables were significant (p < 0.01, Table 3) except distance to Chemours (F = 0.419, p = 0.01282) and the average age of the hens (hens_age), likely due to its correlation with the number of eggs per hen per week (r = –0.35, p < 0.0001). Inclusion of hens_age in the model led to inconsistent p-values for other variables, and it was therefore excluded from all subsequent analyses. As described in Table 3, the area of uncovered outdoor space per hen showed the strongest significant association with egg PFOS concentrations (F = 11.1, p < 0.0001), followed by date (F = 5.20, p < 0.0001), soil class (F = 0.551, p = 0.00013), number of hens (F = 1.111, p = 0.00023), number of eggs per hen per week (F = 0.516, p = 0.00774) and distance to the coast (F = 0.872, p = 0.00094). Overall, the model explained 56% of the observed variation (deviance explained) in egg PFOS concentrations. The subsequently added factor variable “lab_name” was not statistically significant (F = 0.84, p = 0.4722), suggesting that differences in analytical procedures among laboratories did not significantly affect the observed PFOS concentrations. Adding any diet-related factor variables, including whether the hens were fed organic feed (feed_organic), mealworms (feed_mealworms), or kitchen scraps (feed_scraps) also did not significantly explain variation in PFOS concentrations. Similarly, the type of water source (water_src) was not significant. In contrast, continuous access to feed (always_feed) was significant (F = 8.91, p = 0.0031, Table 4). However, this variable was available for only 507 records, of which just 100 (20%) indicated that feed was not always available. As the final model required complete data for all included predictors, always_feed was not retained despite its significance.

Figure 2 - Egg EFSA-4 concentrations at sites sampled on multiple occasions. Site A was sampled four times; Sites B and C were sampled three times each; all other sites were sampled twice. No modifications to the chicken pens were reported, except at site K, where modifications to the chicken pen (anti-root canvas, concrete tiles, and play sand) preceded the final sample. The sampling at site K two months later (red point) showed a 90% reduction in egg PFOS concentrations and non-detects of the other three PFAS. The within-site variance (σ²) and among-site variance (τ²) were estimated as, respectively, the square of the residual standard deviation and the variance of the random effect, derived from a generalized linear mixed model with sampling site as a random effect, assuming a Tweedie distribution for the PFAS concentrations.
Table 3 - Summary statistics of the final model for each PFAS. P-values shown in bold indicate explanatory variables that were significantly related to PFAS concentrations in eggs.
|
PFOS |
PFOA |
||||||||||||||||||||||||||||||||||||||||||||||||||||||||||||||||||||||||||||||||||||||||||
|---|---|---|---|---|---|---|---|---|---|---|---|---|---|---|---|---|---|---|---|---|---|---|---|---|---|---|---|---|---|---|---|---|---|---|---|---|---|---|---|---|---|---|---|---|---|---|---|---|---|---|---|---|---|---|---|---|---|---|---|---|---|---|---|---|---|---|---|---|---|---|---|---|---|---|---|---|---|---|---|---|---|---|---|---|---|---|---|---|---|---|---|
|
|
||||||||||||||||||||||||||||||||||||||||||||||||||||||||||||||||||||||||||||||||||||||||||
|
PFNA |
PFHxS |
||||||||||||||||||||||||||||||||||||||||||||||||||||||||||||||||||||||||||||||||||||||||||
|
|
||||||||||||||||||||||||||||||||||||||||||||||||||||||||||||||||||||||||||||||||||||||||||
Note: edf = effective degrees of freedom; F = F-statistic; p-values < 0.01 are shown in bold. Additional summary statistics for the different models: PFOS-model: Deviance explained = 55.6%, PFOA-model: Deviance explained = 53.2%, PFNA-model: Deviance explained = 61.8%, PFHxS-model: Deviance explained = 89.0%
The smooth function of the most significant explanatory variable, the area of uncovered outdoor space per hen, indicated that PFOS concentrations increased with larger outdoor space (Figure 3). However, even for very small areas (approximately 1 m² per hen), the estimated concentration was not zero but remained around 0.7 μg/kg. The model further showed a temporal decline in PFOS concentrations, with the lowest values observed between April and September 2025 (Figure 3). The number of hens also showed a negative association with PFOS concentrations. Soil class, included as a random effect, was statistically significant but highly uncertain due to limited samples per class. Concentrations were lowest on coarse sand, slightly loamy fine sand, heavy clay and clay, and highest on silty loam (Supplement, Figure S1). The number of eggs per hen per week also showed a negative relationship with egg PFOS concentration, with the lowest concentrations in eggs from hens laying almost daily. Finally, PFOS concentrations were highest at sampling points closer to the coast. The spatial latent field, capturing small-scale variation, showed a highly heterogeneous pattern with residual highs and lows in PFAS concentrations which could not be explained by the other model covariates (Supplement, Figure S5).
Table 4 - Model statistics for factor variables individually added to the baseline model. When lab_name was significant (p < 0.01), it was retained in the baseline model, after which all food- and water-related factor variables were individually added to the baseline model including lab_name. P-values shown in bold indicate explanatory variables that were significantly associated with PFAS concentrations in eggs.
|
PFOS |
PFOA |
|||||||||||||||||||||||||||||||||||||||||||||||||||||||||||||||||||||||||||||
|---|---|---|---|---|---|---|---|---|---|---|---|---|---|---|---|---|---|---|---|---|---|---|---|---|---|---|---|---|---|---|---|---|---|---|---|---|---|---|---|---|---|---|---|---|---|---|---|---|---|---|---|---|---|---|---|---|---|---|---|---|---|---|---|---|---|---|---|---|---|---|---|---|---|---|---|---|---|---|
|
|
|||||||||||||||||||||||||||||||||||||||||||||||||||||||||||||||||||||||||||||
|
PFNA |
PFHxS |
|||||||||||||||||||||||||||||||||||||||||||||||||||||||||||||||||||||||||||||
|
|
Note: df = degrees of freedom; F = F-statistic; β = coefficient (only shown for 2-factor variables). Within the PFHxS model, the categorical variable lab_name (with more than two factor levels) was significantly associated with PFHxS concentrations, with coefficients of β = −0.82 for Triskelion, β = 1.36 for pfastest.nu and β = 0.58 for Other.
PFOA analysis model results
In the baseline model, PFOA concentrations were significantly related to distance to Chemours (F = 6.056, p < 0.00001), the area of uncovered outdoor space per hen (F = 5.687, p < 0.00001), distance to the coast (F = 2.493, p < 0.00001), soil class (F = 0.621, p = 0.00001), the total number of hens (F = 1.530, p = 0.00002) and the number of days since 1 January 2024 (F = 0.691, p = 0.00233) (Table 3; Figure 3). The number of eggs laid per hen per week was not statistically significant (F = 0.373, p = 0.01955), but close to the significance threshold of 0.01. Diet-related variables (organic feed, kitchen scraps, and mealworms), water source, and the laboratory performing the analysis showed no significant relationships with PFOA concentrations. Continuous access to feed was associated with significantly lower PFOA concentrations in eggs (F = 11.65, p = 0.0007, Table 4). Overall, the model explained 53.2% of the observed variation (deviance explained).
The variable that best explained variation in PFOA concentrations was distance to the fluorochemical plant Chemours, showing a strong negative trend (Figure 4). The fitted GAM smooth indicated that modelled PFOA concentrations declined to 50% of the concentration predicted near the Chemours plant at approximately 34.5 km. The area of uncovered outdoor space per hen showed the same pattern as for PFOS, with concentrations increasing as hens had access to larger outdoor areas. PFOA concentrations also decreased with increasing distance from the coast, with coastal sites containing roughly twice the concentrations observed far inland. Among soil classes, the lowest concentrations occurred at locations containing slightly loamy fine sand, and highest concentrations at locations containing sandy loam (Supplement, Figure S1). Sampling date (days since 1 January 2024) was negatively related to PFOA concentration, although the association was weaker than for PFOS. Finally, as for PFOS, PFOA concentrations declined with increasing egg production per hen. The model-based spatial prediction indicated that variation in PFOA was primarily driven by distance to Chemours (Figure 4), with a smaller contribution from distance to the coast (Figure 5), while the latent field revealed residual spatial heterogeneity (Supplement, Figure S5).
We also estimated the fraction of PFOA relative to the sum of the EFSA-4, which allowed us to model and visualize areas where PFOA was relatively more abundant, compared to other detected PFAS. The spatial distribution of the PFOA fraction is shown in Figure 6. Although a few outliers are present (e.g., near Harlingen in the north), the PFOA fraction was relatively high in the vicinity of the fluorochemical plant Chemours, particularly in the area to the north-east, consistent with the dominant south-westerly wind direction (Figure 7).

Figure 3 - GAM-estimated relationships between significant explanatory variables and observed egg concentrations of PFAS. The bold line represents the average estimate, and shaded areas indicate the 95% confidence intervals. Tick marks on the x-axis represent observed values for the explanatory variables used in model fitting. The area of uncovered outdoor space per hen and the number of hens kept are shown on a logarithmic scale. Except for the explanatory variable shown in each graph, the values for all other explanatory variables were fixed at their median values.

Figure 4 - Modelled PFOA concentrations in relation to distance to the Chemours plant, based on the fitted GAM. Predictions are expressed in μg/kg egg wet weight and were generated with all other predictors held at their median values or reference levels. The fitted smooth indicated a 50% decline in modelled PFOA concentration at approximately 34.5 km from the plant, relative to the concentration predicted near the plant. The spatial latent field was excluded so that the figure represents only the modelled effect of distance to Chemours.
PFNA analysis model results
Similar to PFOS, the log-transformed area of outdoor space per hen and sampling date were highly significant predictors of PFNA concentrations (F = 4.166 and 1.688, respectively; both p < 0.00001, Table 3). PFNA concentrations were highest in chicken runs with large outdoor areas and lowest in egg samples collected most recently (Figure 3). The number of hens was also highly significant (F = 3.343, p < 0.00001), with lower concentrations observed at sites with more hens (Figure 3). Similarly, the number of eggs laid per hen per week was significant (F = 1.228, p = 0.00004), showing lower PFNA levels in eggs from hens with higher laying rates (Figure 3). Soil class was significant as well (F = 0.302, p = 0.00015), with the lowest concentrations in regions characterised by (slightly) loamy fine sand (Supplement, Fig S1). Distance to the coast was also significant (F = 0.731, p = 0.00038), with higher concentrations near the coast (Figure 5). Distance to Chemours was not significant. The factor variables related to diet (organic feed, kitchen scraps, and mealworms), water source, continuous feed availability, and the laboratory performing the analysis showed no significant relationships with PFNA (Table 4). Overall, the model (including the spatial latent field) explained 61.8% of the observed variability.
PFHxS analysis model results
For PFHxS, the variable describing the laboratory conducting the testing was highly significant (F = 14.31, p < 0.0001, Table 4), with Triskelion reporting relatively lower concentrations (β = -0.82) and pfastest.nu higher concentrations (β = 1.36) compared to Normec. Hence, this variable was retained in the baseline model. Among the continuous covariates, the log-transformed area of uncovered outdoor space per hen was the most important explanatory variable (F = 10.887, p < 0.0001, Table 3, Figure 3), showing a strong positive relationship, with the highest concentrations observed in flocks with the largest outdoor areas. Distance to the coast was also highly significant (F = 10.124, p < 0.0001, Figure 3, Figure 5), with narrow confidence intervals (Figure 3), narrower than for any other PFAS. Soil class, included as a random effect, was significant as well (F = 0.593, p < 0.0001), with low PFHxS concentrations in regions with clay and coarse sand, but higher concentrations in clay complexes and light sandy loam (Supplement, Figure S1). The number of eggs laid per hen per week was also significant (F = 1.324, p < 0.0001), with lower concentrations in eggs from hens with higher laying rates (Figure 3). Sampling date was not statistically significant (F = 0.268, p = 0.0181) but was close to the significance threshold of 0.01. The effect of the total number of hens on PFHxS concentrations was also not significant (F = 0.013, p = 0.16773) nor was distance to Chemours (F = 0.000, p = 0.57936). Overall model performance was high, with an explained deviance of 89.0%.

Figure 5 - Modelled egg concentrations of PFOS, PFOA, PFNA and PFHxS associated with distance to the coast, based on the fitted GAMs. Predictions are expressed in μg/kg egg wet weight and were generated with all other predictors held at their median values or reference levels. Note that colour scales differ among panels. Although the association with distance to the coast was strong for PFHxS, its predicted absolute concentrations remained low. The spatial latent field was excluded so that the maps represent the modelled effect of distance to the coast only.
Among the remaining categorical variables, continuous access to feed (always_feed) was also highly significant (F = 20.25, p < 0.0001, Table 4), with eggs from hens that had continuous access to feed showing lower PFHxS concentrations. None of the other variables related to feed type or drinking water source were significant.
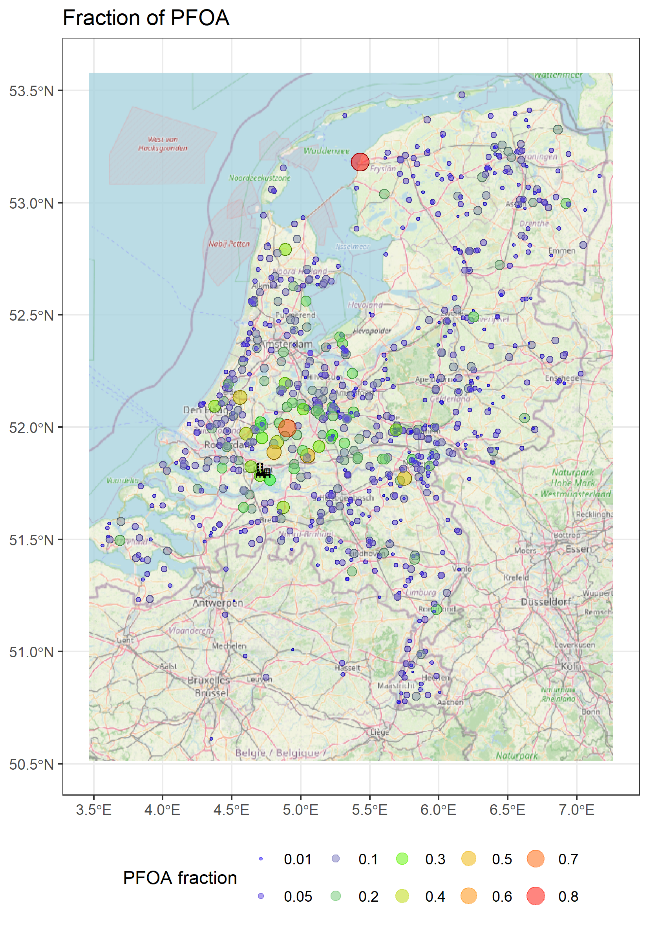
Figure 6 - The spatial distribution of the fraction of PFOA in chicken eggs relative to sum of the four PFAS concentrations. The highest fractions are found primarily around the fluorochemical plant Chemours and appear to be higher towards the north-east.
Discussion
Egg PFAS profile and concentrations
This study is based on citizen science data collected by private owners of backyard chickens. Approximately 3% of Dutch households keep hobby poultry (mainly chickens), corresponding to an estimated 1.1–1.7 million birds (Ipsos, 2025). Hobby poultry keeping is also common in other European countries, although comparable estimates are scarce. This study shows that PFAS contamination is omnipresent in free-ranging chicken eggs across the Netherlands. PFOS dominates the observed PFAS concentrations and most frequently exceeds the EU maximum level, with measured PFOS concentrations exceeding 1.0 μg/kg in 62% of registrations. Although average PFOA concentrations were substantially lower than those of PFOS, PFOA was still detected at notable levels, especially when compared with the lower EU maximum level of 0.3 μg/kg for PFOA: 20% of egg samples exceeded the EU maximum level for PFOA, indicating that PFOA remains a compound of concern despite its lower overall concentrations. Based on the average weekly egg consumption and average adult body weight, the intake from backyard eggs at the mean observed concentration corresponds to ~121% of the EFSA tolerable weekly intake (TWI) for the sum of PFOS, PFOA, PFNA, and PFHxS. This implies that the TWI would already be exceeded through backyard egg consumption alone, leaving no remaining margin for additional PFAS exposure from other dietary sources, which is of concern given the ubiquity of PFAS in the general diet.

Figure 7 - Modelled PFOA fraction (on logit-transformed colour scale) as a function of the interaction between distance and bearing relative to Chemours. A bearing of 0° represents locations directly north of Chemours. The highest predicted fractions occurred mainly at short distances north-east of the plant.
Comparable high PFAS concentrations in chicken eggs are also reported elsewhere in Europe. In Belgium, especially near Antwerp, PFAS in home-produced eggs were also dominated by PFOS and frequently exceeded health-based values (Lasters et al., 2022, 2024). In Germany, a nationwide NGO survey detected PFAS in 14 of 22 egg samples, with backyard eggs more affected than retail eggs and PFOS being dominant (Kuhlmann, 2025). In Greece, backyard eggs contained multiple PFAS per sample, with PFOS likewise dominant (Arvaniti et al., 2025). Across the EU, eggs are recognized as a relevant contributor to dietary PFAS exposure (EFSA CONTAM Panel et al., 2020). In the surroundings of a fluorochemical facility in China, PFBA and PFOA were the dominant compounds in home-produced eggs (Su et al., 2017; Wang et al., 2019). Together, these results indicate that contamination in free-ranging chicken eggs can be driven by global and site-specific emission sources. PFOS may be dominant in eggs partly because it is widely present in the environment, bioaccumulates in soil biota, and is efficiently transferred to eggs due to its strong binding affinity to specific egg lipoproteins (Su et al., 2017).
Within-site variability of egg PFAS concentrations
Repeated sampling at locations revealed substantial temporal variability in PFAS concentrations, with within-site variation nearly matching that among-site variation. This indicates that concentrations measured at the same location on different dates could be almost as variable as those measured at distinct sites. This suggests that a site below the regulatory maximum level on one date may exceed it on another, depending on environmental and biological conditions that fluctuate seasonally or stochastically. Consequently, although a single laboratory test may provide a rough indication of where high PFAS concentrations occur, it cannot be regarded as a conclusive indicator of human exposure. Egg PFAS measurements should instead be interpreted as dynamic and time dependent, reflecting both spatial heterogeneity and within-site variability. This finding underscores the need for repeated sampling in future monitoring efforts and warrants caution when communicating “safe” or “unsafe” outcomes based on a single measurement.
Because PFAS are highly persistent (Lasters et al., 2023), their concentrations in soil are unlikely to be as temporally dynamic as those observed in eggs. The pronounced temporal variability therefore likely reflects time-varying and stochastic processes associated with PFAS uptake by hens and egg excretion. Potential drivers of this variability, including husbandry practices and seasonally varying environmental and biological factors (e.g., changes in foraging behaviour and exposure availability), are discussed in the following sections.
Spatial variation and source influences
For PFOA, there was a strong relationship visible between the concentrations in chicken eggs and the distance to the operational fluorochemical plant Chemours in Dordrecht, historically the main emitter and discharger of PFOA in the Netherlands up to 2012. Higher PFOA concentrations were also measured in human blood serum from individuals living near the Chemours plant (van Poll et al., 2017). Other studies have also found strong associations between PFAS concentrations in wild birds and distance from fluorochemical plants, or other industrialized or urban areas. In China, PFOS concentrations in chicken eggs collected near an industrial plant averaged 85.2 μg/kg, with maximum values reaching 340 μg/kg (Wang et al., 2010). PFBA concentrations were sometimes even higher, with average concentrations of 81.38 μg/kg and a maximum of 1698 μg/kg detected in egg yolk (Wang et al., 2019). High concentrations have also been found in other species living near industrial plants. For example, high concentrations of PFOS have been measured in Great Tits (Parus major) near chemical plants in Belgium (Dauwe et al., 2007), and PFAS levels in Bald eagle (Haliaeetus leucocephalus) nestlings in urban and industrialized areas were significantly higher than in more remote locations (Route et al., 2014). The fitted model indicated a 50% decline in predicted PFOA concentrations at approximately 35 km from the Chemours plant. Given this relatively large distance, airborne dispersal is likely the most logical explanation. This hypothesis is further supported by analysing PFOA as a fraction of total PFAS. Because the present study indicates that PFAS concentrations are strongly influenced by variables related to soil associated exposure pathways (e.g., the total available outdoor area per hen), calculating this fraction partly controls for such intake effects. The modelled PFOA fraction reveals a significant interaction between distance and bearing to the point source (Chemours), with highest PFOA fractions observed at a bearing of 30° from Chemours, corresponding to the downwind region of the prevailing south-westerly winds in the Netherlands.
The importance of airborne dispersal is also supported by the effect of distance to the coast, which is observed for all four PFAS and is particularly strong for PFHxS and PFOA. A plausible explanation for the higher concentrations along the Dutch coast is that higher PFAS concentrations present in river discharge are transported northward along the coastline, after which sea spray aerosols distribute these compounds inland via wind forcing. This is supported by high concentrations of PFAS reported in sea foam (Sha et al., 2024), which forms in association with high levels of organic matter, such as decomposing phytoplankton and zooplankton. Although there is also an effect of distance to the coast for PFOS, the model fitted to PFOS data explained considerably less spatial variability, suggesting a more heterogeneous distribution consistent with more widespread legacy emission patterns described earlier.
Husbandry variables affecting PFAS concentrations in backyard eggs
The area of uncovered outdoor space (m²) per hen is one of the most important variables explaining the observed concentrations of all four PFAS (i.e. PFOS, PFOA, PFNA and PFHxS). Because these models were developed independently, this further underscores the importance of this husbandry-related variable. The high concentrations of PFAS in chicken eggs are consistent with exposure via the consumption of both soil and soil fauna. Hens may feed on invertebrates, such as earthworms, snails, slugs, isopods, and spiders (Buytaert et al., 2025; Vrijenhoek et al., 2026). When chickens have more foraging space available per hen, it is likely that this leads to greater access to and intake of soil fauna, amplifying exposure via trophic transfer. When there are more hens (per square meter), it is likely that competition among them for this food source plays a role, which may explain why outdoor area per hen, rather than total outdoor area, provides the strongest explanation for observed PFAS concentrations. Since geographic heterogeneity was explicitly modelled using a latent spatial field, the effect of outdoor area per hen is unlikely to be a surrogate for “urban versus rural” location. Rather, it most likely captures local exposure mechanisms related to the chicken run.
PFOS, PFOA and PFNA also showed a negative relationship with the total number of hens in each enclosure. One possible explanation is that this pattern may reflect differences in management practices among chicken owners with small and larger flocks. For example, contamination of soils with dioxins and dioxin-like PCBs has previously been recognised as a concern in free-range eggs, and in response, semi-commercial egg producers may have modified their enclosures (e.g., by altering soil type) to reduce such contamination (Schoeters & Hoogenboom, 2006), which may also lower PFAS uptake. However, a behavioural explanation appears most plausible: hens in larger groups tend to spend more time inside their shelter close to their primary food source, and if they do venture outside, they tend to remain close to the main flock and are less likely to forage at the enclosure periphery (Bonnefous et al., 2022; Campbell et al., 2017; Collins & Sumpter, 2007). This may contribute to explaining why commercial organic farms, despite being required to provide >4 m² of outdoor space per hen, often remain below the EU maximum level for PFAS (NVWA, 2024). Other differences between commercial and backyard systems, including laying intensity, hen age, continuous access to formulated feed and management of the outdoor soil, may also contribute to the lower concentrations.
This study revealed a significant negative relationship between egg-laying frequency and PFAS concentrations, with eggs from hens producing more eggs per week showing lower PFAS levels. Laying frequency was, in turn, negatively correlated with hen age, suggesting that part of the observed age-related pattern found in other studies (Geerlings et al., 2024; Lasters et al., 2022) may be mediated through laying intensity. Egg-laying is an important elimination mechanism for PFAS in birds, with PFAS present in tissues (primarily liver, kidney, muscle and blood plasma) being transferred to the egg during egg production (Holmström & Berger, 2008; Newsted et al., 2007). For hens, this is reflected in the relatively short average half-life of 4.3 days of PFOS in eggs (Kowalczyk et al., 2020). Therefore, a higher laying frequency or the production of larger eggs is expected to lead to more rapid dilution and, consequently, shorter half-times. It is important to note, however, that lower PFAS concentrations per egg do not necessarily translate into lower dietary exposure, because larger flocks and higher laying rates may increase the total number of eggs consumed.
The analysis did not identify a significant effect of the type of chicken feed or the availability and type of water source, at least for the feed and water categories registered within this study. The only variable that shows a significant (p-value < 0.01) negative effect on PFOS, PFOA and PFHxS concentrations is whether the hens had permanent access to food. An explanation is that a continuous supply of food may lead to a lower incentive to find other food sources elsewhere, like soil organisms.
Finally, soil type may also influence PFAS concentrations. Because detailed soil type information was not consistently available, we derived soil class from an available soil map of the Netherlands instead, representing native soil conditions rather than local anthropogenic modifications. Among the covariates considered, soil class showed only a modest contribution to the observed variation, with overlapping random effect estimates, yet some consistency in the relation between soil class and PFAS concentrations was apparent. Eggs from hens kept on coarse or slightly loamy sand generally contained lower PFAS concentrations than those from clay-rich soils. This aligns with the findings of Lasters et al. (2023), who found strong indications that soil physicochemical properties, including organic matter, clay content and pH, influence PFAS bioavailability through the dominant exposure pathways of foraging hens. Whereas sandy soils tend to retain less PFAS, the higher sorption capacity of clay can concentrate PFAS on solid particles, increasing exposure through direct soil ingestion. Furthermore, sandy soils tend to contain fewer soil invertebrates compared to clayey soil, including earthworms (Bedano et al., 2016), which could represent an important exposure source for egg-laying hens (Lasters et al., 2023). It should be emphasized that the analysis is correlational in nature. Unmeasured variables such as spatial heterogeneity in soil PFAS concentrations arising from local sources, unrecorded husbandry practices (e.g., whether hens were allowed to roam beyond the uncovered outdoor enclosures), and soil modifications, may have contributed to the observed variation in PFAS concentrations. Accordingly, the inferred relationships should be interpreted as hypotheses that warrant targeted follow-up studies rather than as evidence of causality.
Soil or fauna intake?
The area of uncovered outdoor space per hen (m²) emerged as one of the most important variables explaining the observed concentrations of all four PFAS, strongly suggesting a key role of soil-related exposure pathways in PFAS uptake. Consistent with this, Lasters et al. (2023) showed that PFAS concentrations in soil explain a substantial proportion (e.g. 42% for PFOS) of the variation observed in PFAS concentrations in eggs. An open question, however, is whether PFAS enter hens directly through soil ingestion or indirectly via consumption of soil-dwelling organisms that accumulate PFAS. This distinction is crucial, as it has direct implications for the effectiveness of potential mitigation measures.
To our knowledge, only one study provides a quantitative estimate (using n-alkane markers) of soil ingestion in free-ranging hens. The study reports mean dry-soil intakes of 1.1 g per day in grass-covered yards and 2.1 g per day under tree cover, with an upper bound of approximately 3 g per day (Jurjanz et al., 2015). This study was conducted in free-ranging broiler chickens, and the experimental setting appears comparable to the husbandry conditions of the backyard chickens included in our analysis. Assuming ingestion of 3 g soil intake per day, complete transfer of ingested PFAS, and production of one 60 g egg per day, the resulting PFAS concentrations in eggs would be at most about 5% of the concentrations measured in soil. Because PFAS concentrations in chicken eggs are generally higher than those observed in soil for most PFAS (Lasters et al., 2023), direct soil ingestion is unlikely to be the primary exposure pathway, suggesting the most important contribution from soil fauna instead.
Reliable quantitative estimates of soil fauna intake are also scarce. It has been estimated that, depending on season (wet vs. dry), 2.15–10.69% of crop contents in scavenging chickens consisted of invertebrates (Momoh et al., 2010). These estimates likely depend strongly on factors such as the availability of outdoor space, habitat quality, and weather conditions. Nevertheless, for hens spending a relatively large proportion of time actively foraging, it is plausible that total fauna intake exceeds soil intake. Due to bioaccumulation, PFAS concentrations in soil-dwelling organisms are substantially higher than in the surrounding soil (Arcadis, 2024; Buytaert et al., 2025). This supports the hypothesis that PFAS uptake in hens occurs predominantly via consumption of living organisms, such as earthworms. The strong association between PFAS concentrations in eggs and outdoor space per hen is also consistent with this mechanism. Although lower stocking densities (i.e. more outdoor space per hen) have been associated with a higher proportion of time spent foraging (Bestman et al., 2019; Campbell et al., 2017; Gebhardt-Henrich et al., 2014), reported differences between 0.5 and 5 m² per hen correspond to only a 24% increase in foraging time (Campbell et al., 2017). In contrast, our observations—particularly for PFOS—indicate approximately a doubling in egg PFAS concentrations, suggesting that changes in exposure intensity or prey availability, rather than foraging time alone, are driving the observed patterns.
The within-site variability also suggests that PFAS concentrations are dependent on a more stochastic process. While PFAS in soil is highly persistent, and hence relatively stable over time, PFAS concentrations in eggs from backyard chickens show high temporal variability, with the lowest PFAS concentrations observed during an exceptionally dry period (April–September 2025), environmental conditions under which earthworm abundance tends to decline (Singh et al., 2019). Therefore, we hypothesize that the large within-location variability in egg PFOS concentrations from free-ranging laying hens is likely driven by a combination of temporally variable prey abundance and availability, as well as seasonally dependent hen behaviour and physiology. Temporal fluctuations in the abundance and bioavailability of soil fauna may play an important role in explaining temporal variation in egg PFOS concentrations. Earthworms, for example, are known to strongly accumulate PFOS and thereby represent an important dietary exposure route for free-ranging hens (Arcadis, 2024; Lasters et al., 2023). Earthworm activity and surface availability are strongly regulated by soil moisture and temperature, with moist, moderately warm conditions promoting their presence in topsoil layers accessible to foraging hens (Eggleton et al., 2009). These effects may be further amplified indirectly through enhanced plant growth and rhizosphere activity under favorable climatic conditions, supporting higher earthworm densities.
In addition to external ecological drivers, seasonal variation in hen behaviour and physiology may contribute to the observed temporal patterns. Increased outdoor activity in spring likely enhances soil and soil fauna intake, while reduced egg production during winter may partly offset reduced winter foraging and intake, resulting in less dilution per egg (Lasters et al., 2019).
Limitations
This study relied on citizen-science data, with participants self-reporting PFAS concentrations and husbandry conditions. Participants decided whether and when to test their eggs and whether to submit their results to pfasinkaart.nl. Comparison with the complete Normec dataset did not indicate selective reporting of ΣPFAS concentrations among Normec customers. However, this comparison does not establish that the sampled flocks are representative of all backyard chicken flocks in the Netherlands with respect to geographic location, husbandry practices or PFAS exposure. Consequently, the dietary exposure estimate for backyard chicken owners should be interpreted with caution and should be regarded as illustrative only, as average backyard egg consumption remains unknown.
For PFAS testing, participants commissioned multiple ISO/IEC 17025-accredited laboratories, for which complete analytical protocols were not publicly available. To account for potential inter-laboratory differences, we included laboratory identity as an explanatory factor in the statistical model. This variable was significant only for PFHxS. This may partly reflect differences in LOQs or other laboratory-specific procedures, as well as the model-based replacement of values below laboratory-specific LOQs with likelihood-based expected concentrations. Consequently, the estimated effect for PFAS with many observations below the LOQ, particularly PFHxS, should be interpreted cautiously.
A further limitation is that the data collection forms were designed at the outset of the study, when the main drivers of PFAS exposure were still unknown, risking omission of relevant variables. In hindsight, we believe the most influential variables were captured, although some could have been recorded more precisely. For example, the area of uncovered outdoor space—one of the strongest explanatory variables—may have referred either to the outdoor enclosure or the entire backyard, to which hens sometimes had only occasional or seasonally variable access. This ambiguity likely contributed to the substantial variation observed within and among backyards. The observed variation may also reflect temporal and stochastic processes governing PFAS uptake by hens and subsequent excretion into eggs. One plausible explanation is weather variability, including regional differences in precipitation, which may influence availability of PFAS-contaminated biota, like earthworms. Linking PFAS variability to weather would have required precise recording of egg collection dates which were unavailable; laboratory report dates were therefore used as a proxy. Soil class was derived here from large-scale maps and may not accurately represent locally modified garden soils, which could have been characterised more reliably through in-situ measurements. In addition, some sampling points and explanatory variables contained missing values, which were replaced using deterministically imputed values. While these limitations may have affected both the precision, magnitude and functional form of the estimated associations, the main conclusions were generally consistent across PFAS compounds and aligned with the existing scientific literature.
Suggestions for future research
The statistical analysis presented here is a preliminary exploratory study. Several improvements are obvious and could yield additional and more reliable results. For example, for simplicity the concentrations of PFOS, PFOA, PFNA and PFHxS have now been modelled independently of one another rather than including all four PFAS together. Several processes, such as the area of uncovered outdoor space per hen, likely influence concentrations across PFAS. A model could be chosen that models PFAS jointly, where differences and similarities can be explicitly incorporated into a single model.
In addition to model adjustments, other or additional explanatory variables could also be incorporated. One of these is, for example, variables related to precipitation. It is expected that dry conditions, among other factors, will make soil fauna such as earthworms less accessible, and this is one possible explanation for the lower concentrations observed in laboratory reports from April and May 2025: This period was characterised by drought with an increasing rainfall deficit. Weather covariates, such as precipitation and soil moisture, could therefore be incorporated, potentially with time lags. More accurate PFAS source locations could also be incorporated.
One of the main findings of this study is that PFAS concentrations in backyard chicken eggs are influenced not only by regional contamination but also by local husbandry-related variables, such as the available outdoor space per hen and soil type. This suggests that small-scale mitigation may be feasible, even while large-scale remediation remains challenging. Replacing contaminated soil with clean soil is one such measure. However, soil excavation is a destructive remediation measure associated with a relatively high cost and a deterioration of soil ecosystem services (Lukács & Mesman, 2008). Spontaneous processes, such as deposition and the reintroduction of mobile organisms from surrounding unremediated zones, could potentially recontaminate the clean soil (Askarani et al., 2024).
Future studies could experimentally test soil interventions such as partial coverage of outdoor areas, replacement of the outdoor foraging area with sand, or measures that limit access to earthworms and other soil organisms. The latter could be tested by letting hens forage on a platform instead of the soil, thereby limiting soil and soil-fauna access. Another promising mitigation measure to be investigated could be the application of biochar in the feed, which may effectively reduce the bioavailability of PFAS and other organic pollutants in the feed, while also storing carbon dioxide and improving the breeding performance of the hens (Cornelissen et al., 2025; Schmidt et al., 2019). In parallel, long-term citizen monitoring could help evaluate the persistence of such mitigation measures and provide insight into temporal variability related to weather or soil moisture. Together, these approaches could inform practical guidance for reducing PFAS transfer to food products while complementing national efforts to limit further environmental release.
Conclusion
The citizen science project of PFAS in backyard chicken eggs enabled the rapid collection of a uniquely large and geographically diverse set of test results across the Netherlands, which would have been difficult to achieve through conventional monitoring programmes. This study showed that approximately two-thirds of samples exceeded at least one EU maximum level established for commercially sold eggs, and that consuming backyard eggs at the mean observed concentration at the average Dutch egg-consumption rate would correspond to approximately 121% of the EFSA tolerable weekly intake (TWI). Beyond data collection, the citizen-led nature of the project also highlights the societal relevance of PFAS contamination, as concerned households, at their own expense, directly contributed to scientific insight into environmental exposure pathways. While individual test results varied considerably, even among repeated samples from the same location, the collective dataset of hundreds of voluntary submissions revealed clear large-scale patterns in PFAS contamination. These patterns suggest that PFAS concentrations in backyard eggs can serve as indicators of environmental PFAS contamination.
While local sources may contribute to elevated PFAS levels in individual cases, the spatial patterns observed in this study indicate that large-scale environmental processes are important drivers of PFAS contamination in backyard eggs. For example, the strong association between PFOA concentrations and proximity to the Chemours plant in Dordrecht (Bokkers et al., 2016), as well as elevated PFAS levels along the coast, likely linked to re-emission via sea spray, support this interpretation. These findings are consistent with the long-range atmospheric and hydrological transport mechanisms that have dispersed PFAS far beyond their original industrial sources (Wang et al., 2014). The observed spatial heterogeneity likely reflects spatially diffuse contamination combined with differences in keeping conditions and environmental variability, such as weather, which may influence access to and the availability of soil biota.
Indeed, this analysis demonstrates that the area of uncovered outdoor space per hen is the strongest predictor of PFOS, PFNA, and PFHxS concentrations, and the second most important variable for PFOA (after distance to Chemours). Direct soil ingestion alone cannot explain this pattern, as soil ingestion is not expected to increase in proportion to the area of uncovered outdoor space. Instead, the relationship likely reflects increased intake of contaminated soil fauna, including earthworms, which are among the best documented examples of PFAS accumulation (Burkhard & Votava, 2023; Navarro et al., 2016). This interpretation aligns with high PFAS concentrations reported in eggs of Black-tailed Godwits (Limosa limosa) (Movalli et al., 2023), which also feed heavily on soil invertebrates. Sampling date was also significant for most of the four PFAS, likely reflecting interannual variation in soil moisture and soil fauna availability.
While human intake of PFAS through the general diet is already a significant concern, as PFAS are present in diverse food types like drinking water, seafood, and other animal products (Ericson et al., 2008), this and several other studies (EFSA CONTAM Panel et al., 2020) demonstrate that home-produced eggs often represent a substantial additional source of exposure. Since PFAS are extremely persistent and can be transported and redeposited across large areas, strong source control and reductions towards near-zero emissions would be needed to prevent further widespread contamination and exposure of humans and other organisms. In the short term, future research, as recommended, could focus on the effectiveness of modifications such as varying the free-range space, implementing soil modifications, or making outdoor areas less permeable to soil organisms to reduce PFAS intake. Such measures may, however, constrain natural foraging opportunities and therefore require careful consideration of potential trade-offs between egg consumption and animal welfare.
Acknowledgements
The authors gratefully acknowledge all backyard chicken owners who voluntarily contributed PFAS test results and contextual information through the pfasinkaart.nl platform. Their willingness to share data enabled the creation of a uniquely large and geographically diverse dataset, which made this exploratory analysis possible. We thank Kees Teuling for directing us to the digital soil class map. We thank Roeland Bom, Robbert van Himbeeck, Floor Lubberman, Rianne Nederlof, and Thea van Niekerk for their valuable input and constructive discussions. We thank the R Core Team and all R-package contributors, who made this analysis possible. We thank two anonymous reviewers for their detailed and constructive comments, and we thank Pierre Labadie for his role as recommender for PCI. Finally, we thank our families for their patience and support during the development and maintenance of the database and the preparation of this manuscript. Preprint version 3 of this article has been peer-reviewed and recommended by Peer Community In Ecotox Env Chem (https://doi.org/10.24072/pci.ecotoxenvchem.100451; Labadie, 2026).
Funding
The authors declare that they received no specific funding for this study and that the work was conducted voluntarily outside any formally funded or commissioned institutional project.
Conflict of interest disclosure
The authors of this article declare that they have no financial conflict of interest with the content of this article.
Author contributions
Data collection: D. v. D.; Conceptualization: G. A., D. v. D., R. L.; Methodology: G. A., D. v. D.; Formal analysis: G. A., D. v. D.; Writing – original draft: G. A., D. v. D.; Writing – review & editing: G. A., D. v. D., R. L. Large language models were used to assist with language editing, literature searching, and R code suggestions. All content was critically reviewed by the authors, who take full responsibility for the final manuscript.
Data, scripts, code, and supplementary information availability
Data underlying the analyses are available as an anonymised dataset and can be downloaded from https://doi.org/10.17026/LS/346HVA (Aarts et al., 2026). Because sampling locations originate from private residential gardens, exact geographic coordinates are potentially identifiable personal data and are therefore not made publicly available in accordance with data protection regulations. Therefore, substantial random spatial noise was added to the coordinates, preventing disclosure of precise residential locations.
Access to the original geographic coordinates, and exact location-derived covariates, can be provided upon reasonable request for research purposes and subject to a data use agreement. Requests can be directed to dreas@pfasinkaart.nl. Additional metadata are available via pfasinkaart.nl. The R script for preparing the data, as well as the scripts for model fitting and producing the results can also be downloaded from https://doi.org/10.17026/LS/346HVA (Aarts et al., 2026).
Supplement

Figure S1 - Estimated (random) effect for each soil class on PFOS, PFOA, PFNA and PFHxS concentrations. The error bars represent 95% confidence intervals.

Figure S2 - Comparison of ΣPFAS concentration probability density distributions (shown for low concentrations; <1 μg/kg) for the egg samples analysed by testenoppfas.nl and self-reported to pfasinkaart.nl (blue, potentially subject to reporting bias) and all testenoppfas.nl results from the same period (pink).

Figure S3 - Spatial distribution of concentrations relative to the EU maximum levels, which are defined as 1.0, 0.3, 0.7 and 0.3 μg/kg for PFOS, PFOA, PFNA and PFHxS, respectively

Figure S4 - Frequency distribution of the observed egg PFAS concentrations (in μg/kg wet weight). The vertical dotted line represents the EU maximum levels for each of the four PFAS. For presentational purposes the five highest concentrations for each PFAS-type were removed. For the EFSA-4 sum the five highest concentrations were 102.4, 60.6, 33.2, 30.4, 23.4 μg/kg, for PFOS 102, 58.9, 29.2, 27.6 and 20.8 μg/kg, for PFOA 7.8, 5.6, 3.4, 2.74 and 2.70 μg/kg, for PFNA 7.90, 1.70, 1.70, 1.50 and 1.30 μg/kg and for PFHxS 11.9, 2.80, 1.73, 0.94 and 0.89 μg/kg. Note the different range along the x-axis for each type of PFAS. Colour scheme (red and green) indicates whether concentrations are above or below the compound-specific EU maximum level.

Figure S5 - Predicted spatial distribution of the EFSA-4. Predictions include the latent spatial field and all spatial covariates retained in the model; distance to the coast (all four PFAS), distance to Chemours (PFOA only), and soil type (all four PFAS).